The Natural History of Primary Progressive Multiple
Sclerosis: Serial Clinical and MRI Evaluation and
Application of New Spinal Imaging Techniques
Valerie L Stevenson, MBBS, MRCP
NMR Research Unit
Institute of Neurology
Queen Square
London WCIN 3BG
A thesis submitted for the degree of Doctor of Medicine to
The University of London
1999
-ProQuest Number: U643735
All rights reserved
INFORMATION TO ALL USERS
The quality of this reproduction is dependent upon the quality of the copy submitted.
In the unlikely event that the author did not send a complete manuscript and there are missing pages, these will be noted. Also, if material had to be removed,
a note will indicate the deletion.
uest.
ProQuest U643735
Published by ProQuest LLC(2016). Copyright of the Dissertation is held by the Author.
All rights reserved.
This work is protected against unauthorized copying under Title 17, United States Code. Microform Edition © ProQuest LLC.
ProQuest LLC
789 East Eisenhower Parkway P.O. Box 1346
Abstract
This thesis describes the clinical and Magnetic Resonance Imaging (MRI) characteristics
of patients with primary progressive multiple sclerosis (PP MS). These patients make up
less than 10% of the MS population and because of their relative rarity, few studies have
looked at this group and only three small therapeutic trials have been undertaken to date.
By definition their course is purely progressive and therefore they are an ideal group to
study disease progression independent from the effect of relapses. In a cohort of 60
patients, cross sectional analysis revealed that patients with PP MS have lower T2 and
T1 hypo-intensity lesion loads than other patient groups. Serial analysis revealed that
despite these low lesion loads, measurable changes were seen after relatively short time
periods. Both brain and cord atrophy was also shown to develop. These results have
implications for trial design particularly in the choice of appropriate outcome measures.
As many of these patients have a predominant spinal cord syndrome which is responsible
for much of their locomotor disability, the development of several techniques aimed at
optimising spinal cord imaging are described. These include two new MR sequences, fast
FLAIR and 3- dimensional fast spin echo (3D FSE). Although the 3D FSE sequence did
increase lesion detection, the relationship between spinal cord lesion load and disability
remained poor. The fast FLAIR sequence failed to detect lesions in the cord despite
increased lesion detection in the brain, thus indicating differences in lesion composition
dependent on lesion site. This was confirmed by the subsequent quantification of T1 and
T2 relaxation times in both lesions and normal appearing white matter in MS.
This work is important in improving our understanding of the pathological processes
responsible for disease progression in MS and aids in the choice of appropriate outcome
Declaration
The work described in parts B and C of this thesis is all original.
Part B documents a cross sectional and serial study of patients with primary and
transitional progressive MS. These patients were recruited as part of the MAGNIMS
(Magnetic resonance network in multiple sclerosis) study group, an EC initiative which
brings together centres throughout Europe with an interest in both MS and MRI. I was
involved in designing the protocol and organising the data transfer from the six
participating centres. One hundred of the 211 patients recruited were seen by myself, this
involved annual clinical assessments and MRI. All of the data, from the six centres, were
analysed by myself.
I was the lead investigator for the studies outlined in chapters four, seven and eight. This
involved study design, clinical assessments, the overseeing of MRI and data analysis.
-Contents
Abstract 2
Declaration 3
List of tables 8
List of figures 9
List of abbreviations 11
Acknowledgements 14
Papers arising from this work 15
Part A
Background
17
Chapter 1: Multiple Sclerosis 18
1.1 Diagnosis 20
1.2 Epidemiology 21
1.3 Genetics 22
1.4 Immunology 23
1.5 Pathology 25
1.6 Pathophysiology of symptoms 28
1.7 Management of multiple sclerosis 29
1.7.1 Anticipation and prevention of problems 29
1.7.2 Symptomatic treatment 31
1.7.3 Therapies aimed at reduction of disease activity 31
1.7.4 Rehabilitation and service delivery 34
1.8 Primary progressive multiple sclerosis 35
-Chapter 2; Magnetic resonance imaging 40
2.1 Basic principles of MRI 40
2.2 Creating an image 47
2.3 Contrast media 50
2.4 Spinal cord imaging 50
2.5 Pulse sequences 53
2.5.1 Fast spin echo 53
2.5.2 Three dimensional fast spin echo 53
2.5.3 Inversion recovery techniques 56
2.5.4 FLAIR sequences 57
2.5.5 Inversion recovery fast spoiled gradient echo 59
Chapter 3: Application of magnetic resonance imaging to multiple sclerosis 60
3.1 MRI in the diagnosis of multiple sclerosis 60
3.2 MRI as an outcome measure in multiple sclerosis 63
3.2.1 T2 lesion volume 65
3.2.2 T1 (hypo-intensity or ‘black hole’) lesion volume 67
3.2.3 Magnetisation transfer imaging 68
3.2.4 Brain and spinal cord atrophy 69
3.2.5 Magnetic resonance spectroscopy 74
3.2.6 Diffusion imaging 75
3.3 MRI studies in primary progressive multiple sclerosis 76
-Part B
Clinical Studies in Multiple Sclerosis
79Chapter 4: Serial assessment of spinal cord atrophy 80
4.1 Study design 80
4.2 Results 81
4.3 Discussion 85
Chapter 5: A cross sectional study of primary progressive multiple sclerosis 89
5.1 Study design 89
5.2 Results 92
5.3 Discussion 97
Chapter 6: A longitudinal, two year, study of primary progressive multiple
sclerosis 100
6.1 Study design 101
6.2 Results 102
6.3 Discussion 112
Part C
Advances in Magnetic Resonance Imaging
119Chapter 7: Spinal cord imaging; improving lesion detection 120
7.1 The use of fast FLAIR in multiple sclerosis 122
7.1.1 Study design 122
7.1.2 Results 124
7.1.3 Discussion 128
7.2 Three dimensional fast spin echo imaging of the spinal cord 130
7.2.1 Study design 130
-7.2.2 Results 132
7.2.3 Discussion 134
Chapter 8: Quantification of T1 and T2 relaxation times 138
8.1 Study design 140
8.2 Results 143
8.3 Discussion 148
Chapter 9: Conclusions 153
9.1 Clinical trials in multiple sclerosis 155
9.2 Pathological changes of disability 158
Tables
1.1 Therapeutic agents in multiple sclerosis 33
4.1 Cord cross sectional area in controls and patients 83
4.2 Cord atrophy study; patient subgroups 84
5.1 Clinical findings in PP, TP and SP MS 93
5.2 MRI findings in PP, TP and SP MS 94
5.3 Presenting clinical syndromes 95
5.4 Presentation at onset in primary progressive multiple sclerosis 96
6.1 Clinical measures at baseline, year 1 and year 2 104
6.2 MRI brain findings at baseline, year 1 and year 2 106
6.3 MRI cord findings at baseline, year 1 and year 2 107
6.4 PP MS according to presenting symptom; clinical and brain MRI
findings 109
6.5 PP MS according to presenting symptom; spinal cord MRI findings 110
7.1 Lesion detection in the brain and cord by FSE and fast FLAIR 125
7.2 Lesion number by patient in the posterior fossa and spinal cord detected
by FSE and fast FLAIR 126
8.1 Comparison of NAWM and grey matter in patients and controls 145
8.2 Comparison of lesions defined by site within the brain 146
Figures
1.1 Disease course in multiple sclerosis 19
2.1 Alignment of protons within a magnetic field 41
2.2 Precession of protons 42
2.3 Transverse magnetisation following an RF pulse 43
2.4 T1 and T2 relaxation time curves 44
2.5 Free induction decay signal 45
2.6 The spin-echo sequence 47
2.7 T1 and T2 weighted images in multiple sclerosis 48
2.8 T2 weighted and post-gadolinium-DTPA T1 weighted images in
multiple sclerosis 51
2.9 Spinal cord image using the phased array coil 52
2.10 Fast spin-echo sequence 54
2.11 Axial reformats of 3D FSE, demonstrating striped motion artefact 55
2.12 Inversion recovery sequence 56
2.13 Fast FLAIR sequence 57
2.14 Fast FLAIR image of the brain in multiple sclerosis 58
3.1 Axial reformat of an IR FSPGR sequence for cord atrophy assessment 71
3.2 Brain atrophy assessment; before and after skull extraction 73
4.1 Cord cross sectional area at baseline and one year 85
7.1 FSE and Fast FLAIR images of the cerebral hemispheres, posterior
fossa and spinal cord 127
7.2 Regional analysis of 3D FSE axial reformats 132
-7.3 3D FSE in a normal control 133
7.4 2D FSE and 3D FSE images in a patient with MS 135
-Abbreviations
2D two dimensional
3D three dimensional
Bo magnetic field strength
Y gyro-magnetic ratio
(Oq frequency of precession
ADC apparent diffusion coefficient
CDMS clinically definite multiple sclerosis
cm centimetre
CNS central nervous system
COY coefficient of variation
CPMS clinically probable multiple sclerosis
CSE conventional spin echo
CSF cerebrospinal fluid
CT computerised tomography
DSS disability status scale
DTPA diethylene triaminepentaacetic acid
EC european community
EDSS expanded disability status scale
FID free induction decay
FLA IR fluid attenuated inversion recovery
FSE fast spin echo
HLA human leucocyte antigen
-ICAM-1 intercellular adhesion molecule- 1
IFNB-la interferon beta-la
IFNB-lb interferon beta-lb
IR FSPGR inversion recovery fast spoiled gradient echo
IVIG intravenous immunoglobulin
k-space the area where data is stored
LSDMS laboratory supported definite multiple sclerosis
LSPMS laboratory supported probable multiple sclerosis
MAGNIMS magnetic resonance network in multiple sclerosis
MBP myelin basic protein
MHz/T mega hertz per tesla
mm millimetre
ms millisecond
MRI magnetic resonance imaging
MRS magnetic resonance spectroscopy
MS multiple sclerosis
MX magnetisation transfer
MTR magnetisation transfer ratio
NAA N-acetyl aspartate
NAWM normal appearing white matter
NS not significant
PD proton density
PLP proteo-lipid protein
-P -P M S primary progressive multiple sclerosis
RARE rapid acquisition with relaxation enhancement
RF radio-frequency
RO I region of interest
R R M S relapsing-remitting multiple sclerosis
SD standard deviation
SNR signal to noise ratio
SP MS secondary progressive multiple sclerosis
T1 longitudinal relaxation time
T2 transversal relaxation time
T2* loss of phase due to inhomogeneities within the magnetic field
TE echo time
TEeff effective echo time
TI inversion time
TR repetition time
TLV total lesion volume
TP MS transitional progressive multiple sclerosis
VCAM-1 vascular adhesion molecule- 1
yrs years
-Acknowledgements
There are many people I would like to thank who have supported and helped me
throughout my three years of research which has resulted in the submission of this thesis.
Most importantly Professor Alan Thompson who as my supervisor has always provided
support and guidance, but particularly I thank him for his unfailing optimism and sense
of humour when thing were not going to plan. I would also like to thank Professor David
Miller and Professor Ian M'^Donald for their scientific support and ongoing enthusiasm
and encouragement.
The three years I have spent with the NMR Research Unit have been enlightening and
enjoyable, thanks go to everybody but in particular to David M‘"Manus and to the
physicists Gareth Barker and Geoff Parker for all their technical support. I would also
like to thank the other research fellows within the unit for such valuable team spirit. Niall
Tubridy, Paul Molyneux, Nick Silver and Siobhan Leary deserve special thanks for all
their moral and scientific support.
The work described in part B of this thesis was part of an EC funded initiative
(MAGNIMS). I am also extremely grateful to the Multiple Sclerosis Society of Great
Britain and Northern Ireland who not only funded my three years of research but also
support the NMR Research Unit.
Final thanks go to all my friend, old and new, my family and to Rob for his unfailing
support and encouragement.
-Papers arising from this work
Stevenson VL, Miller DH, Rovaris M, Barkhof F, Brochet B, de Sa J, Dousset V,
Dousset V, Filippi M, Montalban X, Polman CH, Rovira A, Thompson AJ. Primary
progressive and transitional progressive multiple sclerosis; a clinical and MRI cross
sectional study. Neurology 1999;52(4):839-845.
Stevenson VL, Miller DH, Leary SM, Rovaris M, Barkhof F, Brochet B, Dousset V,
Dousset V, Filippi M, Hintzen R, Montalban X, Polman CH, Rovira A, de Sa J,
Thompson AJ. A one year serial study of primary and transitional progressive multiple
sclerosis. Submitted to Brian.
Camp SJ, Stevenson VL, Thompson AJ, Miller DH, Auriacombe S, Borras C, Brochet
B, Comi G, Falautano M, Filippi M, Hérissé-Dulo L, Montalban X, Parrcira E, Polman
CH, de Sa J, Langdon DW. Cognitive function in primary progressive and transitional
progressive multiple sclerosis: a controlled study with MR correlates. Brain 1999: in
press.
Stevenson VL, Gawne-Cain ML, Barker GJ, Thompson AJ, Miller DH. Imaging of the
spinal cord and brain in multiple sclerosis: a comparative study between fast FLAIR and
fast spin echo. J Neurol 1997;244:119-124.
-Stevenson VL, Moseley IF, Phatouros CC, MacManus D, Thompson AJ, Miller DH.
Improved imaging of the spinal cord in multiple sclerosis using 3 dimensional fast spin
echo. Neuroradiology 1998;40:416-419.
Stevenson VL, Parker GJM, Barker GJ, Birnie K, Tofts PS, Miller DH, Thompson AJ.
Quantification of T l and T2 relaxation times in the normal appearing white matter and
lesions of multiple sclerosis. Submitted to J Neurol Sci.
Stevenson VL, Miller DH. Magnetic resonance imaging in the monitoring of disease
progression in multiple sclerosis. Multiple Sclerosis 1999; in press.
Stevenson VL, Leary SM, Losseff NA, Parker GJM, Barker GJ, Husmani Y, Miller DH,
Thompson AJ. Spinal cord atrophy and disability in multiple sclerosis: a longitudinal
study. Neurology 1998;51:234-238.
Leary SM, Stevenson VL, Miller DH, Thompson AJ. Problems in designing and
recruiting to therapeutic trials in primary progressive multiple sclerosis. J Neurol 1999:
in press.
Leary SM, Parker GJM, Stevenson VL, Barker GJ, Miller DH, Thompson AJ.
Reproducibility of magnetic resonance imaging measurements of spinal cord atrophy:
The role of quality assurance. Magn Reson Imaging 1999: in press.
-Part A Background
-Chapter 1: Multiple Sclerosis
Multiple Sclerosis (MS) is an extremely variable disease both within the patient
population and within each patient over time. It is characterised by multiple episodes of
demyelination throughout the neural axis over many years. These demyelinating lesions
or ‘plaques’ can affect any area of the central nervous system (CNS) and therefore
produce a multiplicity of symptoms. These range from the obvious problems of weakness
and spasticity, ataxia and sphincter disturbance, to less frequent but equally important
problems such as visual, cognitive, swallowing and respiratory difficulties. Some of the
commonest and to the patient most disabling symptoms, are fatigue, thermal sensitivity
and pain, areas often neglected by the physician in the face of more obvious physical
needs. MS is a disease that strikes young people in the prime of their life and is then
present for perhaps thirty or forty years having little impact on longevity and
consequently it is a major financial burden to society. In a large survey of members of the
MS society in the UK, the estimated annual cost to society was in the order of £1.2
billion, with half of this being accounted for by lost earnings and state benefits (Holmes
1995).
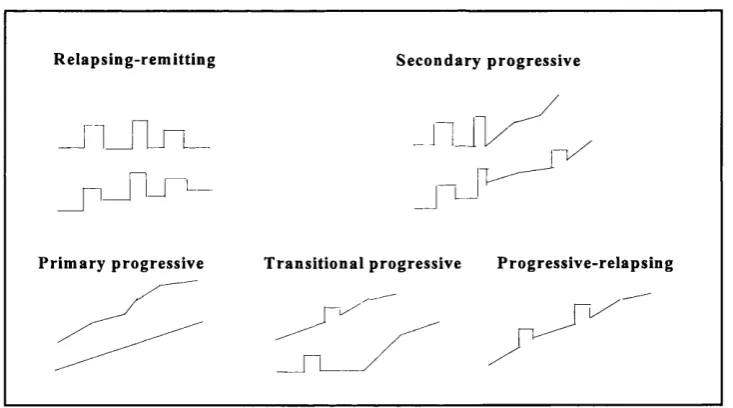
Prognosis in an individual is unpredictable, most patients (-85%), follow an initial course
of relapses (a neurological deficit lasting at least 24 hours) with complete or incomplete
recovery, so called relapsing-remitting (RR) MS. Over half of these patients then go on
to a progressive phase where disability accumulates steadily with or without
superimposed relapses, secondary progressive (SP) MS (Runmarker and Andersen 1993).
Approximately 10% of patients experience a progressive disease course from onset with
-the absence of any relapses or remissions, -these patients are classified as primary
progressive (PP) MS. This leaves a small proportion who do not fit easily into any of
these categories. Those who essentially exhibit a progressive course but who have a
history of a single relapse (this may be many years before the onset of the disease
progression or superimposed on the progression) have been denoted as transitional
progressive (TP) MS. If there is a history of more than one relapse on a background of
progression they are classified as progressive-relapsing (Lublin and Reingold 1996). The
disease courses are depicted in figure 1.1.
R elap sin g-rem ittin g S econ d ary p ro g ressiv e
L J
P rim ary p rogressive T ra n sitio n a l p rogressive P ro g ressiv e-rela p sin g
Figure 1.1: Disease course in multiple sclerosis.
In addition to this classification, two terms have been applied to disease severity, these
are Benign MS, in which the patient has minimal disability ten years after onset (Filippi
1996c, Losseff 1996b) and Malignant MS which is characterised by a rapid, progressive
course leading to death or severe disability within five years.
-1.1 Diagnosis
Multiple sclerosis is fundamentally a clinical diagnosis although investigations including
magnetic resonance imaging (MRI), evoked potentials and cerebrospinal fluid (CSF)
examination increase diagnostic accuracy and certainty. The role of such investigations
in the confirmation of dissemination in space is particularly useful. The initial clinical
criteria for diagnosis of MS were proposed by Schumacher and included three levels
(Schumacher 1965):
i) Clinically definite MS. Two or more episodes of neurological dysfunction > 1 month
apart or slow or stepwise progression > 6 months, plus objective signs of neurological
dysfunction on examination displaying dissemination in space.
ii) Probable MS. Relapsing-remitting symptoms with only one neurological sign or a
documented single episode with signs of multifocal disease.
iii) Possible MS. Relapsing-remitting symptoms without documented or objective signs.
The Poser Committee revised these criteria to include paraclinical information obtained
from the results of visual evoked potentials, CSF examination and MRI (Poser 1983).
The Poser criteria consists of two major groups, definite and probable, each with two
subgroups, clinically and laboratory (CSF) supported;
A. Clinically definite MS (CDMS). Two attacks and clinical evidence of two separate
lesions, or, two attacks with clinical evidence of one lesion and paraclinical evidence of
another, separate lesion.
B. Laboratory supported definite MS (LSDMS). Positive oligoclonal bands in the CSF
plus either; i) two attacks and clinical or paraclinical evidence of one lesion, ii) one attack
and clinical evidence of two separate lesions, or, iii) one attack with clinical evidence of
-one lesion and paraclinical evidence of another, separate lesion.
C. Clinically probable MS (CPMS). Two attacks and clinical evidence of one lesion,
one attack and clinical evidence of two separate lesions, or, one attack with clinical
evidence of one lesion and paraclinical evidence of another, separate lesion.
D. Laboratory supported probable MS (LSPMS). Two attacks and positive
oligoclonal bands in the CSF.
These criteria were established predominantly to restrict entrance to therapeutic and
research trials, but patients also appreciate the end of uncertainty with a diagnosis of
definite MS. With the recent advances in MRI, specificity may be increased by
incorporating imaging characteristics into the diagnostic criteria.
1.2 Epidemiology
The prevalence of MS varies throughout the world (Kurtzke 1966). High risk areas with
rates of 30-100 per 100,000 include northern and central Europe, Canada, United States
and parts of Australia and New Zealand. All of the high risk areas are bounded by areas
of medium risk (5-29 per 100,000) which include southern United States, northernmost
Scandinavia and Russia. Low risk areas (1-4 per 100,000) include Asia, Africa, Alaska,
Greenland and much of South America. All high and medium risk areas are among
predominantly Caucasian populations. In the USA, blacks, orientals and possibly native
American Indians have lower rates of MS than Caucasians but they still demonstrate the
geographical gradients seen in the local Caucasian populations.
These observations inevitably lead onto the question of the cause or origin of MS.
Through migration studies it is clear that the risk to an individual of developing MS is
not defined exclusively by their place of birth (although it is still dependent on race to
-some extent). Those migrating after the age of 15 years retain the risk from their place
of birth but those migrating before the age of 15 years acquire the risk of their new
environment (Kurtzke 1971). The migrant data also support the theory that MS is usually
acquired in adolescence with a lengthy incubation period before onset of symptoms.
There is also some evidence to suggest epidemics of MS have occurred, the best example
of which is in the Faroe Islands where no cases of MS were documented before the
arrival of British troops in 1940. Subsequent to this there have been four peaks in
incidence rate which can be considered to be secondary to susceptible populations
(adolescent Faroese) being exposed to an unknown exogenous antigen (Kurtzke and
Hyllested 1988, Kurtzke 1993a and 1993b). The evidence of epidemics, prevalence and
migration studies, suggests that the antigen responsible is a transmissible agent, perhaps
a retrovirus, but only a small proportion of people exposed to it will later go on to
develop MS which in itself is not transmissible.
1.3 Genetics
Although epidemiological studies support the theory of an environmental trigger, not all
exposed individuals will develop MS, susceptibility is influenced by their genetic
makeup. This genetic susceptibility is supported by evidence from family and twin
studies. In a large family study in Canada, 19% of the MS patients had an affected
relative (Sadovnick 1988 and 1993) and the lifetime risk for a first-degree relative of an
affected person was 5% compared to an individual without a family history of only 0.2%.
The risk was greatest for siblings, especially sisters, of an affected person and for
daughters. Many of the twin studies in MS have been criticized because of ascertainment
bias resulting in an excess of monozygotic and of concordant pairs. There are however
-five recent studies which approximate to a population study (Compston 1995) and show
consistency with an increased rate in monozygotic twins of approximately 25% compared
to 3% in dizygotic twins. The results of family and twin studies do not fit with any
accepted model of inheritance but point to a polygenetic influence with multiple genes
possibly exerting a threshold effect on susceptibility.
The only consistent finding in studies searching for susceptibility genes has been in the
HLA region on chromosome 6, in particular the area encoding class II molecules. As the
techniques of molecular genetics have progressed the genomic associations with MS have
been refined and strengthened with consequent changes in the nomenclature. The
susceptibility alleles have now been reclassified as the DR 15 and DQ6 subtypes of DR2
and Dqw6 respectively (Compston 1995). Other areas that look promising include the
gene encoding the immunoglobulin heavy chain on chromosome 14 (Pandy 1981) and
following recent reports of large family genomic screens, areas of interest have been
identified on chromosomes 2,3,5,7,11 and X (Ebers 1996, Sawcer 1996, The MS
Genetics Group 1996).
It is clear that although the presence of the known susceptibility alleles increases the risk
of MS, there must be many more genes that remain to be identified which make an even
greater contribution to susceptibility. With the advent of collaborative random gene
searches it is hoped our understanding of genetic factors in MS will evolve rapidly.
1.4 Immunology
The immunopathogenesis of MS is similar to other central nervous inflammatory
-conditions with the exception that inflammation is more focal occurring within plaques
and their immediate surroundings (Esiri and Gay 1997). Disease induction requires
establishment and activation of auto-reactive T cells. In MS this may be by the exposure
of a susceptible individual to an exogenous antigen, a long latency period then occurs
before the T cells are activated against a CNS antigen. Myelin possesses a number of
unique constituents which have been protected from the immune system by an intact
blood-brain barrier, once this has been breached there is a failure to recognise these
antigens as self and the inflammatory cascade is triggered involving many cell types and
mediators.
Adhesion molecule expression is greatly increased in MS allowing recruitment of
circulating leukocytes across the blood brain barrier and providing accessory molecules
in antigen presentation. Increased levels of intercellular adhesion molecule (ICAM-1),
vascular adhesion molecule (VCAM-1) and the selectins have been found in the CSF of
patients with MS (Giovannoni 1996). As more cells are recruited into the area, increasing
levels of cytokines are produced, these are both pro-inflammatory (interferon-y,
interleukin-2, tumour necrosis factor-a and tumour necrosis factor-p) and anti
inflammatory (interferons-a and -P, transforming growth factor-P and interleukin-4).
Damage to oligodendrocytes occurs as a result of exposure to many of these cytokines
and complement, as well as to non-specific mediators such as reactive oxygen and
nitrogen free radicals produced by macrophages. Regeneration and recovery also occur
(remission following an acute relapse) and may be influenced to some extent by products
of inflammatory cells within the MS plaque. This may in itself be a factor in the lack of
recovery in chronic lesions typical of PP MS, which have been found to be less
inflammatory (Revesz 1994).
-The auto-antigen responsible for this inflammatory response remains unknown although
most work concentrates on the myelin specific proteins. However the complexity of the
immune response in MS provides many avenues for therapeutic intervention capable of
interrupting the inflammatory cascade.
1.5 Pathology
MS is a disease characterised by primary demyelination, that is the loss of myelin from
areas of white matter with relative sparing of axons. It is important to use the term
‘relative’ as in most MS lesions there is some proclivity for an appreciable percentage of
axons to be lost during the early stages of an MS plaque as well as a slower degree of
axonal loss in the chronic fibrotic lesion. Extensive axonal transection has been
demonstrated within both active and chronic active lesions, this was related to the degree
of demyelination within the lesion (Trapp 1998). Examination of areas of normal
appearing white matter (NAWM) also revealed more transected axons than seen in
control brains (Trapp 1998). Work assessing immunoreactivity to amyloid precursor
protein which is present in healthy axons has shown that axonal damage is linked to
inflammation and occurs in the acute lesions of early MS (Ferguson 1997). This has
implications for therapeutic interventions in that treating early MS may reduce
subsequent axonal loss and consequent irreversible disability.
Plaques can occur anywhere within the white matter of the central nervous system,
although there is a predilection for hemispheric periventricular zones. The optic nerves,
brainstem and cervical cord are also common sites of involvement with no particular
pattern in the level or tracts affected. The lesions may vary in size from less than one
millimetre to several centimetres and often coalesce. Discrete white matter lesions at the
-grey/white matter interface may extend into the adjacent grey matter as such areas also
contain myelinated nerve fibres (Kidd 1999).
Oligodendrocytes are the cells responsible for myelination, each cell produces 30-50 cell
processes which become flattened forming an intemodal myelin sheath for as many axons
(Raine 1990). If injured the oligodendrocyte does not respond by mitosis but frequently
degenerates, a key feature in the MS plaque. Scattered throughout the bundles of
myelinated nerve fibres are astrocytes, these are the major supporting cells of grey and
white matter. If astrocytes are injured they react by rapid proliferation and by synthesising
glial fibrils. This fibrillary astrogliosis leads to a state of sclerosis or scarring, also a
characteristic of the MS plaque. The histopathology of a plaque is based largely on the
extent of scarring and inflammatory activity. Plaques can be divided into several types
according to these characteristics (Raine 1997).
Acute MS lesion. The margins of an acute lesion are indistinct, the centre is highly
oedematous with an increase in extracellular space and frequent hypertrophic astrocytes.
The entire area is infiltrated with perivascular and haematogenous cells, large numbers
of macrophages laden with lipid or myelin debris occur throughout the lesion. Around
venules there are deposits of fibrin and complement associated with haemorrhage and
disruption of vessel basement membrane material. The demyelinated centre of the lesion
is depleted of axons and occasionally signs of remyelination can be seen.
Chronic MS lesion. These are clearly seen by myelin staining to be areas devoid of
myelin with clear edges separating them from adjacent myelinated parenchyma. Staining
for glial fibres show the same area to be involved by intense fibrillary astrogliosis and
scarring, at the edges of the lesion there are often a few reactive astrocytes. Axon stains
show a moderate depletion at the edges with more severe depletion in the centre of the
-lesions, long term demyelinated axons show a decrease in axonal diameter.
Oligodendrocyte depletion is readily apparent through the centre of the lesion. Even in
the oldest lesions some evidence of inflammatory activity (particularly at the lesion
edges) is often noted, usually by the presence of small numbers of lymphocytes,
macrophages, plasma cells and occasional mast cells.
Chronic active MS lesion. This lesion is half way between the characteristics of the
chronic and acute lesions described above; a prominent inflammatory reaction on a
background of a previously demyelinated, fibrous astrogliotic plaque. There is also
evidence of astroglial hypertrophy, oligodendrocyte hypoplasia and ongoing
demyelination. Perivascular cuffing is seen around venules and the lesion edge is
relatively sharp with large numbers of lipid laden macrophages. The centre of the plaque
can be identical to that of a chronic plaque or may only be distinguishable from that of
acute lesions by prominent fibrillary gliosis. Evidence of remyelination is apparent
around the edge of the lesion.
Shadow MS lesion. This lesion is seen most frequently as a diffusely staining pale
myelinated area often in the spinal cord. The axons are thinly myelinated and hence it is
thought to be an area of previous damage which has undergone repair and remyelination.
This classification obviously represents a spectrum of histopathological appearances, as
lesions develop they will often move between the groups, chronic silent lesions may
reactivate even after many years. The nature of the trigger to this intense inflammatory
reaction is as yet unknown, however the ability to induce in animals a similar myelin
pathology by sensitising them against a number of myelin antigens supports the theory
of an auto-immune process.
-1.6 Pathophysiology of Symptoms
The acute lesion is characterised by inflammation and blood brain barrier breakdown
which is seen by MRI as an area of gadolinium enhancement, this usually lasts between
four and six weeks. These inflammatory changes are accompanied by demyelination,
evidence for which comes from MR spectroscopy studies demonstrating lipid peaks
(Davie 1994). There is also evidence of acute axonal loss at this time (Ozawa 1994,
Ferguson 1997). During this period, function, depending on the site of the lesion, may be
affected. This is readily demonstrable in studies of the optic nerve (Youl 1991). In a study
of 18 patients with optic neuritis, gadolinium enhancement was associated with reduced
visual acuity and a reduced amplitude of the P I00 component of the visual evoked
potential, indicating conduction block. When the patients were studied four weeks later,
nine of 11 had ceased to show enhancement and both acuity and the amplitude of the
P I00 had improved. However the latency of the visual evoked potential was prolonged
throughout. This indicates that although demyelination persisted some degree of
functional recovery occurred, this is probably due to both the resolution of inflammatory
changes which contribute to conduction block and to the proliferation of sodium channels
restoring conduction. The clinical change seen during this process is that of an acute
relapse with complete or incomplete recovery. Any resulting disability is fixed and tends
to remain stable. However this process does not account for the major cause of disability
in MS, that of insidious disease progression. It is thought that this may be a product of
progressive axonal loss both in chronic MS lesions as they age (Barnes 1991) and
diffusely within the NAWM. Evidence for this occurring comes from MR spectroscopy
studies in PP and SP MS (Davie 1997, Leary 1998a, Matthews 1996, Fu 1998), the end
result is apparent in the progressive atrophy of both the brain (Losseff 1996a) and of the
-spinal cord (Losseff 1996b, Stevenson 1998a).
1.7 Management of Multiple Sclerosis
Management of the MS patient begins at presentation with the first symptom,
investigation and subsequent diagnosis. This is a particularly crucial time and the key
areas of management are education and support (Werring and Thompson 1998a). In
established MS, patient management can be split into four main areas;
1) Anticipation and prevention of problems
2) Symptomatic treatment
3) Therapies aimed at reducing disease activity
4) Rehabilitation and service delivery
Each of these areas will be considered briefly, in turn.
1.7.1 Anticipation and Prevention o f Problems
Maintaining good general health is of prime importance in MS, it has been suggested by
Petajan and colleagues that regular aerobic exercise, when possible, increases physical
and psychological well-being (Petajan 1996). The role of diet in MS remains an area of
debate. Several studies have implicated the consumption of animal fat, others propose
dairy products increase the risk of MS (Lauer 1997). A beneficial effect of increasing
intake of o)-3 and 0)-6 fatty acids has also been suggested to decrease the frequency and
severity of relapses, although no effect on long term outcome has been found (Dworkin
1984, Bates 1989). However many of the epidemiological studies have been inconsistent
and no definite relationship between MS and dietary intake has been elucidated. General
dietary advice to patients is to decrease animal fat and increase both vegetable fat and
-seafood intake (Lauer 1997).
As relapses may be precipitated by intercurrent infections, these should be treated
promptly and more importantly prevented if possible, particularly in relation to the
urinary and respiratory tracts. Large residual urinary volumes or poor intermittent self
catheterisation techniques are often responsible for precipitating urinary tract infections.
With regular assessments and training these can be avoided. In the respiratory tract early
signs of aspiration should be noted and a speech therapist involved early for advice on
practical management.
The question of whether patients with MS should receive vaccinations has been long
debated, but recent work (Miller A 1997) suggests that the influenza vaccination does not
increase the risk of disease exacerbation and thus should not be contra-indicated in MS.
The risk of other vaccines have not been studied in MS however the risk to benefit ratio
of these immunisations is probably low when used in ‘at risk’ patients and should always
be offered (Panitch 1997).
Spasticity and weakness can also lead to problems with abnormal posture and gait. This
can put excessive strain on the back and result in mechanical problems with considerable
pain. Untreated spasticity can also lead to contractures with consequent increasing
disability and permanent loss of function.
In the past patients were often advised not to become pregnant as this was associated with
disease exacerbation, however the relationship between pregnancy and MS has become
clearer more recently. Prospective studies have suggested that the relapse rate is
decreased during pregnancy but raised during the three month puerperium, giving little
difference in the overall relapse rate over the pregnancy year, or in the long term
disability of the patient (Confavreux 1998). It is generally felt that patients wishing to
-start a family should not be discouraged from doing so.
1.7.2 Symptomatic Treatment
Realistically, the recent advent of new immunosuppressant treatments will have little
impact on existing problems and disability; consequently much of the management of a
patient with MS relates to control of a vast array of symptoms (Thompson 1998a, Clanet
1997). Much can be done for the patient in all areas. A combination of education,
physiotherapy and drug therapy is usually required but occasionally there is a place for
more invasive treatments such as intrathecal baclofen administration for severe spasticity,
thalamic surgery for cerebellar tremor or intravesical capsaicin for severe detrusor hyper-
reflexia.
Acute relapses which are significantly affecting a patients function can be treated with
a short (three day) course of intravenous steroids, this has been shown to accelerate
recovery although has no effect on long term outcome (Thompson 1989, Miller 1992).
1.7.3 Therapies Aimed at Reduction o f Disease Activity
In recent years considerable progress has been made in the understanding of the complex
immunopathological mechanisms underlying MS, many of these discoveries have led to
the investigation of new therapeutic strategies (see table 1.1). Beta interferons (la and lb)
are now licensed worldwide and Glatiramer acetate (copaxone) is in use in the United
States and Israel. Many others drugs are undergoing pivotal trials (Stevenson 1998b).
Interferons. There are three forms of beta interferon now available, interferon beta-lb
(IFNB-lb, Betaseron in North America, Betaferon in Europe) given as a subcutaneous
-injections every other day, at a dose of 300 micrigrams or 9.6 million lU, interferon beta-
la (IFNB-la, Avonex) as a once weekly intramuscular injection at a dose of 6 million lU
(30 micrograms) and interferon beta-la (IFNB-la, Rebif) given as a subcutaneous
injection three times a week at a dose of 6 million lU (22 micrograms). Common side
effects include injection site reactions and flu-like symptoms including fever, chills and
muscle aches. Considering the results of the pivotal trials in RR MS, all three interferons
demonstrated a reduction of the relapse rate in the order of one third (Paty 1993, IFNB
1995, Jacobs 1995, Jacobs 1996, PRISMS 1998). In the Betaferon study there was no
significant difference between the treated and placebo groups when considering
progression of disability, both the Rebif and Avonex studies of IFNB-la suggested lower
rates of progression in the treated groups compared to the placebo groups. The Rebif
study reported a reduction in total lesion load seen on T2 weighted MRI, the Betaferon
a stabilisation of T2 lesion load and the Avonex study no effect. All three studies
described a striking reduction of new gadolinium enhancing lesions as compared to the
placebo controls. More recently a European multicentre study of IFNB-lb for SP MS has
been completed, this demonstrated again a reduction in relapse rate by one third but more
importantly a significant difference between the treated and placebo groups in time to
confirmed disability progression and time to reach defined disability end-points
(becoming wheel chair bound) (European study group on Interferon p-lb in secondary
progressive MS 1998). These differences were in the order of 20-32% and were
independent of baseline disability or superimposed relapses (Miller 1998a and 1998b).
This study demonstrated for the first time that IFNB has an effect not only on the relapses
of MS but also slows the insidious disease progression probably responsible for the
majority of disability in MS.
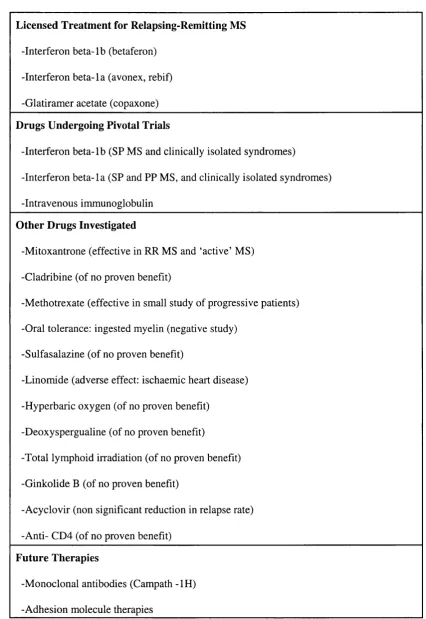
-Table 1.1: Therapeutic agents in multiple sclerosis.
Licensed Treatment for Relapsing-Remitting MS
-Interferon beta-lb (betaferon)
-Interferon beta-la (avonex, rebif)
-Glatiramer acetate (copaxone)
Drugs Undergoing Pivotal Trials
-Interferon beta-lb (SP MS and clinically isolated syndromes)
-Interferon beta-la (SP and PP MS, and clinically isolated syndromes)
-Intravenous immunoglobulin
Other Drugs Investigated
-Mitoxantrone (effective in RR MS and ‘active’ MS)
-Cladribine (of no proven benefit)
-Methotrexate (effective in small study of progressive patients)
-Oral tolerance: ingested myelin (negative study)
-Sulfasalazine (of no proven benefit)
-Linomide (adverse effect: ischaemic heart disease)
-Hyperbaric oxygen (of no proven benefit)
-Deoxyspergualine (of no proven benefit)
-Total lymphoid irradiation (of no proven benefit)
-Ginkolide B (of no proven benefit)
-Acyclovir (non significant reduction in relapse rate)
-Anti- CD4 (of no proven benefit)
Future Therapies
-Monoclonal antibodies (Campath -IH)
-Adhesion molecule therapies
-Further studies with the interferons are ongoing, they include, IFNB-la (Rebif) for SP
MS and IFNB-la (Avonex) for RR, SP and PP MS (Leary 1997). Both Rebif and Avonex
are also being studied in patients with clinically isolated syndromes (monosymptomatic)
to detect if the time to conversion to MS can be delayed.
Glatiramer Acetate (Copaxone). This is a mixture of several polypeptides (L-alanine,
L-glutamic acid, L-lysine and L-tyrosine) in a specific ratio. Its therapeutic effect is
thought to involve inhibition of the immune response to myelin basic protein. In 1991 a
pivotal trial showed a reduction in relapse rate of 29% in the treated group (Johnson
1995, Wolinsky 1995). There was no difference in progression to disability and a very
limited MRI study did not show any treatment effect on total T2 lesion load or in the
number of new enhancing lesions (Cohen 1995). It is given as a daily subcutaneous
injection. Side effects are rare but include injection site reactions and a rare transient
systemic reaction consisting of flushing, chest tightness, shortness of breath and anxiety,
lasting between 30 seconds and 30 minutes.
Intravenous Immunoglobulin. The mechanism of action of intravenous
immunoglobulin (IVIG) in MS is unknown but is thought to be a combination of T cell
receptor blockade, modulation of cytokine activity and induction of antigen specific
supressor cells. Animal studies have suggested that it might promote remyelination. A
recent double-blind, placebo controlled study of monthly IVIG infusions in 150 patients
for two years showed that IVIG treatment had a beneficial effect on the course of clinical
disability (Fazekas 1997). It is well tolerated with very few side effects.
1.7,4 Rehabilitation and Service Delivery
A multi-disciplinary approach is required to deal with the wide range of disabling and
-interacting symptoms seen in MS. Multi-disciplinary team assessments identify areas of
potential functional improvement and patient-centred, goal-orientated rehabilitation
programmes are initiated (Thompson 1996).
Short periods of intensive inpatient rehabilitation have been shown to reduce levels of
disability and handicap (Freeman 1997), the benefit persisting for at least six months
(Freeman 1999).
Ideally the patient with MS and their carers should be managed in a comprehensive,
flexible, community based service with close links to a neuroscience centre. This is
usually achieved by ensuring a link worker or community care co-ordinator is established
to deal with both the purchaser and provider. Their role should ideally also include the
continuation of education and training for both the patients and health professionals
(Thompson 1997a).
1.8 Primary Progressive Multiple Sclerosis
Approximately 10% of patients with MS exhibit a progressive course from onset with no
history of relapse or remission and are classified as PP MS. The classification of patients
with progressive forms of MS is extremely difficult as noted in a recent survey of
members of the International MS Clinical Research Community (Lublin and Reingold
1996). This classification included a group of patients classified as progressive-relapsing
who are progressive from onset but who also have superimposed relapses. Patients with
TP MS (Filippi 1995a, Thompson 1997b, Gayou 1997), who describe a progressive
course with the exception of a single relapse or remission at any time before or after the
onset of disease progression were not distinguished from these.
-Difficulties in the diagnosis of PP MS both in terms of distinguishing it from other
progressive neurological disorders and in excluding patients with previous relapse
activity have recently been highlighted (Thompson 1997b, McDonnell and Hawkins
1997). The differential diagnosis must be considered, this is particularly important if the
patient presents with a progressive paraparesis where cord compression and foramen
magnum anomalies must be carefully excluded by detailed MR imaging. Other
inflammatory conditions must also be screened for including human T-cell lymphocyte
virus type 1, syphilis, borrelia, X-linked adrenomyeloneuropathy, systemic lupus
erythematosis, Sjogrens disease and DNA analysis performed for Lebers optic neuropathy
if the patient has presented with progressive visual failure.
Making the diagnosis of PP MS may be difficult. Progressive symptoms need to be
present for a minimum of six months before the diagnosis can be considered though a
longer time course of two years has been suggested to be more clinically appropriate
(Thompson 1997b). Many patients present with a progressive but monosymptomatic
course, often a spastic paraparesis, however the Poser criteria require evidence of disease
dissemination both in time and space. Evidence from paraclinical tests (oligoclonal bands
on CSF examination, delay in visual evoked potentials and abnormalities on MRI), are
often helpful but fulfilling the criteria, particularly dissemination in time, can be difficult.
This may involve repeating tests, for example, a visual evoked potential which is normal
at presentation may later become delayed.
The frequency of PP MS is estimated at approximately 10%, giving a prevalence figure
in the order of 35,000 in Europe or 8,000 in the UK (Thompson 1997b), however the
precise proportion varies between studies from 7.7% (Weinshenker 1989) to 37%
(Minderhoud 1988). This variation probably reflects the method of data collection. In
-Weinshenkers study the proportion of patients with PP MS calculated from the
retrospective data was 18%, whereas in the group of patients seen from presentation this
fell to 7.7%. Initial relapses, particularly if they occurred many years before the onset of
the progressive syndrome, are easily forgotten by the patient (Mathews 1998).
Few studies have looked at this patient group and because of their relative rarity patient
numbers have been small. However differences between PP MS and RR and SP subtypes
have been documented. The age of onset appears to be later, mean age at presentation
37.3 years (Confavreux 1980) and 43.6 years (Thompson 1986) in two such studies. The
male to female ratio seems to be equal or even in favour of a slight male excess
(Runmarker and Andersen 1993, Van Lambalgen 1986). This lack of female
preponderance, which is usually seen in auto-immune conditions, may reflect the less
inflammatory/ immune nature of the disease course compared to other subgroups of MS.
Symptoms at presentation also differ in that unlike RR MS patients who usually present
with a visual or sensory disturbance, patients with PP MS most commonly present with
a progressive paraparesis. However a small proportion will present with progressive
cerebellar, brainstem, visual or hemiplegic syndromes. Very rarely progressive cognitive
decline can occur. Cognitive dysfunction has not been thought to be a prominent feature
in this patient group, particularly when compared to patients with SP MS (Comi 1995).
Differences in the genetic and immunological profiles of PP MS have been noted but the
study numbers are small and results inconsistent (Thompson 1997b). As discussed
previously the only consistent finding in studies searching for susceptibility genes has
been in the HLA region on chromosome 6, more specifically with the susceptibility
alleles DR15 and DQ6 subtypes of DR2 and Dqw6 respectively (Compston 1995). A
similar incidence of DR2 has been shown in PP MS compared to RR and SP MS
-(McDonnell 1998a), however it has been suggested that PP MS may be associated with
different DQBl restriction fragments (Olerup 1989).
Little is known about the immunological differences between clinical subtypes of MS,
the prevalence of positive oligoclonal bands in the CSF of patients with chronic
progressive MS was shown to be equal to that in RR patients in two studies (Thompson
1985, Tourtelotte 1988) but less in a more recent Finnish study (Pirttila and Nurmikko
1995). Differences in the frequency of auto-antibodies have also been suggested. In one
study two subgroups of MS were described, one associated with antibodies against
myelin basic protein (MBP) and the other with anti-proteo-lipid protein (anti-PLP)
antibodies, three of the five patients with anti-PLP antibodies had PP MS (Warren 1994).
Raised anti-ganglioside antibodies particularly in MS patients with PP disease have been
noted (Acarin 1996), pro-inflammatory cytokines and levels of interleukin-2 receptors
have also shown to be higher in progressive patients than those with RR MS (Chalon
1993). There may also be differences in the concentration of adhesion molecules
(Matsuda 1995) and, in particular, levels of soluble E-selectin, an endothelial adhesion
molecule which is increased in patients with PP MS (Giovannoni 1996, McDonnell
1998b).
There is very little published concerning the pathological findings in PP MS, one study
compared post mortem material of four patients with PP MS to five with SP MS,
inflammatory changes were evident in all cases but were significantly more marked in
the SP MS group (Revesz 1994). In another study of three patients with PP MS it was
suggested that demyelination may occur as a secondary phenomenon to oligodendroglial
damage (Lucchinetti 1996).
Prognosis in terms of progression to disability is poor in PP MS. The median time to
-reach disability status scale (DSS) 6 (Kuitzke 1961) was only six years in a cohort of 36
patients (Runmarker and Andersen 1993), similar findings have been demonstrated in
other studies (Weinshenker 1989). Prediction of prognosis is also very poor in this group,
Losseff looked at 10 patients with PP MS and 12 with SP MS who had all undergone six
monthly MRI scans five years previously. In the SP MS group three factors were found
to be predictive of outcome; the number of enhancing lesions, relapse frequency and the
development of disability over the six month period. In the PP MS group no MRI
measures were predictive with only the development of disability showing any
relationship (Losseff 1996c).
At present there are no licensed treatments to alter the clinical course of PP MS and
management remains symptomatic and supportive. Due to the relative rarity and the less
inflammatory nature of this disease which in itself causes difficulties in monitoring the
effect of treatments, there has been very little interest in therapeutic trials for this group.
To date there are only three small treatment trials underway in PP MS two with beta-
interferon la (Leary 1997, Montalban 1998) and the other with riluzole (personal
communication CH Polman).
-Chapter 2: Magnetic Resonance Imaging
This chapter concentrates on the basic principles and technological aspects of MRI
(Westbrook and Kant 1993). Many of the pulse sequences and methods of quantification
used in studies discussed later are described in detail.
2.1 Basic Principles of MRI
MRI enables high resolution pictures to be obtained with excellent discrimination
between soft tissue structures. It does this by manipulating the different magnetic
properties that tissues acquire when placed within an external magnetic field to produce
an electrical signal, which can then be collected and transformed into an image. To
understand how this image is formed it is important to consider the properties of the
hydrogen nuclei present in the water and lipids of soft tissues.
In conventional MR imaging the hydrogen nucleus with its sole proton is the source of
the signal from which an image may be formed. Hydrogen is present in abundance in the
form of water and macromolecules within the human body. The hydrogen nuclei, or
protons, possess a property named ‘spin’ which can be envisaged as each proton spinning
around its axis, much the same as the Earth spins around its axis. As a consequence of
this spin and their positive charge, they have their own magnetic moment which is along
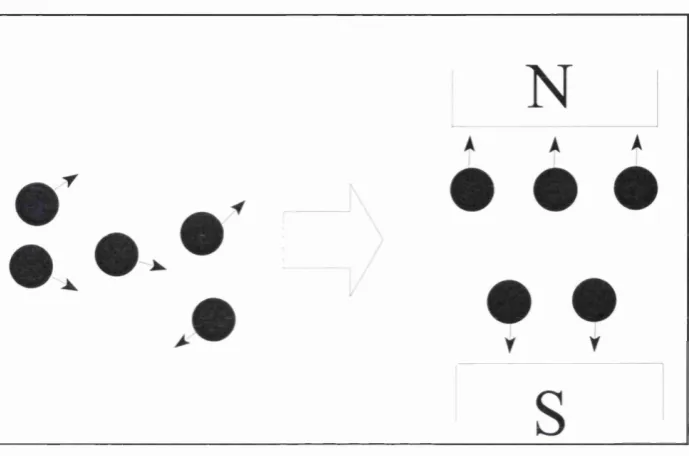
the direction of the axis. However the protons are all spinning in a random direction and
therefore there is no net magnetic moment in the structure. If the structure is then placed
in an external magnetic field, the proton spins align within this in either a parallel or anti
parallel fashion. There are always slightly more in a parallel direction than anti-parallel
-as the former is the lowest energy state attainable. This results in a net magnetic moment
in the direction of the magnetic field, (conventionally defined as the z axis), known as
longitudinal magnetisation (see figure 2.1).
Figure 2.1: Alignment of protons within a magnetic field.
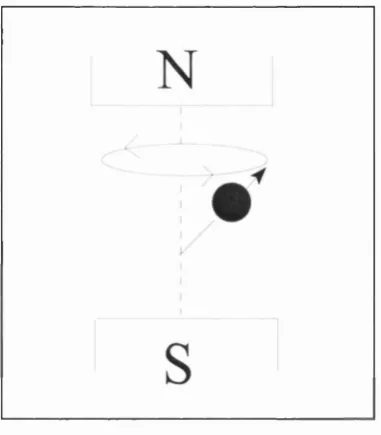
The protons, whilst aligned, continue spinning around their axis in a motion known as
‘precession’, this has been likened to a spinning top (see figure 2.2).
The frequency of this precession (Wg) is dependent on the strength of the magnetic field
(Bg) and the gyro-magnetic ratio (y) which is different for different materials (eg. the
value for protons is 42.5 MHz/T), cOg can be calculated using the Larmor equation:
a)()= Y B
-Figure 2.2: Precession of protons.
As the protons do not precess in phase, under the conditions described so far, there is no
net magnetic moment along the a or y axes (perpendicular to z).
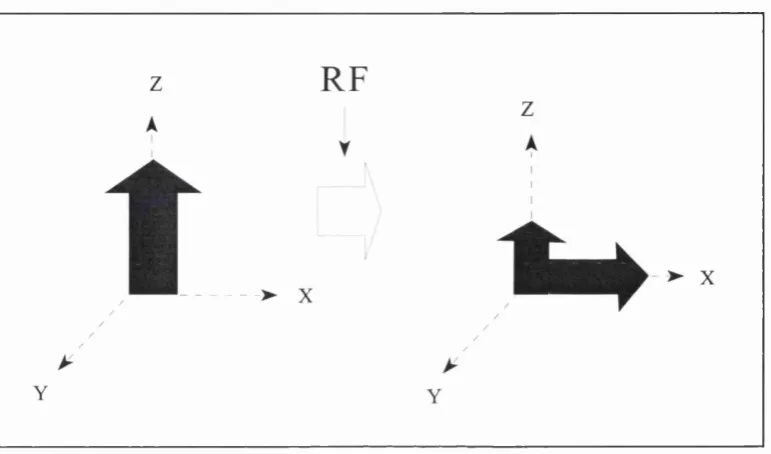
To obtain a useful signal from the longitudinal magnetisation it is necessary to apply a
radio-frequency (RF) pulse, this is transmitted from a coil which surrounds the part of the
body being imaged. The RF pulse interacts with the preeessing protons by transferring
energy to them. To do this the RF pulse frequency needs to be the same as the proton
preeession frequency (calculated by the Larmor equation) allowing resonance to occur.
This exchange in energy has two main effects; firstly some of the protons move to a
higher energy level, ie. change from parallel to anti-parallel, thus resulting in a change
in the net longitudinal magnetisation, and secondly the protons begin to precess in phase.
This results in a magnetic moment moving around the z axis in the % and y direction
which is called transverse magnetisation (see figure 2.3). This rotating magnetic moment
may be detected by its ability to induce a current in the RF coil, forming the MRI signal.
-An RF pulse which results in no net longitudinal (equal protons in a parallel or anti
parallel direction) and maximum transverse magnetisation is called a 90° pulse.
Figure 2.3: Transverse magnetisation following an RF pulse.
The RF pulse is short (~ 1ms) and as soon as it is switched off the protons try and return
to their low energy state, they do this by transferring their excess energy to the
surroundings (the lattice). As this occurs longitudinal magnetisation increases (more
protons align in a parallel rather than anti-parallel direction), this process is called
longitudinal or spin-lattice relaxation. At the same time due to inhomogeneities in the
external magnetic field and the influence of neighbouring protons with their magnetic
fields, the protons precess at different frequencies and consequently begin to lose phase;
thus the transverse magnetisation decreases, this process is called transversal or spin-spin
relaxation.
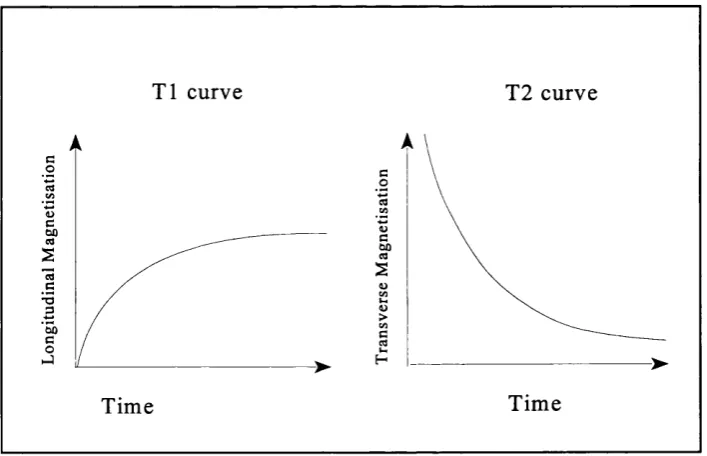
The time taken for the longitudinal magnetisation to recover back to its original value is
-described by a time constant; the longitudinal relaxation time also called T l. Likewise
there is a time constant to describe how long it takes the transverse magnetisation to
disappear; the transversal relaxation time or T2. Both relaxation processes are
exponential thus T l is defined as when 63% of the original longitudinal magnetisation
is reached and T2 as the time when transversal magnetisation decreases to 37% of the
original value. The T l of a substance is always longer than the T2. In biological tissues
T l ranges from about 300ms in fat to greater than 2000ms in CSF, the range for T2 is
aproximately 30 to 150ms (see figure 2.4).
T l curve T2 curve
Time Time
Figure 2.4: T l and T2 relaxation time curves.
The properties of the tissue effect the T l and T2 values. Excess energy is more readily
transferred from protons to bound water or fat molecules than free water, hence the T l
of low viscosity substances, for example CSF, is very long. In the same way if the
molecules of the lattice are of different sizes and moving at different speeds (bound water
-or fat), protons lose phase m-ore quickly than if they are of a similar size and fast moving
(free water). The T2 is therefore long for watery substances and shorter for fat and other
complex structures. Protons also lose phase due to inhomogeneities within the magnetic
field, this is termed the T2* effect. However T2* effects are always less than T2 and are
reversible.
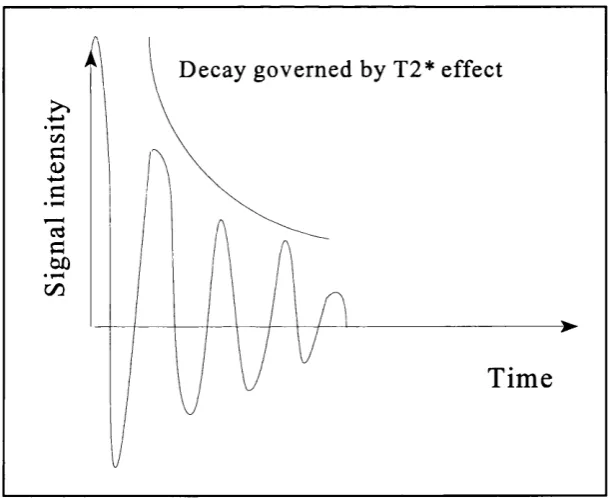
Both the longitudinal and transverse magnetisation make up the net magnetisation which
can be depicted as a sum vector which in itself is preeessing around its axis. However
only the transverse magnetisation is available to produce the signal. This type of signal
is called an FID signal (Free Induction Decay), although the amplitude decreases as
relaxation occurs the frequency always remains constant (see figure 2.5).
D ecay governed by T2* effect
Tim e
Figure 2.5; Free induction decay signal.
To identify variations in tissues any difference in relaxation times may be exploited. If
-the signal from a tissue is repeatedly sampled, -the time delay between sampling (TR; time
to repeat) will restrict the degree to which longitudinal relaxation occurs, depending on
the Tl of the tissue. Likewise, the time delay between RF excitation and acquisition of
signal (TE; time to echo) will alter the signal amplitude according to T2. A ‘T l
weighted’ image may be obtained by keeping TR short relative to typical T l values. A
‘T2 weighted’ image may be obtained by keeping TE long relative to typical T2 values.
If the TR is long but the TE is short the differences in T l or T2 of the tissues cannot
manifest themselves and the signal intensity depends on the number of protons present
ie. the proton or spin density (PD weighted image).
The most basic method for obtaining an MR signal is to use a spin-echo sequence. This
consists of two pulses; a 90° pulse followed by a 180° pulse. The 180° pulse, given at
time TE/2, reverses the dephasing effects of T2*, leading to the formation of a signal
echo at TE (see figure 2.6).
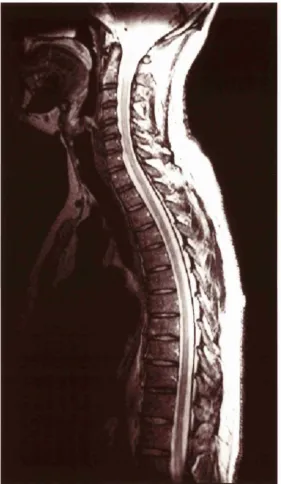
The T l weighted images from a spin echo sequence have a high signal to noise ratio
(SNR) and consequently demonstrate the anatomy of the brain and spinal cord extremely
well. They may show some areas of pathology in multiple sclerosis as areas of hypo-
intensity (so called black holes), although changes tend to be less dramatic than on T2
weighted images where diseased tissues which are often oedematous give high signal
changes (see figure 2.7). The TR and TE of the T l weighted sequence are both short and
acquisition time for 44 contiguous 3mm slices through the brain is in the order of 6
minutes. The T2 weighted images from a conventional spin echo sequence (CSE) are also
of high SNR but due to the long TR and TE the acquisition time can be over 15 minutes,
making it impractical in many clinical situations.
-9 0'
1 8 0'
I
9 0'
R F P u l s e s
T R
TE/2 TE/2
E c h o
TE
I
K S P A C E -► I M A G E
Figure 2.6: The spin-echo sequence.
In the spinal cord the images are often degraded by motion and flow effects. These are
produced due to mismapping of signals from moving nuclei, the result are artefacts
known as flow motion artefacts or flow-void phenomena.
To get round these problems faster sequences have been developed. Before these faster
sequences are discussed it is important to consider how an image is created.
2.2 Creating an Image
Before an MR image can be constructed the spatial distribution of the signal needs to be
known. This is done by firstly selecting a specific slice from which to collect information.
-Ki«iire 2.7: Tl (top) and 12 (bottom) weighted images in multiple sclerosis.