OncoTargets and Therapy 2017:10 5089–5097
OncoTargets and Therapy
Dove
press
submit your manuscript | www.dovepress.com 5089
O r i g i n a l r e s e a r c h
open access to scientific and medical research
Open access Full Text article
association of PTen expression with biochemical
recurrence in prostate cancer: results based
on previous reports
haijie Xie Bin Xie chunyu liu Jun Wang Yong Xu
Department of Urology, Tianjin institute of Urology, The second hospital of Tianjin Medical University, Tianjin, People’s republic of china
Purpose: Among men, prostate cancer (PCa) is one of the most commonly diagnosed cancers and the leading cause of cancer death worldwide. Phosphatase and tension homolog (PTEN) acts as a negative regulator of the phosphatidylinositol 3-kinase (PIK3)/Akt pathway and suppresses tumor progression. Meanwhile, PTEN is frequently deleted in PCa. Identifying the specific molecular markers of biochemical recurrence (BCR) in PCa patients is critical in clinical practice. Our systematic review summarizes the evidence about the PTEN expression and BCR rate in PCa patients.
Methods: To clarify the impact of PTEN expression on the PCa BCR rate, a systematic review and meta-analysis was performed by searching the PubMed, Embase, and Web of Science databases, to identify the relevant literature. The analysis of pooled data was performed with Stata 12. The combined odds ratios (ORs) and their corresponding 95% confidence intervals (CIs) were evaluated by the fixed-effects or random-effects models. The combined sensitivity and publication bias were also estimated.
Results: In total, nine articles containing ten independent cohort studies, including 2,154 cases with positive expression of PTEN and 1,006 PTEN deletion cases, were deemed eligible for the meta-analysis. Overall, the positive expression of PTEN was associated with a significantly lower BCR rate (OR =0.521, 95% CI: 0.431–0.630). Subgroup analysis stratified by race revealed that in multiple races (OR =0.215, 95% CI: 0.072–0.648) and Caucasian (OR =0.469, 95% CI: 0.373–0.591) races, positive expression of PTEN showed a significant association with lower BCR rate. Subgroup analysis also showed the significant result in different sample sizes.
Conclusion: PTEN deletion has a relationship with a higher BCR rate in PCa compared with positive expression of PTEN.
Keywords: PTEN, BCR, prostate cancer, meta-analysis
Introduction
Prostate cancer (PCa), the most commonly diagnosed cancer in men, is one of the most leading causes of male cancer death all over the world.1,2 The mainly established prognostic factors for PCa are the Gleason score (GS), pathological T (pT) stage, and serum level of prostatic-specific antigen (PSA). The increasing serum PSA level relates to biochemical recurrence (BCR).3 BCR is an early indication of clinical progression, distant metastases, and mortality, indicating that the patients will be treated with secondary treatment.3,4 Previous studies showed that increased phosphorylation of the serine threonine kinase Akt is an important predictor of the risk of BCR in PCa.5,6
Phosphatase and tension homolog (PTEN), located on chromosome 10, acts as a tumor suppressor by inhibiting the phosphatidylinositol 3-kinase (PIK3)/Akt pathway, correspondence: Yong Xu
Department of Urology, Tianjin institute of Urology, The second hospital of Tianjin Medical University, 23 Pingjiang road, hexi District, Tianjin 300211, People’s republic of china Tel/fax +86 22 8832 8091
email xuyong88328091@foxmail.com
Journal name: OncoTargets and Therapy Article Designation: Original Research Year: 2017
Volume: 10
Running head verso: Xie et al
Running head recto: PTEN with biochemical recurrence in prostate cancer DOI: http://dx.doi.org/10.2147/OTT.S132653
OncoTargets and Therapy downloaded from https://www.dovepress.com/ by 118.70.13.36 on 25-Aug-2020
For personal use only.
Number of times this article has been viewed
This article was published in the following Dove Press journal: OncoTargets and Therapy
Dovepress
Xie et al
which is a critical tumor-promoting pathway.7–9 PTEN also can initiate numerous signaling events, including cell prolif-eration, invasion, and metastasis.9–11 PTEN loss is proposed to be a critically important and frequently occurring molecular event in PCa progression.12–15 Some studies indicated that patients with PTEN deletion were associated with higher pathological stage or GS.5,16 PTEN loss also correlates with earlier BCR in some studies.4,5,17
To confirm the association of PTEN expression with BCR in patients with PCa, we combined the results from the latest published literature on this topic to produce a comprehensive meta-analysis.
Materials and methods
literature search and inclusion criteria
The electronic databases PubMed, Embase, and Web of Science were searched for studies to add to our meta-analysis. The key words included “PTEN”, “phosphatase and tensin homolog on chromosome 10”, “prostate cancer”, “prostate tumor”, “prostate carcinoma”, “PCa”, “prostate adenocarcinomas”, “prostate specific antigen”, “PSA”, and “biochemical recurrence”.Literature selected for inclusion in the meta-analysis met the following criteria: 1) published in English; 2) measured PTEN expression in PCa tissue with immunohistochemistry (IHC) or other methods; 3) the patients in every study had positive and lost expression of PTEN; 4) provided information about BCR, GS, and pT stage; and 5) were original epidemiological studies on the correlation between PTEN expression and BCR rate of PCa.
Data extraction
Two reviewers independently extracted studies for inclusion based on the Newcastle Ottawa Scale (NOS), which included three aspects of selection, comparability, and exposure. The scores ranged from 0 to 9. When NOS score was .7, it was considered as high quality.
The following data were collected: first author, year of publication, patient’ country of origin and race, total number of patients, median age of patients at diagnosis, test method, median GS, pT stage, number of patients with BCR, and number of patients with positive and lost expression of PTEN.
There were different definitions on positive and lost expression of PTEN in every study. Since it was hard to distinguish positive and lost expression of PTEN on a unified standard, we respectively combined all patients with lost expression of PTEN and all patients with positive expression of PTEN in our meta-analysis according to their original group in each individual study.
statistical analysis
The association strength between PTEN expression and BCR rate was measured by odds ratios (ORs), and their 95% confidence intervals (CIs) were also combined to give the effective value. The estimates of pooled ORs were achieved by calculating a weighted average of OR from each study. A 95% CI was used for statistical significance test. If the studies were shown to be homogeneous with P.0.1 for the Q-statistics, the OR was calculated by a fixed-effects model. Otherwise, a random-effects model was selected.
Subgroup analyses were also conducted to explore the effects of confounding factors: ethnicities and sample size. Sensitivity analyses, by which a single study in the meta-analysis was deleted each time, were performed to identify individual study’s effect on pooled results and test the reliability of results. Statistical analysis of the association between PTEN expression and PCa BCR rate was performed with a P-value of ,0.05, which was considered as statisti-cally significant.
Results
characteristics of eligible studies
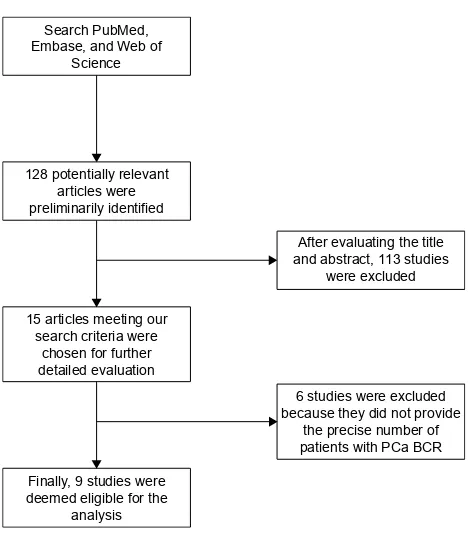
In total, ten retrospective cohort studies from nine articles published between 2007 and 2016 were eligible according to inclusion and exclusion criteria for this systematic review with meta-analysis.4,5,13,17–22 The detailed screening process and the result of each step are shown in Figure 1.
6HDUFK3XE0HG (PEDVHDQG:HERI
6FLHQFH
$IWHUHYDOXDWLQJWKHWLWOH DQGDEVWUDFWVWXGLHV
ZHUHH[FOXGHG
VWXGLHVZHUHH[FOXGHG EHFDXVHWKH\GLGQRWSURYLGH
WKHSUHFLVHQXPEHURI SDWLHQWVZLWK3&D%&5 SRWHQWLDOO\UHOHYDQW
DUWLFOHVZHUH SUHOLPLQDULO\LGHQWLILHG
DUWLFOHVPHHWLQJRXU VHDUFKFULWHULDZHUH
FKRVHQIRUIXUWKHU GHWDLOHGHYDOXDWLRQ
)LQDOO\VWXGLHVZHUH GHHPHGHOLJLEOHIRUWKH
DQDO\VLV
Figure 1 Flowchart of study selection.
Abbreviations: Bcr, biochemical recurrence; Pca, prostate cancer.
OncoTargets and Therapy downloaded from https://www.dovepress.com/ by 118.70.13.36 on 25-Aug-2020
Dovepress PTen with biochemical recurrence in prostate cancer
Our search strategy preliminarily identified 128 potentially relevant articles for further evaluation. After further evaluat-ing the title and abstract, a total of 15 articles meetevaluat-ing our search criteria were chosen for further detailed evaluation. After careful, detailed evaluation, we excluded six studies because they did not provide the precise number of patients with PCa BCR. A total of ten studies (nine articles), includ-ing a total of 2,154 PTEN positive expression cases and 1,006 PTEN deletion cases, were finally deemed eligible for the analysis.
All ten studies were related to clinical research and reported the number of patients with PTEN expression or PCa BCR. All of them were studies of prostatic adenocarcinoma specimens obtained from radical prostatectomy. Among the ten studies, seven studies analyzed PTEN expression quantitatively via IHC and the remaining three studies via fluorescence in situ hybridization. The main characteristics of the ten eligible articles are shown in Table 1. The mainly established prognostic factors for PCa, the GS and the pT stage are listed in detail.
Meta-analysis results
Ten articles that included a total of 2,154 PTEN positive expression cases and 1,006 PTEN deletion cases were used to evaluate the relationship between PTEN expression and PCa BCR rate. All the included studies arrived at a high methodological quality (NOS$7). All results of this meta-analysis are summarized in Table 2.
As shown in Figure 2A, a forest plot of meta-analysis for the overall, the OR for all eligible studies evaluating the associations of positive expression of PTEN with BCR rate was 0.521 (95% CI: 0.431–0.630, POR=0.000) calculated by a fixed-effects model (Pheter=0.245), indicating that positive expression of PTEN has a close relationship with lower PCa BCR rate when all eligible studies were pooled into the meta-analysis. In other words, PTEN deletion is associated with a higher BCR rate in PCa.
We then performed subgroup analyses to investigate the effect of race and sample size. The subgroup of multiple races consisted of Caucasian, Hispanic, and African Ameri-can. As shown in Figure 2B, in the subgroups of “Multiple races” (n=2) and “Caucasian” (n=5), there was a statistically lower BCR rate in the PTEN positive expression cases; the ORs of Multiple races and Caucasian were 0.215 (95% CI: 0.072–0.648, POR=0.006) and 0.469 (95% CI: 0.373–0.591, POR=0.000), respectively. However, in the subgroup of “Asian” (n=2), we did not find any significant relationship between positive expression of PTEN and BCR rate, which was analyzed by the random-effects model. The OR of
“Asian” was 0.48 (95% CI: 0.111–2.077, POR=0.326). There was only one cohort study evaluating association of positive expression of PTEN with BCR in African American, and the original OR was 0.253 (95% CI: 0.027–2.407, POR=0.232).
There were five studies with a sample size ,100, while five studies with a sample size .100. The OR of “,100” sample size was 0.285 (95% CI: 0.143–0.567, POR=0.000), while the OR of “.100” sample size was 0.547 (95% CI: 0.450–0.666, POR=0.000). Subgroup analyses according to sample size suggested that the associations of positive expression of PTEN with BCR rate were significant in both subgroups, as shown in Figure 2C.
In summary, the positive expression of PTEN was associated with lower BCR rate significantly overall and in subgroups according to race or sample size, except in the subgroups of African American and Asian.
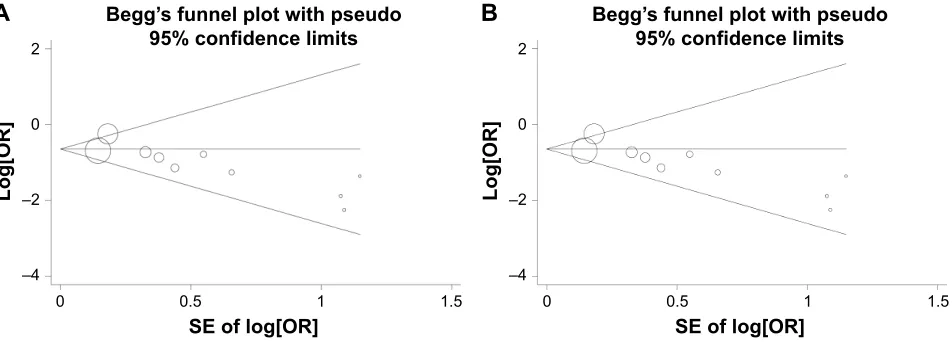
Publication bias
Publication bias was assessed by Begg’s test funnel plot and Egger’s test. As shown in Figure 3A, Begg’s test funnel plot was roughly symmetrical (PBegg=0.074). Egger’s test was then performed and showed significant publication bias (PEgger=0.018). The publication bias did exist. Then, we detected which studies were responsible for publication bias by deleting one or some of them.
Further analysis suggested that after deleting the Mithal’s study and the African American cohort of Petrovics’ study, the publication bias was reduced (Figure 3B; PBegg=0.174, PEgger=0.079). Considering that the patients in Mithal’s study consisted of a high proportion of African Americans (42/77), we speculated that the publication bias might be resulted from the African American population.
sensitivity analysis
We conducted sensitivity analyses through sequentially excluding individual studies. When a sensitivity analysis was carried out from ten pooled analysis, the recalculated ORs using a fixed-effects model remained stable (the ORs were ,1), as shown in Figure 4A. The Kim’s study had the greatest impact on OR among ten studies, but after deleting it, the OR was still ,1. In other words, the results demon-strated that the pooled ORs were not affected by removing every single study each time.
Due to the Mithal’s study and the African American cohort of Petrovics’ study contributing to the publication bias, the sensitivity analysis was also performed after deleting Mithal’s study and the African American cohort of Petrovics’ study. The results suggested that the pooled ORs were ,1 and still significant (Figure 4B).
OncoTargets and Therapy downloaded from https://www.dovepress.com/ by 118.70.13.36 on 25-Aug-2020
Dovepress
Xie et al
Table 1
c
haracteristics of the included studies
Reference
Year
Country
Race
Patients number
Age (years)
GS
T or N stage
P at ie nt s w it h BCR (n)
Follow-up time (months) Cutoff value (%)
PTEN + PTEN -BCR Non-BCR BCR Non-BCR r oble Bedolla et al 4 2007 U sa
Multiple races
65 66 (38–83) , 7 (40), = 7 (14), . 7 (11)
T1 (4), T2 (27), T3 (34)
31 10 21 51 10 14 a lcides c haux et al 5 2012 U sa c aucasian 574 Bcr : 58.7 ± 6.1, non-B cr : 58.9 ± 5.8 , 7 (86), = 7 (355), . 7 (132)
T2 (74), T3a (293), T3b or
n 1 (207) 286 Bcr : 30 ± 22.8, non-Bcr : 70.8 ± 28.8 10 O r
: 0.478 (95%
ci
, 0.253–0.909)
Prabhakar Mithal et al
13
2014
U
sa
Multiple races
77 PT en -: 60.6 ± 6.9, PT en + : 62 ± 5.5 , 7 (14), = 7 (52), . 7 (11)
T1 (36), T2/3 (30)
39 105.6 10 31 68 8 9 sung h an Kim et al 18 2015
south Korea
a sian 611 66 (44–89) , 7 (342), = 3 + 4 (128), = 4 + 3 (74), . 7 (79) T2 (405), T3 (177), T4 (1), n + (28) 170 44.0 (12–154) 25 92 358 78 253 Tamara l
lotan et al
20 2016 U sa c aucasian 1,095 , 7 (451), = 3 + 4 (407), = 4 + 3 (130), . 7 (100)
T1/2 (610), T3/4 (300)
505 90 352 837 153 258
Xiaoyu Qu et al
21 2016 U sa c aucasian 160 64 (44–77) , 7 (80), = 7 (51), . 7 (29)
T2 (85), T3 (72), T4 (3)
50 64.5 (1–179) 20 30 118 14 27 Maria P silva et al 22 2016 n orway c aucasian 132 64 (47–74) , 7 (2), = 3 + 4 (31), = 4 + 3 (44), . 7 (55)
T2 (17), T3 (98), T4 (17)
62 117.8 (8.6–226.3) 50 35 88 27 44 Byeong -Joo n
oh et al
17
2016
south Korea
a sian 68 PT en -: 65.3 ± 5.7, PT en + : 68.2 ± 4.6 , 7 (19), = 7 (36), . 7 (13)
T2 (38), T3 (30)
17 49.2 (11–111) 50 1 16 16 52
Petrovics et al (aa
) 19 2015 U sa a frican a merican 40 , 7 (15), = 7 (15), . 7 (10) 24 25 19 15 5 1
Petrovics et al (ca
) 19 2015 U sa c aucasian 59 , 7 (19), = 7 (21), . 7 (12) 34 25 10 12 24 13 Notes: The age of the patients is presented as mean ± s D or median with range. gs and stage data are presented with patient numbers in parentheses. g leason scores range from 2 to 10, with 2 representing the most well-differentia ted
tumors and 10 the least-differentiated tumors.
g
leason score 3
+
4
=
7 (prognostic grade group
ii) indicating the majority is pattern 3;
g
leason score 4
+
3
=
7 (prognostic grade group
iii
) where pattern 4 is dominant.
Abbreviations:
AA, African American; BCR, biochemical recurrence; CA, Caucasian American; CI, confidence interval; GS, Gleason score; OR, odds ratio; PTEN, phosphatase and tension homolog.
OncoTargets and Therapy downloaded from https://www.dovepress.com/ by 118.70.13.36 on 25-Aug-2020
Dovepress PTen with biochemical recurrence in prostate cancer
Table 2 Meta-analyses results overall and by subgroups stratified by race or sample size
Groups Studies (n) OR 95% CI POR M I2 (%) P
heter PBegg PEgger
race
Multiple races 2 0.215 0.072–0.648 0.006 F 0.00 0.439
caucasian 5 0.469 0.373–0.591 0.000 F 0.00 0.897
asian 2 0.48 0.111–2.077 0.326 r 55.90 0.132
Patients, n
,100 5 0.285 0.143–0.567 0.000 F 0.00 0.752
.100 5 0.547 0.450–0.666 0.000 F 37.00 0.175
Overall 10 0.521 0.431–0.630 0.000 F 21.50 0.245 0.074 0.018
8a 0.531 0.439–0.642 0.000 F 21.00 0.263 0.174 0.079
Note:aMithal et als’ study13 and african american cohort of Petrovics et als’ study19 were excluded.
Abbreviations: CI, confidence interval; F, fixed-effects model; I2, test statistic for heterogeneity; M, effects models for calculating the pooled Or; Or, odds ratio; PBegg,
P-value for Begg’s test; Pegger, P-value for egger’s test; Pheter, P-value for heterogeneity test; POr, P-value for Or; r, random-effects model.
Discussion
PCa is one of the most common malignancies around the world. The mainly established prognostic factors for PCa are GS, pT stage, and serum level of PSA. Recently, a series of novel prognostic biomarkers have also been found for PCa management. For example, transmembrane protease, serine 2 (TMPRSS2)–ETS-related gene (ERG), cysteine-rich secretory protein 3 (CRISP3), fatty acid synthase (FASN), and PTEN were found to be altered in PCa, including fused genes and chromosomal deletion, and have been considered as important prognostic factors for PCa.23 Furthermore, measurement of circulating or urinary microRNAs (miR-NAs) is emerging as a noninvasive tool for PC diagnosis and prognosis.24
The prostate-specific gene TMPRSS2 is fused with ERG in a large proportion of PCa cases and is considered as
a prognostic predictor. TMPRSS2 is a prostate-specific, androgen-regulated gene, and its rearrangement leads to high expression of the ETS members.25 ERG, one of the EST members, plays an important role in a variety of bio-logical processes, including cell proliferation, differentiation, angiogenesis, and tumor invasiveness. It is reported that ERG expression was a significantly strong and independent predictor of all stages of PCa progression. The association between ERG fusion and poor prognostic indicators, includ-ing higher Gleason grade, pathologic stage, BCR, metastases, and cancer-specific mortality, has been proved.26
CRISP3, belonging to a large family of cysteine-rich secretory proteins, is highly expressed in several exocrine glands, including salivary, pancreas, and prostate glands.6 CRISP3 has been reported to be a direct target of the tran-scription factor ERG. ERG and CRISP3 mRNA levels were
Figure 2 (Continued)
5HIHUHQFH
ZHLJKW
25&,
%HGROODHWDO
&KDX[HWDO
0LWKDOHWDO
.LPHWDO
/RWDQHWDO
6LOYDHWDO
1RKHWDO
4XHWDO
3HWURYLFVHWDO$$
3HWURYLFVHWDO&$
2YHUDOO, 3
$
OncoTargets and Therapy downloaded from https://www.dovepress.com/ by 118.70.13.36 on 25-Aug-2020
Dovepress
Xie et al
Figure 2 Forest plots for the association between PTen expression and Bcr rate overall (A) and in subgroups stratified by race (B) and by sample size (C) in Pca.
Notes: Positive expression of PTen vs lost expression of PTen. Weights are from random effects analysis.
Abbreviations: AA, African American; BCR, biochemical recurrence; CA, Caucasian American; CI, confidence interval; OR, odds ratio; PCa, prostate cancer; PTEN, phosphatase and tension homolog.
5HIHUHQFH
ZHLJKW
25&,
3HWURYLFVHWDO&$
&KDX[HWDO
2YHUDOO, 3
%HGROODHWDO
0XOWLSOHUDFHV
&DXFDVLDQ
$VLDQ
0LWKDOHWDO
.LPHWDO
/RWDQHWDO
6LOYDHWDO
1RKHWDO
4XHWDO
6XEWRWDO, 3
6XEWRWDO, 3
6XEWRWDO, 3
$IULFDQ$PHULFDQ
3HWURYLFVHWDO$$
6XEWRWDO, 3
ZHLJKW
25&, 5HIHUHQFH
3HWURYLFVHWDO$$
3HWURYLFVHWDO&$
1RKHWDO
&KDX[HWDO
2YHUDOO, 3
+HWHURJHQHLW\EHWZHHQJURXSV3
%HGROODHWDO
6DPSOHVL]H
6DPSOHVL]H!
0LWKDOHWDO
.LPHWDO
/RWDQHWDO
6LOYDHWDO
4XHWDO
6XEWRWDO, 3
6XEWRWDO, 3
%
&
OncoTargets and Therapy downloaded from https://www.dovepress.com/ by 118.70.13.36 on 25-Aug-2020
Dovepress PTen with biochemical recurrence in prostate cancer
±
±
6(RIORJ>25@
/RJ>25@
$
%HJJ¶VIXQQHOSORWZLWKSVHXGR FRQILGHQFHOLPLWV6(RIORJ>25@
/RJ>25@
%
%HJJ¶VIXQQHOSORWZLWKSVHXGR FRQILGHQFHOLPLWV
±
±
Figure 3 Funnel plots assessing evidence of publication bias from (A) all ten eligible studies (PBegg=0.074, Pegger=0.018) and (B) the eight studies after excluding Mithal et als’
study13 and the african american cohort of Petrovics et als’ study19 (P
Begg=0.174072, Pegger=0.079).
Note: The circles represent the weight of individual study.
Abbreviations: Or, odds ratio; PBegg, P-value for Begg’s test; Pegger, P-value for egger’s test; se, standard error.
strongly correlated. Both were associated with pT3 disease staging. A higher expression of CRISP3 has been linked to poor prognosis of PCa. It is reported that CRISP3 mRNA was significantly associated with higher GS and BCR.17
FASN is an enzyme that synthesizes long-chain fatty acids. FASN upregulation can lead to Warburg effect in multiple cancer types, including kidney, pancreas, lung, and colorectal cancers. FASN overexpression has also been described in PCa as a significant predictor of cancer progres-sion and pathologic stage.26
miRNAs, the small sequences of noncoding RNAs, regu-late specific genes involved in the development of PCa.24 Stable miRNAs have already been found in serum and plasma and played a critical role in tumor initiation, develop-ment, and progression. Some miRNAs, including miR-106a, miR-223, and miR-1207, correlated with the Cancer of the Prostate Risk Assessment Post-Surgical (CAPRA-S) score (a PCa risk assessment based on patient age), PSA serum levels, clinical tumor stage, and the GS.26,27 Thus, the measurement of PCa-associated miRNAs is emerging as a promising tool for PCa monitoring.
Other emerging immune-histochemical biomarkers of PCa, membrane-associated guanylate kinase, WW and PDZ domain-containing 2 (MAGI-2), and serine peptidase inhibitor Kazal-type 1 (SPINK1), were also associated with an increased risk of disease progression and BCR.26
PTEN, mapped to chromosome 10q23.3, regulates cell growth, survival, and genome stability by targeting proteins in signaling pathways.10,28 Its genomic deletion has been observed in several human malignancies including PCa and is the major hallmark of tumor invasion and progression.12,29–32
In PCa, PTEN acts as a tumor suppressor by negatively regulating the PIK3/Akt pathway.7
Previous studies have revealed that PTEN deletion is associated with some clinical features in PCa such as higher GS, higher clinical stage, and larger tumor size and is also a prognostic factor.15,20,22,33,34 Some studies have focused on the relationship between PTEN deletion and BCR rate, a principal cause for treatment failure and death in patients with PCa.4,6,21 However, the results are inconclusive and insufficient, thus we performed a systematic meta-analysis to clarify the relationship.
In our analysis, nine articles containing ten independent cohort studies with a total of 3,160 PCa cases were included, and the pooling analyses suggested that positive expression of PTEN was associated with lower BCR rate (in other words, PTEN deletion was an indicator of higher BCR rate in PCa). Subgroup analyses stratified by race or sample size suggested that the associations were significant in subgroups of Multiple races, Caucasian, sample size ,100, and sample size .100 but not in Asian, indicating the different genetic contribu-tion to PCa BCR rate among different races. In addicontribu-tion, the previous studies have shown that African Americans have a higher rate of PCa incidence and mortality compared with Caucasian American men, which may be due to the different genetic background. Petrovics et al have found that genomic deletions of LSAMP were more prevalent, while the rate of PTEN and ERG loss was significantly lower in African American cases than that in Caucasian American cases. In our meta-analysis, subgroup analysis of African American could not be performed because only one study reported the association between PTEN and PCa rate in African
OncoTargets and Therapy downloaded from https://www.dovepress.com/ by 118.70.13.36 on 25-Aug-2020
Dovepress
Xie et al
American population. Publication bias analysis revealed that the Mithal’s study (with a high proportion of African American) and the African American cohort of Petrovics’ study might be responsible for the publication bias. This also demonstrated the different genetic contribution to PCa BCR rate among different races.
Our study is the first meta-analysis to evaluate the effect of PTEN expression on the PCa BCR rate. However, some limitations of this meta-analysis should be noted. First, because the number of studies included in our analysis was small, there is a disproportionate effect on the final analysis, which could not be avoided. Second, the data were only
from studies meeting our inclusion criteria, and many other published studies that did not meet these criteria may be missed out. Third, this meta-analysis was based on positive expression of PTEN, so we were only able to evaluate the relationship between positive expression of PTEN and BCR rate, not the individual positive PTEN values.
Conclusion
Our meta-analysis provides evidence of an association between positive expression of PTEN and PCa BCR rate, suggesting that positive expression of PTEN could increase PCa BCR rate. It indicated that PTEN deletion is a potentially
%HGROODHWDO
0HWDDQDO\VLVIL[HGHIIHFWVHVWLPDWHV H[SRQHQWLDOIRUPVWXG\RPPLWHGD
&KDX[HWDO
0LWKDOHWDO
.LPHWDO
/RWDQHWDO
6LOYDHWDO
1RKHWDO
4XHWDO
3HWURYLFVHWDO$$
3HWURYLFVHWDO&$
%HGROODHWDO
0HWDDQDO\VLVIL[HGHIIHFWVHVWLPDWHV H[SRQHQWLDOIRUPVWXG\RPPLWHGD
&KDX[HWDO
.LPHWDO
/RWDQHWDO
6LOYDHWDO
1RKHWDO
4XHWDO
3HWURYLFVHWDO&$
$
%
Figure 4 sensitivity analyses of studies from (A) all ten eligible studies and (B) the eight studies after excluding Mithal et als’ study13 and the african american cohort of
Petrovics et als’ study.19
Note:astudy omitted: the effect of each study on the pooled odds ratios was evaluated with sensitivity analyses via omitting each study in each turn.
Abbreviations: aa, african american; ca, caucasian american.
OncoTargets and Therapy downloaded from https://www.dovepress.com/ by 118.70.13.36 on 25-Aug-2020
OncoTargets and Therapy
Publish your work in this journal
Submit your manuscript here: http://www.dovepress.com/oncotargets-and-therapy-journal
OncoTargets and Therapy is an international, peer-reviewed, open access journal focusing on the pathological basis of all cancers, potential targets for therapy and treatment protocols employed to improve the management of cancer patients. The journal also focuses on the impact of management programs and new therapeutic agents and protocols on
patient perspectives such as quality of life, adherence and satisfaction. The manuscript management system is completely online and includes a very quick and fair peer-review system, which is all easy to use. Visit http://www.dovepress.com/testimonials.php to read real quotes from published authors.
Dovepress
Dove
press
PTen with biochemical recurrence in prostate cancer
novel clinical event to identify individuals at an increased risk for the PCa progression.
Disclosure
The authors report no conflicts of interest in this work.
References
1. Siegel RL, Miller KD, Jemal A. Cancer statistics, 2017. CA Cancer J
Clin. 2017;67(1):7–30.
2. Ferlay J, Soerjomataram I, Dikshit R, et al. Cancer incidence and mor-tality worldwide: sources, methods and major patterns in GLOBOCAN 2012. Int J Cancer. 2015;136(5):E359–E386.
3. Burdelski C, Reiswich V, Hube-Magg C, et al. Cytoplasmic accumula-tion of sequestosome 1 (p62) is a predictor of biochemical recurrence, rapid tumor cell proliferation, and genomic instability in prostate cancer.
Clin Cancer Res. 2015;21(15):3471–3479.
4. Bedolla R, Prihoda TJ, Kreisberg JI, et al. Determining risk of bio-chemical recurrence in prostate cancer by immunohistobio-chemical detec-tion of PTEN expression and Akt activadetec-tion. Clin Cancer Res. 2007; 13(13):3860–3867.
5. Chaux A, Peskoe SB, Gonzalez-Roibon N, et al. Loss of PTEN expression is associated with increased risk of recurrence after pros-tatectomy for clinically localized prostate cancer. Mod Pathol. 2012; 25(11):1543–1549.
6. Grupp K, Kohl S, Sirma H, et al. Cysteine-rich secretory protein 3 overexpression is linked to a subset of PTEN-deleted ERG fusion-positive prostate cancers with early biochemical recurrence. Mod
Pathol. 2013;26(5):733–742.
7. Zhang S, Yu D. PI(3)king apart PTEN’s role in cancer. Clin Cancer
Res. 2010;16(17):4325–4330.
8. Courtney KD, Corcoran RB, Engelman JA. The PI3K pathway as drug target in human cancer. J Clin Oncol. 2010;28(6):1075–1083. 9. De Velasco MA, Uemura H. Preclinical remodeling of human prostate
cancer through the PTEN/AKT pathway. Adv Urol. 2012;2012:1–12. 10. Wang X, Jiang X. PTEN: a default gate-keeping tumor suppressor with
a versatile tail. Cell Res. 2008;18(8):807–816.
11. Lin P-C, Lin J-K, Lin H-H, et al. A comprehensive analysis of phos-phatase and tensin homolog deleted on chromosome 10 (PTEN) loss in colorectal cancer. World J Surg Oncol. 2015;13(1):186.
12. Ferraldeschi R, Nava Rodrigues D, Riisnaes R, et al. PTEN protein loss and clinical outcome from castration-resistant prostate cancer treated with abiraterone acetate. Eur Urol. 2015;67(4):795–802.
13. Mithal P, Allott E, Gerber L, et al. PTEN loss in biopsy tissue predicts poor clinical outcomes in prostate cancer. Int J Urol. 2014;21(12): 1209–1214.
14. Mulholland DJ, Tran LM, Li Y, et al. Cell autonomous role of PTEN in regulating castration-resistant prostate cancer growth. Cancer Cell. 2011;19(6):792–804.
15. Kluth M, Runte F, Barow P, et al. Concurrent deletion of 16q23 and PTEN is an independent prognostic feature in prostate cancer. Int J
Cancer. 2015;137(10):2354–2363.
16. Epstein JI, Feng Z, Trock BJ, Pierorazio PM. Upgrading and downgrad-ing of prostate cancer from biopsy to radical prostatectomy: incidence and predictive factors using the modified Gleason grading system and factoring in tertiary grades. Eur Urol. 2012;61(5):1019–1024.
17. Noh B-J, Sung JY, Kim Y, Chang SG, Park YK. Prognostic value of ERG, PTEN, CRISP3 and SPINK1 in predicting biochemical recurrence in prostate cancer. Oncol Lett. 2016;11(6):3621–3630.
18. Kim SH, Kim SH, Joung JY, et al. Overexpression of ERG and wild-type PTEN are associated with favorable clinical prognosis and low biochem-ical recurrence in prostate cancer. PLoS One. 2015;10(4):e0122498. 19. Petrovics G, Li H, Stumpel T, et al. A novel genomic alteration of
LSAMP associates with aggressive prostate cancer in African American men. EBioMedicine. 2015;2(12):1957–1964.
20. Lotan TL, Wei W, Morais CL, et al. PTEN loss as determined by clinical-grade immunohistochemistry assay is associated with worse recurrence-free survival in prostate cancer. Eur Urol Focus. 2016;2(2):180–188. 21. Qu X, Jeldres C, Glaskova L, et al. Identification of combinatorial
genomic abnormalities associated with prostate cancer early recurrence.
J Mol Diagn. 2016;18(2):215–224.
22. Silva MP, Barros-Silva JD, Ersvaer E, et al. Cancer prognosis defined by the combined analysis of 8q, PTEN and ERG. Transl Oncol. 2016; 9(6):575–582.
23. McGrath S, Christidis D, Perera M, et al. Prostate cancer biomarkers: are we hitting the mark? Prostate Int. 2016;4(4):130–135.
24. Bertoli G, Cava C, Castiglioni I. MicroRNAs as biomarkers for diagno-sis, prognosis and theranostics in prostate cancer. Int J Mol Sci. 2016; 17(3):421–441.
25. Lu LI, Zhang H, Pang J, Hou GL, Lu MH, Gao X. ERG rearrangement as a novel marker for predicting the extra-prostatic extension of clini-cally localised prostate cancer. Oncol Lett. 2016;11(4):2532–2538. 26. Giannico GA, Arnold SA, Gellert LL, Hameed O. New and emerging
diagnostic and prognostic immunohistochemical biomarkers in prostate pathology. Adv Anat Pathol. 2017;1(24):35–44.
27. Filella X, Foj L. Prostate cancer detection and prognosis: from prostate specific antigen (PSA) to exosomal biomarkers. Int J Mol Sci. 2016; 17(11):1784–1805.
28. Yoshimoto M, Cunha IW, Coudry RA, et al. FISH analysis of 107 prostate cancers shows that PTEN genomic deletion is associated with poor clinical outcome. Br J Cancer. 2007;97(5):678–685.
29. Atreya CE, Sangale Z, Xu N, et al. PTEN expression is consistent in colorectal cancer primaries and metastases and associates with patient survival. Cancer Med. 2013;2(4):496–506.
30. Zhu X, Qin X, Fei M, et al. Loss and reduced expression of PTEN correlate with advanced-stage gastric carcinoma. Exp Ther Med. 2013; 5(1):57–64.
31. Tan MH, Mester JL, Ngeow J, Rybicki LA, Orloff MS, Eng C. Lifetime cancer risks in individuals with germline PTEN mutations. Clin Cancer
Res. 2012;18(2):400–407.
32. Price TJ, Hardingham JE, Lee CK, et al. Prognostic impact and the relevance of PTEN copy number alterations in patients with advanced colorectal cancer (CRC) receiving bevacizumab. Cancer Med. 2013;2(3):277–285.
33. Tsourlakis MC, Weigand P, Grupp K, et al. βIII-tubulin overex-pression is an independent predictor of prostate cancer progression tightly linked to ERG fusion status and PTEN deletion. Am J Pathol. 2014;184(3):609–617.
34. Burdelski C, Menan D, Tsourlakis MC, et al. The prognostic value of SUMO1/Sentrin specific peptidase 1 (SENP1) in prostate cancer is limited to ERG-fusion positive tumors lacking PTEN deletion.
BMC Cancer. 2015;15:538.
OncoTargets and Therapy downloaded from https://www.dovepress.com/ by 118.70.13.36 on 25-Aug-2020