1803
Intergrated Approach Of Tsunami Vulnerability
Assessment At Coastal Area Of Kalianda Sub
District, South Lampung District, Lampung
Province, Indonesia
Muhammad Helmi, Yola Hardiyani Pholandani, Heryoso Setiyono, Anindya Wirasatriya, Warsito Atmodjo, Rikha Widyaratih, Agus Anugroho Dwi Suryoputro
Abstract: Kalianda Subdistrict is a densely populated area located in the coastal area of South Lampung District, Lampung Province. Its location is only 323.6 km to the confluence zone of the tectonic plate of Sunda Strait Megathrust which makes this area is vulnerable from the tsunami disaster. The present study aims to simulate the tsunami wave propagation from the epicenter to the coastal area of Kalianda by using a numerical 2D model and to produce a tsunami vulnerability index map of Kalianda Subdistrictce by using geospatial modeling. The simulation result shows that 35 minutes after the tectonic earthquake, sea level drops for 40 minutes. The lowest sea level is -4.8 m from MSL at 73th minutes after the earthquake. After that, the first tsunami wave is formed at 84th minutes after the earthquake reaching 8.5 m height. Sea level drops slightly before the second tsunami wave occurs after at 93rd minutes after the earthquake reaching 12.5 m height. The tsunami vulnerability index map shows that the middle part of the coastal area of Kalianda is the most vulnerable area. It has the level of vulnerable and very vulnerable. The areas categorized as vulnerable observed until 5 km to the land. This area is coastal plain with low and flat elevation and the morphology of this area is a gulf shape. This research also manages to identify evacuation sites. The evacuation sites spread close to the vulnerable areas which easily can be reached by the people during tsunami attack..
Index Terms: tsunami, numerical model, geospastial, vulnerability, and Lampung.
—————————— ——————————
1 INTRODUCTION
The word ―tsunami‖ is adopted from Japanesse Language, means high wave entering harbour area. Tsunami is also known by the vertical water body movement caused by geological process (Bryant, 2014). Earthquake with epicenter in the bottom of the sea becomes the dominant geological process that generate tsunami (Cecioni, et al., 2014). Generally, tsunami occurs at the deep sea subduction zone (Hayes, et al., 2012) and moves to shallow waters with destructive huge energy (Strusinksa, 2017). Most of Indonesian Seas are located at the confluence of three main tectonic plate which make Indonesian territory is vulnerable from earthquake and tsunami. Along southern coast of Java and Sumatra is one of vulnerable territories since this area is known as subduction zone of Sunda Strait Megathrust (Irsyam, et al., 2017).Kalianda is a sub-district at South Lampung District, Lampung Province. Kalianda is located at the western edge of Sunda Strait, a channel that connects Java Sea and Indian Ocean (Fig.1). The areal size of Kalianda is 161.4 km2 with 88,681 people live at this area (BPS, 2018). Kalianda also becomes the capital of subdistrict with fast infrastructure development which made Kalianda District vulnerable to tsunami. Based on the Tsunami Catalogue from Meteorology, Climatology and Geophysics Agency, eight Tsunamies occurrences in Sunda Strait have been recorded since 416. The last destructive tsunami occurred on 22 December 2018 caused by Krakatoa eruption.
Figure 1. Study Area
Tsunami studies by using hydrodinamics modelling has been conducted in many areas in the world such as Makran subduction zone, Arabian Sea (Rashidi, et al., 2018), Tohoku region, Japan (Tanioka, and Gusman, 2018) and Marmara ————————————————
Muhammad Helmi, Department of Oceanography, Faculty of Fisheries and Marine Sciences,Diponegoro University, +62818108129,
muhammadhelmi69@gmail.com
Yola Hardiyani Pholandani, Department of Oceanography, Faculty of Fisheries and Marine Sciences,Diponegoro University,
yolapholan@gmail.com
Heryoso Setiyono, Department of Oceanography, Faculty of Fisheries and Marine Sciences,Diponegoro University, heryoso@yahoo.com Anindya Wirasatriya, Department of Oceanography, Faculty of Fisheries
and Marine Sciences,Diponegoro University, aninosi@yahoo.co.id Warsito Atmodjo, Department of Oceanography, Faculty of Fisheries
and Marine Sciences,Diponegoro University,
warsito_osigeo@yahoo.com
Rikha Widyaratih, Department of Oceanography, Faculty of Fisheries and Marine Sciences,Diponegoro University, rikha_wh@yahoo.com
1804 Sea, Turkey (Guler, et al., 2018) and many areas in Indonesia
(Anwar, et al., 2018; Muhammad and Goda, 2018; Hartoko, et al., 2016; Satriadi, et al., 2018; Al’ala, et al., 2015; Syamsidik, et al., 2018 & 2015). Generation and propagation of tsunami wave can be simulated by using this method.
On the other hand, research about tsunami vulnerability index by using geospatial modelling in Indonesia has been conducted (Anwar, et al., 2018; Helmi, et al., 2018; Fitriyanto, et al., 2019). Vulnerability level is determined by some indices such as land elevation, distance from coastal line, coastal morphology, etc. In the geospatial However, none of the previous studies has integrated the hidrodynamic and geospatial modelling to achieve a comprehensive research that uses wave run up simulation as a basis for determining vulnerability index as presented in the present study. Furthermore, since Kalianda is located inside the narrow strait, with many small islands and has complex shape of coastal line, it is interesting to know the wave transformation of simulated propagating tsunami wave from the epicenter to coastal area of Kalianda. The present study aims to investigate the characteristics of tsunami wave by using hydrodynamic model, to describe vulnerability levels of the impacted areas and to determine tsunami evacuation route based on the vulnerability levels. Evacuation routes is important to be designed to avoid mass fatalities during tsunami. Furthermore, the result of this research can be used as a basis for stake holders to design the tsunami mitigation based spatial planning in the study area.
2.
MATERIAL
AND
METHODS
2.1 Tsunami Wave SimulationWe use 2D numerical model Cornell Multigrid Coupled Tsunami Model (COMCOT) ver. 1.7. to simulate tsunami wave. The input of this model is as follows (Wang, et al., 2009).
2.2 Bathymetry Data
For bathymetry, we combined data from British Oceanographic Data Center and from Information and Geospatial Agency of Indonesia for coarse resolution (15 arc second) and fine resolution (with 6 arc second) respectively.
2.3 Tsunami Generating Factor
Tectonic earthquake was chosen as tsunami generating factor. The earthquake parameters are magnutude (strike), plate shifting angle (slip), epicenter depth, berdasarkan data magnitude gempa, kedalaman epicenter (dip), dislocation, fault length and width obtained from USGS (2019). The calculation of dislocation, fault length and width use equation as follows (Wells & Coppersmith, 1994):
)
(M
Magnitude
x
1.03
7.03
-D
wLog
(1))
(M
Magnitude
x
27
.
0
0.76
W
wLog
(2))
(M
Magnitude
x
0.74
3.55
-L
Log
w (3)Where L, W and D are fault length, fault width and dislocation, respectively.
2.4 Numerical Model of Tsunami
COMCOT model is run based on shallow water equation. Linear shallow water equation is used in the calculation of wave propagation in the deep water (eq. 4):
t
h
y
Q
x
P
t
,
0
fQ
x
gh
t
P
,
0
fP
y
gH
t
Q
(4)
After entering shallow water in the coastal area, the calculation uses non-linear shallow water equation (eq. 5):
t
h
y
Q
x
P
t
,
0
2
xF
x
gH
H
PQ
y
H
P
x
t
P
,
0
2
yF
y
gH
H
Q
y
H
PQ
x
t
Q
(5)
Where η is sea water elevation (m), P and Q are flux volume in the direction of x and y, h is depth, H is total depth (
h
), g is gravitational accelerationFx
&
Fy
, are bottom friction in the direction of x and y, and f is Coriolis force (Wang et al., 2007).2.5 Tsunami Wave Simulation Scenario
We use 2D numerical model Cornell Multigrid Coupled Tsunami Model (COMCOT) ver. 1.7. to simulate tsunami wave. The input of this model is as follows (Wang, et al., 2009).
2.6 Geospatial Model of Tsunami Vulnerability Index
To asses tsunami vulnerability at Kalianda Sub-district, we used Geospatial model approach with physical variable indices as follow :
Epicenter position= 103,778841°E and -7,460684°S (See Fig 1), depth = 33 km, strike = 305°, dip = 11°, slip =103°, length of fault :916.2°, width of fault :41.3°, dislocation: 108 m.
2.7 Coastal Elevation and Slope
Elevation and coastal slope are the main variable to determine tsunami vulnerability level (Sinaga, et al., 2011). These data are obtained from the analysis of Digital Terrain Model (DTM) with 10 m spatial resolution. DTM was generated by gridding process of contour lines and height spots from topographical map scale 1 : 50.000 released by Information and Geospatial Agency of Indonesia. Slope classification is based on shown in table 1 (Zuidam, 1985).
2.8 Coastal Morphology
1805
2.9 Coastal Geomorphology
Coastal Geomorphology was identified based on Sentinel-2 satellite with geomophology reference from ecoregion map with scale 1:100,000 at the study area. Map data was obtained from the geospatial information agency. Coastal geomorphology map was produced at the scale of 1 : 250,000. The type of geomorphology at the study area and the level of vulnerability are shon in table 1.
2.10 Distance from Coastal Line and Rivers
Tsunami wave enters land from coastal area and can penetrate further through rivers. Thus distance from coastal line and rivers become the important parameter for determining tsunami vulnerability level. Spatial Euclidian Distance method is used for these distance mapping with classification shown in Table 1.
Table 1. Tsunami Vulnerability (Tv) indices
No Variable Class (Score) Weighted
1. Elevation (Ev) < 5m (5), 5 - <10m (4), 10 - <20m (3), 20 - <30m (2), > 30m (1)
0.35
2. Slope (Sl) ≤ 2% (5), 3 - 6% (4), 7 - 13% (3), 14 - 20% (2), > 20% (1)
0.30 3. Coastline
morphology (Cp)
gulf (5), meandering (3), straight (1)
0.20
4. Coastal geomorpholo gy (Cg)
Alluvial plain (5), intertidal plain (4), coastal plain (3) , Hilly (1)
0.15
2.11 Tsunami Vulnerability
GIS based scoring is applied at each parameter based on the estimated impact level. All scores in each parameter were summed. Algorithm used in the geospatial modelling at the present study is:
)
15
.
0
(
)
20
.
0
(
)
30
.
0
(
)
35
.
0
(
Ev
Sl
Cp
Cg
Tv
Then, total score was classified to determined five classes of tsunami vulnerability levels by using the following equation.
k
x
x
Ki
t
rWhere : Ki: Interval class, : lowest score, : : highest score, k: Number of classes (5 classes)
2.12 Evacuation Plan
Evacuation plan is determined to avoid fatalities during tsunami event. Evacuation plan consists of evacuation points and routes. Evacuation points were considered from the analysis of vulnerability levels. The lowest vulnerable areas were determined as potential evacuation points. The determination of evacuation routes should fulfill the following criteria :
1.The fastest routes to the evacuation points, and
2.Evacuation routes should be distributed evenly to avoid people accumulation during the emergency condition.
3
RESULT
AND
DISCUSSION
3.1. Ocean Basin Topography ConditionThree Dimensional view model in Fig. 2 has been produced to represent the detail position of Sunda Megatrhust in front of the Sunda Strait. The position of Sunda Megatrust has already described. The contact plane between the Indian/Australian oceanic plates descending beneath the Sunda plate; the two
descending plates are moving north–northeast with respect to the Sunda plate at a rate of about 50 mm per year. Furthermore, the rupture of a 1600-km length of the megathrust caused the great magnitude 9.2 earthquake of 26 December 2004 (Briggs, et al., 2006).
Figure 2. The Sunda megathrust in front of Sunda Strait on the 3D view model.
Black dashed line is the cross section of bathymetry shown in Fig. 3. Sunda Strait Megathrust has 6.487 m depth. The distance from the coastal area of Kalianda is very close i.e., only 323.6 km (Fig. 3). This causes the tsunami wave only needs very short time to reach the coastal area of Kalianda. Since megathrust is located at the very deep water, the potential water mass lifted by tsunami is also very large. Furthermore, before reaching coastal area, tsunami wave propagation is obstructed by the existence of small islands (Fig 5) which induces complex wave transformation.
Figure 3. Ocean basin topography of Sunda Megathrust to
Kalianda coastal area.
3.2. Tsunami Wave Model
The model simulation with the earthquake scenario of 8.8 Mw along Sunda Megathrust and the depth of epicenter of 33 km demonstrates the wave formation at the southwestern Kalianda with the amplitude of wave crest (trough) is 26.5 m (24.7 m) from Mean Sea Level (MSL) in Kalianda (Fig. 4). The wave crest and trough is generated beyond the subduction zone of Sunda Strait Megathrust. This ascending and descending water level generates tsunami wave at Sunda Strait and propagates to the coastal area of Kalianda.
1806 struck the coastal plain of southern Java, western Sumatra
and Sunda Strait. At the 30th minute, tsunami wave enters the middle of Sunda Strait and water level drop occurs at Kalianda. After that, 5 tsunami waves struck Kalianda for 45 minutes. From 1 hour and 30 minutes to 1 hour and 45 minutes after the earthquake, wave accumulation occurs as a result of the interaction between the incoming wave and narrowed strait, the existence of small islands and gulfy beach at the Sunda Strait. Two hours after the earthquake, the water mass accumulation passes Sunda Strait to Java Sea. The variation of ascending and descending water level in the beginning of earthquake is influenced by the magnitude of the earthquake and its epicenter’s depth (Lowrie, 2007). The characteristics of tsunami wave at the coastal area of Kalianda is shown in Fig. 5. Thirty five minutes after the earthquake, water level drops for 40 minutes and reaches -4.8 m below MSL. After that, the water level increases rapidly forming the first tsunami wave with 8.5 m height at 84th minutes after the earthquake. After that, water level slightly reduces but again quickly increases to 12.34 m at 93th minutes. This second wave becomes the highest tsunami wave occurs in Kalianda during this simulation. Totally, 4 times of water drops and 6 times of waves occurrences are observed during 120 minutes of tsunami simulation. The lowest water drop occurs at the first period while the smallest one occurs at the second period which is still above MSL. The third and fourth water drops are almost equal i.e., at 1.9 m and 2.1 m below MSL, respectively. The smallest water drop at the second period may be influenced by wave refraction and wave reflection formed by the interaction between the incoming tsunami wave with the coastal line of the mainland, shallow water at the coastal area and the existence of small islands at Sunda Strait. The resulting wave refraction and wave reflection cause the incoming wave patterns are not constant in height and time travel. The second period of the drop water is a result of the close occurrence of 2 high waves.
Figure 4. Spatial pattern of Tsunami wave at the Indian Ocean and Sunda Strait
Although the second wave becomes the highest wave during the simulation, the third, forth and fifth waves may becomes the most destructive wave since they occur almost at the
same time. With the wave height range from 5.9 m to 12.3 m, the duration of these merged waves are 20 minutes which is longer duration than the first and the second waves. These merged waves may have the most dangerous threat for infrastructure damages as well as fatalities.
Figure 5. Tsunami wave and it’s travel Time on the assessment point at Kalianda coastal area in the position coordinate:
105.5464; 5.72894 as plotted in Fig. 1
3.3. Coastal Landuse
Based on the land use classification using Sentinel-2 satelite immagery, we produced land use map as shown in Fig. 6. Land use of Kalianda Sub-district is very complex, consists of mixed vegetation, dry land agriculture, settlement, fishpond, swamp, forest and shrubs. The largest settlement area which is vulnerable from tsunami if located at coastal area at the southeastern Kalianda.
Figure 6. Landuse at the Kalianda coastal area.
3.4. Tsunami Vulnerable Area
1807 4 segments. Segment 1 and 4 which are located at the eastern
and western most of Kalianda have the lowest vulnerability index due to the domination of high elevations, steep slope and hilly areas in these segments. Mostly, along the coastal line of these segments are categorized as middle vulnerable and safe areas. Segment 3 is an alluvial plain with low elevation. Therefore the vulnerability index of this segment is higher than segment 1 and 4. Along the coastal line of this segment is categorized as vulnerable and very vulnerable areas. Segment 2 becomes the most vulnerable area in Kalianda. Not only because of low and flat alluvial plain but also the gulf shape coast have made tsunami wave can penetrate far to the mainland. Fig. 7 shows that the coastal areas of segment 2 are categorized as very vulnerable. Moreover, the areas categorized as vulnerable observed until 5 km to the land. Land cover analysis by using Sentinel-2 satellite shows that segment 2 is an fertile alluvial plain thus many human activities such as agriculture, housing, industry and services are growing in this area. Thus, mitigation effort is crucial to avoid fatalities due to tsunami attack. One of the mitigation plan is by designing evacuation route which is explained in the next section.
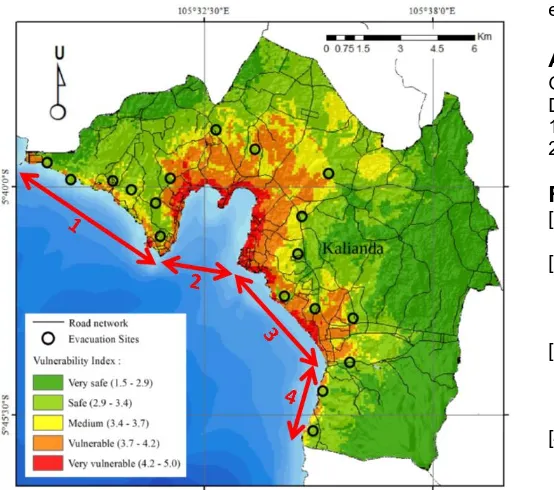
Figure 7. Tsunami Vulnerability Index Map
3.4. Evacuation Plan
Design of tsunami evacuation plan is determined by considering the vulnerability map. Based on the law of PERKA BNPB No. 4 year 2008 about Procedure of Evacuation Route Design, there are two aspects should be considered i.e., routes and evacuation sites. Evacuation routes should pass the main road and have the closest distance to the evacuation points. The evacuation sites should be the safe or very safe areas as shown in the vulnerability map and have the nearest distance from the human activities area. Later on, signs of direction and evacuation points should be placed in a strategic points to guide people to the evacuation points. Based on above mentioned criteria, we select several evacuation sites as shown in Fig. 7. In the evacuation sites, supporting infrastructure such as temporary shelter, emergency treatment center, clean water and sanitation need to be developed to
support emergency treatment of tsunami victims during tsunami attack.
4
CONCLUSION
Tsunami generated megathrust that threats Kalianda Subdistrict is located only 323.6 km from the coastal area of Kalianda at 6487 m depth. At the simulation, the dynamics of sea condition at the coastal area of Kalianda occurs 35 minutes after tectonic earthquake, commencing by sea level drop for 40 minutes. The lowest sea level is -4.8 from MSL at 73th minutes after earthquake. After that the first tsunami wave is formed at 84th minutes after earthquake reaching 8.5 m height. Sea level drops slightly before the second tsunami wave occurs after at 93th minutes after earthquake reaching 12.5 m height. Tsunami vulnerability index map shows that the middle part of the coastal area of Kalianda is the most vulnerable area. It has the level of vulnerable and very vulnerable. The areas categorized as vulnerable observed until 5 km to the land. This area is coastal plain with low and flat elevation and the morphology of this area is a gulf shape. This research also manages to identify evacuation sites. The evacuation sites spread close to the vulnerable areas which easily can by reached by the people during tsunami attack.
ACKNOWLEDGMENT
Gratitude to the Faculty of Fisheries and Marine of Universitas Diponegoro . University for this research funding (No: 19/UN7.5.10/PP/2019 apart APBN DPA SUKA FPIK Undip TA 2019).
REFERENCES
[1] Bryant, E. 2014. Tsunami Dynamic. Tsunami: The Tsunami Hazard. ISBN: 978-3-319-06132-0. pp: 19-32 [2] Cecioni, C., G. Bellotti, A. Romano, A. Abdolali, P.
Sammarco, L. Franco. 2014. Tsunami Early Warning System Based on Real-time Measurements of Hydro-acoustic Waves. Procedia Engineering 70. pp: 311-320 [3] Hayes, G. P., D. J. Wald, R. L. Johnson. 2012. A
Three-dimensional Model of Global Subduction Zone Geometries. Journal of Geophysical Research. Vol: 117. pp: B01302.
[4] Strusinska-Correia, A. 2017. Tsunami Mitigation in Japan After the 2011 Tohoku Tsunami. International Journal of Disaster Risk Reduction 22. pp: 397-411.
[5] Irsyam, M., S. Widiyantoro, D.H. Natawidjaja, I. Meilano, A. Rudyanto, S. Hidayati, W. Triyoso, N.R. Hanifa, D. Djarwadi, L. Faizal, and Sunarjito. 2017. Peta Sumber dan Bahaya Gempa Indonesia Tahun 2017.
[6] Badan Pusat Statistik. 2018. Kecamatan Kalianda Dalam Angka 2018. BPS Kabupaten Lampung Selatan. ISBN: 978-602-6818-79-9
[7] Rashidi, A., Z. H. Shomali, D. Dutykh, N. K. F. Khah. 2018. Evaluation of Tsunami Wave Energy Generated by Earthquakes in the Makran Subduction Zone. Ocean Engineering 165. pp: 131-139.
[8] Tanioka, Y., and A. R. Gusman. 2018. Near-field Tsunami Inundation Forecast Method Assimilating Ocean Bottom Pressure Data: A Synthetic Test for the 2011 Tohoku-Oki Tsunami. Physics of the Earth and Planetary Interiors 283. pp: 82–91.
1808 Mound Breakwater Using OpenFOAM®. Applied Ocean
Research 72. pp: 76–91.
[10]Anwar, K., M. R. Muskananfola, M. Helmi. 2018. Spatial Analysis of Tsunami Threat Level in The Coastal of Jember Regency, East Java, Indonesia. Asian Journal of Microbiology, Biotechnology, and Environmental Sciences. Vol: 205. Issue: 4. pp: 1153-1162.
[11]Muhammad, A., and K. Goda. 2018. Impact of Earthquake Source Complexity and Land Elevation Data Resolution on Tsunami Hazard Assessment and Fatality Estimation. Computers and Geosciences 112. pp: 83–100.
[12]Hartoko, A., M. Helmi, M. Sukarno, Haryadi. 2016. Spatial Tsunami Wave Modelling for the South Java Coastal Area, Indonesia. International Journal of GEOMATE. Vol: 11. Issue: 25. pp: 2455-2460.
[13]Satriadi, A., M. Helmi, R. Redyansah. 2018. Numerical Modeling of Tsunami in Jember Regency. Asian Journal of Microbiology, Biotechnology, and Environmental Sciences. Vol: 20. Issue: 3. pp: 786-790.
[14]Al’ala, M., S. Syamsidik, T. M. Rasyif, M. Fahmi. 2015. Numerical Simulation of Ujong Seudeun Land Separation Caused by the 2004 Indian Ocean Tsunami, Aceh-Indonesia. Journal of Tsunami Society International. Vol: 34. No: 3. pp: 159-172.
[15]Syamsidik, S., M. Al’ala, H. M. Fritz, M. Fahmi, T. M. Hafli. 2018. Numerical Simulations of the 2004 Indian Ocean Deposits Thicknesses and Emplacements. Natural Hazards and Earth System Sciences. Discuss., https://doi.org/10.5194/nhess-2018-348.
[16]Syamsidik, T. M. Rasyif, S. Kato. 2015. Development of Accurate Tsunami Estimated Times of Arrival for Tsunami-Prone Cities in Aceh, Indonesia. International Journal of Disaster Risk Reduction 14. pp: 403-410.
[17]Helmi, M., A. Satriadi, A. A. D. Suryoputro, J. Marwoto, H. Stiyono, and Hariyadi, 2018, ―Rehabilitation Priority Area Assessment on Death Coral using Cell Based Modeling Approach at Parang Islands, Karimunjawa National Park, Indonesia‖, International Journal of Civil Engineering and Technology (IJCIET), IAEME Publication, Vol. 9, No. 11, pp. 2949–2961.
[18]Fitriyanto, B. R., M. Helmi, and Hadiyanto. 2019. Analyzing spatiotemporal types and patterns of urban growth in watersheds that flow into Jakarta Bay, Indonesia, Remote Sensing Applications: Society and Environment 14 (2019) 170–177
[19]Wang, X. 2009. User Manual for COMCOT Version 1.7 (First Draft). Computer Programs for Tsunami Propagation and Inundation, Cornell University. pp. 26.
[20]United States Geological Survey. 2019. USGS Search Earthquake Catalog. https://earthquake.usgs.gov/. Accesed: April 2nd, 2019.
[21]Wang, X. and Liu, P. L. F. 2007. Numerical Simulations of the 2004 Indian Ocean Tsunamis – Coastal Effects. Journal of Earthquake and Tsunami. Vol: 1. Issue: 3. pp: 273-297. [22]Sinaga, T. P. T., A.Nugroho, Y. W. Lee, and Y. Suh. 2011. GIS
Mapping of Tsunami Vulnerability: Case Study of the Jembrana Regency in Bali, Indonesia. KSCE Journal of Civil Enginering, 15 (3): 537-543.
[23]Zuidam, R.A.V. 1985. Aerial Photo-Interpretation in Terrain Analysis and Geomorphologic Mapping, Smits-Publishers, The Hague Netherland p:442.
[24]Briggs, R.W., D.H. Natawidjaja, J. Galetzka, and Y.J. Hsu. 2006. Deformation and Slip Along the Sunda Megathrust in the
Great 2005 NiasSimeulue Earthquake. Science Vol. 311. pp 1897 - 1901. DOI: 10.1126/science.1122602