1583
Volume 64 176 Number 5, 2016
http://dx.doi.org/10.11118/actaun201664051583
OCCURRENCE OF EROSION-EFFECTIVE
RAIN IN THE BRNO AREA
Silvie Kozlovská
1, František Toman
11 Department of Applied and Landscape Ecology, Faculty of AgriSciences, Mendel University in Brno, Zemědělská 1,
613 00 Brno, Czech Republic
Abstract
KOZLOVSKÁ SILVIE, TOMAN FRANTIŠEK. 2016. Occurrence of Erosion-Effective Rain in the Brno Area. Acta Universitatis Agriculturae et Silviculturae Mendelianae Brunensis, 64(5): 1583–1591.
Due to the growing awareness of the extent of degradation of agricultural soils as a result of water erosion, increased attention is paid to the establishing of effective erosion control measures based on reliable and timely input data. When determining the vulnerability of farmland to water erosion, the determining factor is erosively dangerous rains, which are defined as totals over 12.5 mm and intensities of more than 24 mm.h-1. This paper analyses the dangerous erosion rainfalls using data
on rainfall intensities of precipitation monitoring network of the company Brněnské vodovody a kanalizace, a.s. (BVK) in the city of Brno. At first, we have set up 14 rain gauge stations distributed over an area of approximately 105 km2 and set basic indicators of individual rainfall episodes. Then
we have analysed their maximum 30-minute intensity, kinetic energy and then determined the factor of erosion efficiency. We have found out a significant spatial variability of these variables throughout the area of the city of Brno. The R-factor analysis revealed that the average annual values of R-factor were the highest in the south-eastern part of the city of Brno while the least dangerous erosion rainfalls occurred in the west.
Keywords: Rainfall erosivity factor (R-factor), rainfall intensity, water erosion, kinetic energy of rain, dangerous erosion rainfall, rain gauge stations, universal soil loss equation, regionalization of R-factor, rainfall-runoff erosivity factor, rainfall intensity.
INTRODUCTION
In the Czech Republic, over 50 percent of agricultural land is potentially threatened by water erosion, of which 18 percent are under an extreme threat. Currently, the maximum loss of soil in the Czech Republic is calculated to be approximately 21 million tonnes of topsoil per year, which translates into economic loss of at least CZK 4.3 billion (Podhrázská, 2014).
Current state of degradation processes of agricultural land caused by water and wind erosion, and a possible proposal for erosion control measures are assessed by calculating the average long-term loss of soil and its comparison with the acceptable value of soil loss (Dumbrovský, 2004). For the calculation of the average long-term loss of soil by water erosion in the Czech Republic we use the widely used universal soil loss equation (USLE) according to Wischmeier and Smith (1978). This equation calculates the loss due to erosion as
the product of six factors, one of which is the factor of rain erosion efficiency or rainfall erosivity factor.
The relationship for the rainfall erosion R-factor was derived in the USA based on large amounts of data on rainfall totals. It showed that when all other USLE factors are constant, then the loss of soil on cultivated land is directly proportional to the product of the total kinetic energy of torrential rain and its maximum 30-minute intensity. Wischmeier and Smith (1978), based on years of observation rains in the USA, refuted the generally accepted theory that erosion is caused only by very heavy torrential rains that occur rarely, but proved that erosion is also caused by rain of moderate intensity.
of less than 12.5 mm are not considered, exception are those for which in 15 minutes rained more than 6.25 mm.
According to the methodology of Janeček et al. (2012 a), used in the Czech Republic, rains with totals of less than 12.5 mm and intensity of less than 6.25 mm in 15 minutes are not considered. Toman (1996) considered dangerous erosion rains to have intensities of more than 20 mm.h-1 and with
spreading rate over 10 mm.
Janeček et al. (2006, 2012 b) verified the value of the R-factor in the Czech Republic. Based on this research methodology, Janeček et al. (2012 a), in the paper titled Ochrana zemědělské půdy před erozí (Protection of Agricultural Land from Erosion), recommended for the Czech Republic to use the average value of rainfall erosivity factor to be 40 MJ.ha-1.cm.h-1. However, until April 2012,
the average annual value of the R-factor used was 20 MJ.ha-1.cm.h-1 (Janeček et al.2007).
The values of the R-factor in other countries are highly variable. For example, Wischmeier and Smith produced an isoerodent map for the USA, where the values of the R-factor range from about 17 to 1,000 MJ.ha-1.cm.h-1. In the Mediterranean
area in Italy, the R-factor ranges from 47 to 321 MJ. ha-1.cm.h-1 (Diodato, 2004). For selected stations in
Slovakia, Maderková (2011) calculated the R-factor as ranging from 27 to 90 MJ.ha-1.cm.h-1. However for
practical experience in Slovakia, the map used for regionalized R-factor has lower values ranging from 5 to 27.5 MJ.ha-1.cm.h-1. These low values, derived
from calculations carried out in 1992, probably used the same procedure as those by Janeček et al.(1983, 1992) in the Czech Republic.
Panagos et al.(2015) produced the most recent regionalization of R-factor for almost the entire territory of Europe, where the average R-factor for the Czech Republic is 52 MJ.ha-1.cm.h-1 and
ranges from 22 to 109 MJ.ha-1.cm.h-1. The authors
worked with data on rainfall intensities from 32 stations in the Czech Republic from 1961 to 1999. They consider their results to be suitable for use in modelling of soil erosion in European and country-wide scale. For regional and local use, they recommend individual calculations using local data.
The aim of this study was to develop a relatively unique set of ombrographic records from 14 rain gauge stations in the city of Brno. The entire network is deployed on a relatively small total surface area of about 105 km2. This gave us a unique opportunity
to compare data from points only several kilometres apart. This contrasts with the conventional network of stations of the Czech Hydrometeorological Institute (CHMI), which are sometimes tens of kilometres apart. Prax et al.(2010) report the average distance between stations of the CHMI to be 7 km, while the stations of the Brno Waterworks and Sewerage System (BWSS) are spaced on average 2.2 km apart. Such a dense network of data points could provide new insights into the problems of erosivity of rains and their spatial distribution.
MATERIALS AND METHODS
Source Data
For our calculations, we have used data on individual rainfall intensities from the rain gauge network of BVK. We have chosen 14 automated rain gauge stations (Table I), with altitudes ranging between 195 and 353 metres above sea level. The average minimum distance between stations was 2.2 kilometres on an area of about 105 km2. This
is about four times less than the standard rain gauge station distances in the network of the Czech Hydrometeorological Institute. Currently, this is the densest network of meteorological stations operating in urban areas in the Czech Republic. For the purposes of this study, the BVK provided us with a record of rainfall intensities at 5-minute intervals from 2003 to 2012, or 10 years of continuous measurements. The provider carried out quality control and homogenization of data, using methods described by Hellebrand (2011). For our study, we have taken into account only rains that took place during the growing season from April to October. Figure 3 in the chapter on Results shows the placement of the stations.
Analysis
For the calculation procedure, we have applied methodology by Janeček et al.(2012 a), which is based on universal equation for calculating the long-term loss of soil by erosion by Wischmeier and Smith, (1978). The indicator characterizing erosivity of rainfall in a given area is called the rainfall erosivity factor or R-factor, which is
I: Used stations of the BVK precipitation network
Station Placement
Altitude Metres above Sea
Level 01RE VDJ (water tank) at Řečkovice 319 02PA VDJ Palackého vrch at Žabovřesky 291
03LE VDJ at Lesná 328
04PI BWS at Pisárky 214
05VS Vsetínská – exchanger at Štýřice 216 06BO ZŠ Bosonožská at Starý Lískovec 230 07KH VDJ Kraví hora at Veveří 276 08MZ MENDELU at Černá pole 230 09EL MŠ El. Krásnohorské at Černovice 200
10LI VDJ at Líšeň 353
11JU ZŠ at Juliánov 256
12SL Wombat at Slatina 250
13MO VDJ at Moravany 256
determined by the maximum 30-minute rainfall intensity and its kinetic energy. The input values are the so-called erosively dangerous or torrential rains, which according to Janeček et al.(2012 a) are rains with total amount of at least 12.5 mm while their intensity exceeds 6.25 mm in 15 minutes. A separate rainfall episode is rain separated from other rains by a period longer than six hours.
The R-factor was calculated in two variants: • Variant A - all rainfall episodes with totals over 12.5 mm,
and with an intensity greater than 6.25 mm in 15 minutes, according to Janeček et al.(2012), without reducing the values
• Variant B - rainfall episodes with totals over 12.5 mm, and with an intensity greater than 6.25 mm in 15 minutes, disregarding one minimum and one maximum value, modified from Janeček et al. (2012)
Variant B was created in order to approach the methodology of Janeček et al. (2012 a, b), who when calculating the average R disregarded two highest and two lowest values, to exclude extreme rains with very low periodicity of repetitions. However, since they worked with a longer series of observations than is available for our research (at least double), we have analysed the stations by disregarding only two values instead of four.
The R-factor of an individual rain is determined using the following formulas (Wischmeier and Smith, 1978):
R = E ∙ i30/100 (1)
Where
R – Rainfall erosivity factor [MJ.ha-1.cm.h-1],
E – Total kinetic energy of rain [J.m-2],
I30 – Maximum 30-minute rain intensity [cm.h-1].
The total kinetic energy of rain E is:
E Ei i n = =
∑
1 (2) WhereEi – Kinetic energy of the i-th interval of rain [J.m-2],
n – Number of rain intervals.
Ei = (206 + 87 log isi) ∙ Hsi (3)
Where
isi – Rain intensity of i-th interval [cm.h-1],
Hsi – Total rainfall in the i-th interval [cm].
If the rain lasts less than 30 minutes, then I30 is
twice the total precipitation. Regarding the kinetic energy of raindrops, it was experimentally demonstrated that it does not exceed 283 J.m -2. It
means that from intensity of about 7.6 cm.hour -1,
the value of the kinetic energy does not increase, which was reflected in the calculations.
The annual value of R-factor is determined from long-term rainfall records and represents the total of erosion efficiencies (erosivities) of individual torrential rains that occurred in a given year. However, we must emphasize that the average
annual value of the R-factor in the Czech Republic is essentially the value for the vegetation period from April to October. This is because erosively dangerous rains occur, with some exceptions, almost exclusively in this period. Due to the availability of ombrographic records, this study processed only rains from the growing season.
The output of the analysis includes comparison of the variability of R-factor within the study area, the distribution of R-factor during the growing season, comparisons of R-factors of each year at selected stations or comparison of alternative values of R-factors.
RESULTS
For the purposes of this study, we have analysed all rains in 14 rainfall stations in Brno. Among them, we have selected rains, whose totals were higher than 12.5 mm, and were separated by rain breaks of at least six hours. There were 125 such rains during the growing season in 10 years. Among them, 67 episodes occurring in each case at least at one station further met the requirement for erosively dangerous rain, which means that in 15 minutes rained at least 6.25 mm. The number of stations that satisfied the conditions for erosivity ranged from 1 to 14. However, it is surprising that despite the small distances between stations, in 10 years, only 5 erosively dangerous rains occurred in all stations simultaneously. That was the first clue about the high spatial variability of torrential rains in the territory of Brno and a strong local nature of the rainfall.
Table II shows the basic characteristics of erosively dangerous rains. In one year, there were on average 2.4 erosively dangerous rains, but in a decade, the counts among stations range between 17 and 30 occurrences. Interestingly, the annual average number of erosively dangerous rains coincided exactly with the values calculated from 31 stations throughout the Czech Republic, which had much longer series of rainfall data (Janeček et al., 2012 b).
It was followed by calculation of the maximum 30-minute intensities, kinetic energy of all erosively dangerous rains, and the rainfall erosivity factor R (Table III). The average value of a maximum 30-minute intensity of one erosively dangerous rain throughout the Brno area is 3.4 cm.hour-1, ranging
between 3.0 cm.hour-1 and 4.2 cm.hour-1. When
comparing the maximum 30-minute intensities achieved at individual stations, we can again observe large fluctuations, ranging from 5.9 cm.hour-1 in
Řečkovice (01RE) to 9.4 cm.hour-1 at Bosonožská
Street (06BO) at Starý Lískovec.
From the total rain for the duration of 30 minutes, we can determine its frequency of repetition according to Trupl (1958). Table IV lists the totals in centimetres per 30 minutes (compared to half the value of I30 in Table III) and the corresponding
II: Characteristics of erosively dangerous rains (EDR) in monitored stations from 2003 to 2012
Station Ø Rainfall Total of EDR [mm]
Number of EDRs
Total Ø/year Min/year Max/year
01RE 20.6 21 2.1 1 5
02PA 24.5 17 1.7 0 4
03LE 27.5 24 2.4 1 6
04PI 26.8 24 2.4 0 5
05VS 30.1 26 2.6 1 5
06BO 29.1 24 2.4 0 5
07KH 28.2 26 2.6 0 5
08MZ 30.0 24 2.4 0 6
09EL 38.4 30 3 1 6
10LI 34.3 24 2.4 1 6
11JU 34.2 21 2.1 0 6
12SL 33.0 28 2.8 0 5
13MO 27.6 24 2.4 0 5
14KR 37.6 29 2.9 1 7
Ø Brno 30.1 24.4 2.4
III: The values of the rainfall erosivity factor R and related variables at monitored stations between 2003 and 2012
Station
I30 [cm.hour-1]
Ø E [J.m-2]
R-factor
Variant A Modified R-factor Variant B
Ø Max Ø/
Year
Ø/
Rainfall R Min R Max Ø/ Year
Ø/
Rainfall R Min R Max 01RE 3.0 5.9 497 34.3 16.4 5.3 63.4 27.5 14.5 6.8 38.8
02PA 3.0 8.5 578 36.5 21.4 5.7 123.3 23.6 15.7 5.9 40.1
03LE 3.1 6.9 642 58.5 24.4 4.7 105.0 47.6 21.6 4.9 67.1
04PI 3.2 8.0 628 57.1 23.8 5.3 104.1 46.2 21.0 6.4 87.6
05VS 3.6 9.3 718 84.3 32.4 5.6 200.8 63.7 26.5 5.6 84.6
06BO 3.4 9.4 616 67.4 28.1 5.7 214.5 45.4 20.6 6.0 72.4
07KH 3.0 7.5 560 52.3 20.1 5.2 94.9 42.3 17.6 5.8 65.2
08MZ 3.6 6.3 647 65.8 27.4 4.9 104.9 54.8 24.9 5.1 69.2
09EL 3.9 8.6 770 109.9 36.6 5.2 125.9 96.8 34.6 6.2 120.3
10LI 3.7 9.3 697 75.0 31.2 6.1 147.5 59.6 27.1 7.6 104.0
11JU 3.9 8.7 731 69.7 33.2 6.3 141.1 54.9 28.9 6.8 70.3
12SL 3.4 8.9 626 69.5 24.8 7.5 144.3 54.3 20.9 7.6 69.3
13MO 3.4 7.2 668 62.1 25.9 6.4 146.4 46.8 21.3 7.1 56.7
14KR 4.2 8.2 794 113.2 39.0 6.3 139.3 98.6 36.5 7.1 133.5
Ø Brno 3.4 8.1 655.2 68.3 27.5 5.7 132.5 54.4 23.7 6.3 77.1
IV: Repetition of frequency of 30-minute rains according to Trupl (1958) for the Brno station, extrapolation according Hellebrand (2011)
Total sum of 30-minute rainfalls at periodicity p EXTRAPOLATION
p 5 2 1 0.5 0.2 0.1 0.04 0.02 0.01
The rains of highest intensity during the studied decade occurred most often at stations 14KR times (Brno-South) and 09EL (Černovice). In contrast, rains with the lowest intensity usually occurred at stations 01RE (Řečkovice) and also at 02PA (Žabovřesky), although in 2009, the latter station received a 100-year torrential rain.
During the 10-year period, each station experienced at least one rain with periodicity of p = 0.05 / year (once in 20 years). At nine stations, the value of the so-called 100-year rain was exceeded (p = 0.01; I30 ≥ 7.7 cm.h-1), at the 14KR and
09EL stations even repeatedly. The most common 100-year rain occurred (seven stations) in 2009 and at four stations also in 2008.
Final analysis consisted of determining and comparing the R-factor of rainfall erosivity (Wischmeier and Smith, 1978) with adjusted R-factor with the exclusion of extreme values (maxima and minima, adapted from Janeček et al., 2012 a). The average R-factor for Brno is 68 MJ.ha-1.cm.h-1. After removing the highest and
lowest values in the calculation, adjusted R-factor is 54 MJ.ha-1.cm.h-1. Even after the elimination
of extreme values, the R-factor is higher by 15 MJ.ha-1.cm.h-1 compared with the recommended
standard of 40-MJ.ha-1 .cm.h-1. Other variables (E,
I30) in Table III are included for all EDRs, thus
without the considered reduction. Figure 1 shows a graphical comparison of differences between
adjusted and unadjusted R-factors, where we may observe significant effects of extreme precipitation that is rains exceeding the 100-year rain. The biggest difference between R and modified R is at 05VS and 06BO stations.
Distribution of the R-factor by months in Brno (average for all stations) has a different course than the national average. Absolutely most of EDRs (47 percent) occur in July and a higher proportion of EDRs occurs also in June (Table V). In other months, the incidence of these rains is an exception. In contrast, the recommended breakdown by Janeček (2012 a), which is an average of 31 stations from across the country and calculated by Kubátová et al. (2009), is more balanced for the summer months and also more evident in September.
Figure 2 illustrates large differences in annual values of R-factor at individual stations. For two selected stations – the values of R-factor are shown for individual years. The 01RE in Řečkovice has the lowest average R-factor, while the 14KR in the south of Brno has the highest average R-factor. These stations are separated by a distance of 11 km.
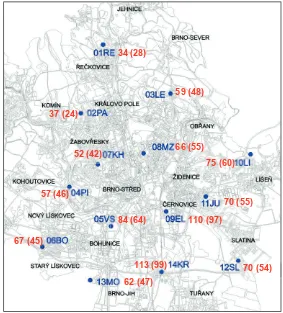
Regarding the spatial distribution of torrential rains, in the long run, the most intense rainfall occurs in the south-eastern part of Brno. In contrast, rainfall tends to be less intense to the west of Brno, which is also confirmed by Prax et al.(2010). That is also consistent with higher R-factor value in this part of town (see Figure 3).
0 20 40 60 80 100 120
R
-fa
ct
or R-factor
adjusted R-factor Ø Brno R-factor Ø Brno R-factor adj.
1: Comparison of original and the revised R-factors at stations between 2003 and 2012.
V: Average distribution of R-factor in months of growing season for the Czech Republic (according Kubátová et al, 2009) and for Brno
Month APR MAY JUN JUL AUG SEP OCT
R-factor Czech Rep. [%] (Kubátová et al., 2009) 0.9 10.9 22.3 29.9 25.8 8.3 1.7
R-factor Brno [%] 0.3 8.2 29.1 47.1 15.2 0.1 0.0
0 50 100 150 200 250 300
2003 2004 2005 2006 2007 2008 2009 2010 2011 2012
R
-f
ac
tor
01RE
14KR
2: Comparison of R-factors in different years at two stations - 01RE a 14KR
Figure 3: Map of R-factor distribution in Brno with stations
Explanation: Station names are shown in blue. Next to the station name is unadjusted R-factor
in red, in brackets adjusted R-factor with omitted highest and lowest values.
34 (28)
37 (24)
59 (48)
52 (42) 66 (55)
75 (60)
70 (55) 110 (97) 84 (64)
67 (45)
62 (47)
113 (99) 70 (54)
57 (46)
3: Map of R-factor distribution in Brno with stations
DISCUSSION
This study took advantage of a unique opportunity to compare data from points situated only a few kilometres apart. Such a dense network of data provides new insights not only from the perspective of the basic processing of rainfall intensities, but also in other areas of applied research. These include studied problems in erosive rains and their spatial distribution.
The reliability of the calculated R-factor is certainly questionable due to the relatively short period of time (2003 to 2012). The aim of our study was not the accurate determination of R-factor, but its comparison among nearby stations within the network. The minimum period which could be considered as reasonable, is 20 years, as evidenced by Wischmeier and Smith (1978) and Janeček et al. (2012 b). Reduction of the minimum and maximum values was based on the same reasoning as applied by Janeček et al.(2012 a, b). It is an attempt to limit the infl uence of the greatest extremes with a very low repetition time, which can overestimate the average value of the R-factor. However, it should be noted that this way of data editing is disregarded by Wischmeier and Smith (1978) and other authors, except Janeček et al. (2012 a, b).
The R-factor analysis for the Brno region suggests that the average annual values of the R-factor were the highest in the south-eastern part of Brno at Horní Heršpice, Černovická terasa, and Slatina. The lowest EDR values occurred in the west, in the districts of Královo Pole, Řečkovice, and Žabovřesky. Secondary maximum occurred to the east and northeast of Brno at Líšeň and Lesná. These results are consistent with the fi ndings by Prax, et al.(2010), who analysed the rainfall intensities in the Brno area. However, other analyses, such as by Dobrovolný et al.(2012), suggested that the distribution of the average total sums of annual and seasonal precipitation around Brno is nearly opposite of the maximum rainfall intensities and R-factor. Thus the highest totals have been long observed in the north-western part of Brno. This spatial variability can have multiple reasons. The infl uence of the city was not clearly demonstrated. Other important factors are also natural factors, including altitude and exposure of stations to the prevailing winds.
Janeček et al.(2012 a) developed a regionalization map of the R-factor in the Czech Republic. However, they state that due to problems of methodological and fundamental character that accompany the determination of R-factor as described by Janeček et al.(2012 b), it does not seem advisable to regionalise the R-factor in the Czech Republic. The authors thus recommend the use of the USLE for an absolute majority of farmland area in the Czech Republic with the average value of the R-factor of 40 MJ.ha-1.cm.h -1. For the Brno area, the average value of the R-factor
was calculated as 68 MJ.ha-1 .cm.h-1. When adjusted, by
removing the highest and lowest values of the R-factor, it decreased to 54 MJ.ha-1.cm.h-1, which is not a good
match with the average value for the Czech Republic.
The studied period of ten years, between 2003 and 2012, was relatively rich in torrential rain.
We can thus conclude that the calculated values of R-factor are overestimated. So, if it were possible to track back a longer time horizon, the value of the R-factor would be lower. Nevertheless, future development of weather cannot be predicted. However, predictions of climate change suggest lengthening of dry periods with extreme storm episodes (as predicted by Němec and Kopp, 2009). This trend can be already observed in certain areas, as reported by Doleželová, (2013) for the Brno area. For these reasons, it seems preferable not to use a fi xed value of R-factor in the future for the whole country. It would be better to try to adapt to the changed climate conditions, which can develop very diff erently in each region. The addition to this consideration the knowledge that the spatial variability of the R-factor in some areas is very high, leads again to an increased need for a more accurate regional R-factor. The Brno area probably belongs, due to diverse orography, to the extreme cases. Another issue to consider for further empirical research is the method of determining the R-factor. In other words how to cut out or not cut out the greatest extremes, if there is an expected trend of increased frequency of their occurrence.
The carried out analyses suggest that even the division of EDRs into months during the growing season in the study area (they are practically absent in winter) showed big diff erence from the recommended nationwide distribution. When calculating anti-erosion measures in the Brno area, the universal distribution is inadequate as it may produce biased results.
From the above discussed high temporal and spatial variability in the distribution and occurrence of torrential rains and the associated R-factor on a relatively small area of Brno and matters relating to the methodological approach to determine the R-factor we can conclude that:
a) Regionalization of the R-factor is a very demanding task especially in terms of available data on rainfall intensities and other methodological requirements, see Janeček et al. (2012 b);
b) The use of universal values 40 MJ.ha-1.cm.h-1
is due to the variability of the orographic and climatic conditions of the Czech Republic not the ideal solution. A reliably calculated R-factor should be used, at least in areas where it is available;
c) If data are available, distribution of R-factor into individual months of growing season should be also verifi ed. However, the results may diff er signifi cantly from the recommended standard methodology in accordance with Janeček et al. (2012 a);
CONCLUSION
The subject of assessing water erosion in the Czech Republic has in recent years received an increased attention. Ample fundamental research led to a gradual upgrade of methodologies for calculating erosion and proposed anti-erosion measures. The rainfall erosivity factor R has been revised for the Czech Republic from 20 MJ.ha-1.cm.h-1 to 40 MJ.ha-1.cm.h-1 (Janeček et al., 2012 a).
An important contribution to these activities should be research on the regional distribution of the R-factor on the territory of Brno, carried out in this study. The decisive aspects in determining the R-factor are dangerous erosive or torrential rains, which are defined as the total rain of 12.5 mm with intensities higher than 24 mm.h-1. This paper analyses torrential rains using data on rainfall intensities
from the precipitation measuring network of the company Brněnské vodovody a kanalizace, a.s (BVK) in the city of Brno. At first, we have set up 14 rain gauge stations distributed over an area of approximately 105 km2 and set basic indicators of individual rainfall episodes. Then we have analysed
their maximum 30-minute intensities, kinetic energy and then determined the factor of rainfall erosivity.
This research is unique for its large concentration of rainfall data in a small area. It could thus show an unexpectedly high spatial variability of the distribution of R-factor values, suggesting that the use of the uniform recommended values of R-factor for the whole country is not appropriate. Attention should therefore be directed towards gradual regionalization of the R-factor and its implementation. If data are available, distribution of R-factor into individual months of growing season should be also verified. However, the results may differ significantly from the recommended standard methodology according to Janeček et al. (2012 a).
The R-factor analysis for the Brno region suggests that the average annual values of the R-factor were the highest in the south-eastern part of Brno at Horní Heršpice, Černovická terasa, and Slatina. The lowest EDR values occurred in the west, in the districts of Královo Pole, Řečkovice, and Žabovřesky. For the Brno area, the average value of the R-factor was calculated as 68 MJ.ha-1.cm.h-1. When adjusted,
by removing the highest and lowest values of the R-factor, it decreased to 54 MJ.ha-1.cm.h-1, which is
not a good match with the average value for the Czech Republic. The calculation cannot be considered relevant, given the short time series of used data (2003 to 2012). The aim of our study was not the accurate determination of R-factor, but its comparison among nearby stations within the network.
Acknowledgements
This paper was supported by the Technology Agency of the Czech Republic [no. 2014TA04020886: “New technology solutions for protection against flooding from heavy rainfall.”].
REFERENCES
DIODATO, N. 2004. Estimating RUSLE’s rainfall factor in the part of Italy with a Mediterranean rainfall regime. Hydrology and Earth System Sciences, 8(1): 103 – 107.
DOBROVOLNÝ, P. et al. 2012. Klima Brna. Víceúrovňová analýza městského klimatu. Brno: Masarykova univerzita.
DOLEŽELOVÁ, M. 2013. Srážkové poměry města Brna. Unpublished thesis. Brno: Masarykova univerzita, Přírodovědecká fakulta. Thesis advisor prof. RNDr. Rudolf Brázdil, DrSc.
DUMBROVSKÝ, M. 2004. Pozemkové úpravy. Brno: CERM.
HELLEBRAND, R. 2011. Srážko-odtokové scénáře pro návrh městského odvodnění. Unpublished thesis. Brno: Vysoké učení technické v Brně, Fakulta stavební, Ústav vodního hospodářství obcí. Thesis advisor Ing. Petr Prax, PhD.
JANEČEK, M., PASÁK, V. and ŠABATA, M. 1983. Ochrana zemědělské půdy před erozí. Praha: Ústav vědeckotechnických informací pro zemědělství. JANEČEK, M. et al. 1992. Ochrana půdy před erozí.
Praha: ÚVTIZ.
JANEČEK, M., KUBÁTOVÁ, E. and TIPPL, M. 2006. Revised Determination of the Rainfall-Runoff Erosivity Factor R for Application of USLE in the Czech Republic. Soil & Water Research. 1(2): 65 – 71. JANEČEK, M. et al. 2007. Ochrana zemědělské půdy před
erozí. Metodika. 1st edition. Praha: VÚMOP.
JANEČEK, M. et al. 2012a. Ochrana zemědělské půdy před erozí. Metodika. Praha: ČZU.
JANEČEK M., KVĚTOŇ, V., KUBÁTOVÁ, E. and KOBZOVÁ, D. 2012b. Differentiation and Regionalization of Rainfall Erosivity Factor Values in the Czech Republic. Soil & Water Research. 7(1): 1 – 9.
KUBÁTOVÁ E., JANEČEK, M. and KOBZOVÁ, D. 2009. Time Variations of Rainfall Erosivity Factor in the Czech Republic. Soil & Water Research, 4(4): 131 – 141.
MADERKOVÁ, L. 2011. Výpočet charakteristík erózne účinných dažďov pre územie Slovenska. Unpublished thesis. Nitra: Slovenská poľnohospodárska univerzita, Fakulta záhradníctva a krajinného inžinierstva.
PANAGOS, P., BALLABIO, C., BORRELLI, P., MEUSBURGER, K., KLIK, A., ROUSSEVA, S., TADIĆ, M. P., MICHAELIDES, S., HRABALÍKOVÁ, M., OLSEN P., AALTO, J., LAKATOS, M., RYMSZEWICZ, A., DUMITRESCU, A., BEGUERÍA, S., and ALEWELL, C. 2015. Rainfall erosivity in Europe. Science of the Total Environment, 511: 801 – 814. DOI: 10.1016/j. scitotenv.2015.01.008.
PODHRÁZSKÁ, J. 2014. Degradace půdy erozí v podmínkách jižní Moravy. In: ROŽNOVSKÝ, J., LITSCHMANN, T., STŘEDA, T., STŘEDOVÁ, H., (eds). Extrémy oběhu vody v krajině. Mikulov, 8 to 9 April 2014.
PRAX, P., ROŽNOVSKÝ, J. and PALÁT, M. 2010. Měření, validace a analýza dlouhodobých dešťových řad v městském odvodnění. Brno: VUTIUM.
STŘEDOVÁ, H., KRÁSA, J., ŠTĚPÁNEK, P. and NOVOTNÝ, I. 2014. Comparison of two methods of erosive rains determination. Contributions to Geophysics and Geodesy, 44(3): 253 – 269.
STŘEDOVÁ H., ŠTĚPÁNEK, P., NOVOTNÝ, I. and KRÁSA, J. 2014. Stanovení R faktoru na jižní Moravě. In: ROŽNOVSKÝ, J., LITSCHMANN, T., STŘEDA, T., STŘEDOVÁ, H. Extrémy oběhu vody v krajině. Praha: ČHMÚ.
TOMAN, F. 1996. Vliv četnosti výskytu vyšších denních srážkových úhrnů na vodní erozi. Rostlinná výroba, 42(8): 371 – 373.
TRUPL, J. Intenzity krátkodobých dešťů v povodích Labe, Odry a Moravy. Praha: VÚV Praha.
WISCHMEIER, W. H. and SMITH, D. D. 1978. Predicting rainfall erosion losses – a guide to conservation planning. Agriculture Handbook N° 537. Washington DC: U.S. Department of Agriculture.