Licensed under Creative Common Page 58
http://ijecm.co.uk/
ISSN 2348 0386
THE RELATIONSHIP BETWEEN PROACTIVENESS AND
PERFORMANCE OF SMALL AND MEDIUM AGRO
PROCESSING ENTERPRISES IN KENYA
Angeline Wambui Wambugu
Jomo Kenyatta University of Agriculture and Technology, Kenya
Robert Gichira
Jomo Kenyatta University of Agriculture and Technology, Kenya
Kenneth N. Wanjau
Karatina University, Kenya
Joseph Mung’atu
Jomo Kenyatta University of Agriculture and Technology, Kenya
Abstract
Objective of this paper was to establish the influence of proactiveness on the firm performance
of agro processing small and medium enterprises in Kenya. Data was gathered from 111 agro
processing SMEs who were registered members of Kenya Association of Manufacturers.
Structural Equation Modeling partial least squares (PLS) approach using PLS algorithms and
bootstrapping algorithms in Smart PLS 2.0 was used. Data analysis was conducted in two
phases, measurement outer model estimation and structural, inner model estimation. The
Licensed under Creative Common Page 59
processing SMEs in Kenya. The implications of these findings for managerial practice and
suggestions for further research are discussed.
Keywords: Entrepreneurship, Entrepreneurial Orientation, Proactiveness, Firm Performance,
Agro Processing SMEs, Kenya
INTRODUCTION
In many developing countries, small and medium enterprises (SMEs) constitute the bulk of
industrial base (Kormawa, Wohlmuth & Devlin, 2011). SMEs play an increasingly important role
as they address poverty by creating jobs; disperse economic activities in the countryside, and
provide broad-based sources of growth (Singh, Garg & Deshmukh, 2008; Kropp, Lindsay &
Shoham, 2006). Agro processing SMEs, in particular, contribute significantly to value added
creation, maximize the efficiency of the resource allocation and enhance distribution by
mobilizing and utilizing local human and material resources (Cunningham & Rowley 2007).
Despite their importance, agro processing SMEs are faced by global competition, market
liberalization, rapid technological advances and the introduction of stricter quality and safety
regulations which affects their competitive (Da silva, Baker, Shepherd, Jenane & Miranda da
Cruz, 2009). There is need to identify factors that affect the firm performance of agro processing
SMEs.
Research has shown that today’s dynamic environment requires SMEs to be
entrepreneurial if they are to survive, grow and have superior performance (Fairoz, Hirobumi &
Tanaka, 2010). Successful firm performance of agro processing SMEs requires that they are
innovative, creative, proactive and have a risk taking behavior. According to Wiklund and
Shepherd, 2003; Lumpkin and Dess, 1996; and Patel & D’Souza, 2012, firm - level
entrepreneurship is key to enhancement of firm performance of small firms. Empirical studies
done in developed and transition economies suggest that proactiveness as a firm - level
strategy constitutes a potential source of competitive advantage and has positive, long-term
effect on growth and financial performance of SMEs (Covin & Slevin, 1991; Yang, 2008;
Wiklund, 1999).
Statement of the Problem
In the period 2008 – 2012, the agro processing industries in Kenya experienced low firm
performance. In 2012, the food and beverage, which is the largest component in the agro
processing manufacturing sector, registered a 0.3 per cent decline after experiencing a 1.6 per
Licensed under Creative Common Page 60 preservation of fish, processed liquid milk, production of bakery products, processed and
preserved fruits and vegetables registered a drop by 10.4, 13.7, 14.9 and 2.5 per cent,
respectively during the said period (ROK, 2013). Furthermore, the workforce in these agro
processing industries reduced by approximately 2 per cent (ROK, 2012). During the same
period, the average growth percentage remained stagnant at 3 to 4 per cent. This growth rate is
low given that the Kenya Vision 2030 expects that agro processing industries to grow at a rate
of 10 per cent annually (ROK, 2007).
If allowed to continue, low firm performance of agro processing SMEs will lead to
dominance by primary agro-based commodities, thereby increasing the country’s vulnerability to
international market price fluctuations (Onjala, 2010; Wilkinson & Rocha, 2009). It will also lead
to low incomes for those employed in agro processing SMEs with correspondingly low
standards of living. This will threaten the long term survival of these enterprises and will lead to
closure despite the fact that the agricultural products are grown in Kenya (Kormawa, Wohlmuth
& Devlin, 2011). SMEs need dynamic capabilities such as proactiveness that will enable them to
enhance their competitive advantage and productivity in the long term. A few researches of
entrepreneurial orientation in SMEs have been conducted in Kenya have centered on overall
entrepreneurial orientation and how it affects firm performance, rather than the individual and
independent influence of entrepreneurial orientation dimensions such as proactiveness and its
influence on firm performance on SMEs. Osoro (2012) examined the effect of entrepreneurial
orientation of the business performance of SMEs in the Information Technology in Nairobi. The
study failed to identify the influence of proactiveness dimension of entrepreneurial orientation on
firm performance of small and medium enterprises. This paper seeks to fill that gap by
establishing the influence of proactiveness on firm performance of agro processing SMEs in
Kenya.
LITERATURE REVIEW
Proactiveness
Lumpkin and Dess (1996) suggest that entrepreneurial behavior of firms is supported by five
processes within an organization, which they call entrepreneurial orientation. In their framework,
entrepreneurial orientation consists of five factors namely autonomy, innovativeness, risk taking,
proactiveness and competitiveness. Entrepreneurial orientation as a firm level strategy is used
by entrepreneurial firms to enact their organizational purpose, sustain their vision and create
competitive advantage (Wiklund & Shepherd, 2005). Proactiveness is a firm’s strategic
orientation that captures specific entrepreneurial aspects of decision-making styles, methods
Licensed under Creative Common Page 61 seeking new opportunities which may or may not be related to the present line of operations
which enables introduction of new products and brands ahead of competition (Okpara, 2009).
Proactiveness involves attempts to discover future opportunities, even when these opportunities
may be somewhat unrelated to existing operations (Venkatraman, 1989; Rauch, Wiklund &
Frese, 2004). Proactiveness is achievement oriented, emphasizing initiatives taking,
anticipating, creating change, and predicting evolution towards a critical situation and early
preparation prior to the occurrence of an impeding uncertainty of risk (Boohene, Marfo – Yiadom
& Yeboah, 2012). Proactiveness as a dimension of entrepreneurial orientation is an
opportunity-seeking and forward-looking perspective that involves acting in anticipation of future demand
and trends, and thereafter capitalizing on these opportunities to gain benefit (Kropp, Lindsay &
Shoham, 2008). A strong proactive behavior gives SMEs the ability to anticipate needs in the
market place and the capability to anticipate competitor’s needs (Covin & Slevin, 1989; Miller &
Friesen, 1983; Eggers, Kraus, Hughes, Laraway & Snycerski, 2013).
Firm Performance
In the field of strategic entrepreneurship, firm performance has been considered as an important
construct. There has been no agreement, however, among researchers on the appropriate
measure of performance for small firms. Murphy, Trailer and Hill (1996) and Wiklund (1999)
have suggested that growth and financial measures are important performance measures for
small enterprises whereby growth focuses on the increase in sales, employees or market share
while financial measures are account-based measures such as return on investment, return on
equity, return on sales and net profit margin (Haber & Reichel, 2005).
Research has shown that growth measures are more accurate and easily available than
account-based measures. On the other hand, financial measures are considered critical in
determining the survival and success of the firm ( Zainol & Ayadurai, 2011). Financial
measures, however, are considered unstable, sensitive to changing industry-related factors,
myopic and not sufficient to capture overall firm performance (Aggarwal & Gupta, 2006).
Furthermore, these measures are easily manipulated and hence do not reflect the real
performance (Al-Swidi & Al-Hosam, 2012). A heavy reliance on financial measures could also
hinder future competitive advantage as they do not reflect drivers of future performance and
value creation (Keh, Nguyen & Ng, 2007). Wiklund and Shepherd (2005) propose a combination
of both growth and financial performance measures in comparison with competitors. Research
has shown that combining both growth and financial measures give a richer description of the
actual performance of the firm than each does separately (Lumpkin & Dess, 1996; Wiklund &
Licensed under Creative Common Page 62 Firm performance may be measured using subjective measures or objective measures.
Objective measures are obtained from firm’s annual accounts and collected without directly
inquiring from the owner/manager (Moreno & Casillas, 2008). Lack of formal procedures and
control, however, makes it very difficult to obtain objectives measures. Additionally,
owner/managers are generally unwilling to release financial information to outsiders (Chao &
Spillan, 2010). On the other hand, subjective measures involve seeking for the perception of the
owner/manager relative to that of competitors during a certain time period (Idar & Mahmood,
2011). Venkatraman and Ramanujam (1986) posit that subjective measures are reliable and
subject to minimal functional biases. They can accurately reflect objective measures and are
highly consistent with how the firm actually performed as indicated by objective measures
(Lumpkin & Dess, 2001). Comparison with competing firms in the market reveals important
supplementary information, especially whether the firm is simply pulled against market trends
(Wiklund, 1999). Subjective measures of firm performance have been used in entrepreneurial
orientation studies (Idar & Mahmood, 2011; Wang & Poutziouris, 2010).
Proactiveness and Firm Performance
The importance of proactiveness and its influence on firm performance has been highlighted in
both theoretical discussions and empirical research. At the theoretical level, proactiveness leads
to enhanced firm performance because firms with this strategic posture pursue opportunities
that are unrelated to existing operations (Venkatraman, 1989), which enables introduction of
new products and brands ahead of competitors, giving them a competitive advantages that
leads to better firm performance (Okpara,2009; Rauch, Wiklund & Frese, 2004). Firms
characterized by proactiveness initiate actions that competitors must react to, leading the way in
products and services (Eggers, Kraus, Hughes, Laraway & Syncerski, 2013). Empirically,
proactiveness leads to better performance in terms of sales and employee growth, profitability,
product and customer performance (Krauss, Frese, Freidrich & Unger, 2005; Baba & Elumalai,
2011). Ahimbisibwe and Abaho (2013) examined the effect of entrepreneurial orientation and
export performance of SMEs in Uganda. He found that proactiveness had a significant and
positive influence on export performance. Similarly, Boohene, Marfo-Yiadom and Yeboah
(2012) examined the influence of proactiveness and firm performance of auto artisans in Ghana.
He discovered that there was a strong and positive relationship between proactiveness and firm
performance. On the basis of these findings, the following hypothesis if proposed:-
Ho1: There is no relationship between proactiveness and the firm performance of small and
Licensed under Creative Common Page 63
RESEARCH METHODOLOGY
Data Collection
Primary data was collected by means of a self – administered, semi structured questionnaire
completed by owner/mangers of agro processing SMEs. A census of agro processing SMEs
registered with Kenya Association of Manufacturers was used. A number of assumptions
underlay the use of self-administered questionnaires. First, it was assumed that the respondents
were capable of answering the relevant questions knowledgeably and accurately. Secondly, that
the top managers were expert informants due their experience and insight about their
enterprises and the industry. Additionally, it was assumed that the answers given by the
respondents were representative of firm behavior and practice (Lyon, Lumpkin & Dess, 2000).
The questionnaire was pretested for reliability and validity on 20 agro processing SMEs
that were not registered members of Kenya Association of Manufacturers but comparable to
members of the study population. The pre-test sample was selected using purposive sampling
technique. After the pilot test, any items that were not clear, confusing or could cause bias were
modified or omitted. A total of 111 questionnaires were sent out and 97 usable questionnaires
were received giving a response rate of 87.3% which was considered to be very good. Fourteen
questionnaires were dropped because they were missing vital information needed in the
analysis. According to Mugenda (2008), a response rate of 50% is considered adequate, 60%
and above good, and above 70% very good.
Measures
The measures in this paper were adapted from previous literature. The proactiveness construct
(PR) was measured using a five point Likert scale ranging from 1=never to 5=always. The
question solicit respondents to evaluate 1) the firm’s proclivity to be the first to introduce new products and services 2) the firm’s tendency to initiate changes ahead of competitors 3) the firm’s tendency to act ahead of competitors in anticipating future customer needs. 4) the firm’s
predisposition to respond to marketplace opportunities 5) The firm’s propensity to respond to
marketplace opportunities. Firm performance which included sales and employee growth and
profitability was measured by using a five point Likert scale ranging from 1=not at all satisfied to
5=extremely satisfied. It was very difficult to collect objective data because the owner/manager
was unwilling to release firm’s information to outsiders. As such, a subjective approach was
adopted wherein firm performance was measured based on the perception of the
owner/manager. They were requested to state their satisfaction with firms’ performance for the
Licensed under Creative Common Page 64
DATA ANALYSIS AND FINDINGS
Characteristics of Respondents
The majority (62.3%) of the owner/managers were male while 37.7% were female. Majority
(47%) of the respondents were between 31 to 40 years, 37% were between 21 to 30 years,
14% were between 4 to 50 years and 2% were below 21years. Most (41.2%) of the
respondents held bachelor degree holders, 39.2% held diploma,11.3% held master degree
holders, 6.2% held certificates while 2.1% held a doctorate degree. The majority (38.5%) of the
respondents had worked for a period between 5 to 9 years, 26.9% for less than 4 years, 19.3%
for a period between 10 to 14 years. A few (3.8%) had worked for a period between 15 to 19
years while 11.5% had worked for over 20 years. Most of the firms were limited liability
companies, 14.4% were sole proprietorships while 10.9% were partnerships. Most (40%) of the
firms had been in operation for 15 years while 24% for 5 to 9 years, another 22% had been in
operation for less than 5 years, yet another 14% had been in operation for a period between 10
to 15 years. The business activities carried out by the respondents were food and beverage
manufacturing (72.2%), leather and footwear manufacturing (4.1%), textile and garment
manufacturing (8.2%) and paper and board manufacturing (15.5%).The average firm employed
between 51 in 2009 (SD= 50.646) and 78 employees in 2013 (SD= 69.490).
Measurement Model
The outer or measurement model assessed the relationship between the observable variables
and the theoretical constructs they represent. A reliability test was conducted to determine the
internal consistency of the measures used. The Cronbach alpha (𝛼) value for proactiveness was 0.697 while firm performance had a value of 0.751 which is higher than the recommended
threshold of 0.500 demonstrating adequate reliability (Hair, Black, Babin & Anderson, 2010).
The variables were validated through factor analysis. Before performing exploratory factor
analysis, two statistical tests were performed to assess the suitability of the data for structural
detection; Kaiser-Meyer-Olkin (KMO) measure of sampling adequacy and Bartlett’s Test of Sphericity. The result of KMO was found to be 0.687 above the threshold of 0.5 and Bartlett’s
Test of Sphericity was significant at p<0.000 which indicated that the data was useful for factor
analysis (Kaiser, 1974). The variability of each observed variable that could be explained by the
extracted factors were checked by extracting the communality values. The extracted
communalities were found to be greater than 0.5 which indicated that the variables fitted well
other variables in their factor (Pallant, 2010). Factor analysis was assessed using Principle
component analysis. Two items of proactiveness and one item of firm performance were deleted
Licensed under Creative Common Page 65 Confirmatory factor analysis was estimated on multiple criteria of construct reliability,
convergent and discriminant validity. All the variables exhibited construct validity as the
composite reliability and the cronbach alpha (𝛼) were above the acceptable threshold of 0.6 (Ahimbisibwe & Abaho, 2013) demonstrating construct validity. The Average Variance extracted
(AVE) for proactiveness was 0.535 and for firm performance was 0.616 which exceeded the
cutoff value of 0.5, thus confirming convergent validity (Bryman, 2012). To satisfy the
requirement of discriminant validity of the measurement model, this study followed the criterion
suggested by Fornell and Larcker (1981). The discriminant validity was confirmed as the square
root of a construct’s AVE was greater than the correlation between the construct and other
constructs in the model (Madhoushi, Sadati & Delavari, 2011).
There was a weak correlation between proactiveness and firm performance (r = 0.371,
p< 0.05). The normality of data was assessed by examining its skewness and kurtosis (Pallant,
2010). The result showed that skewness was within the range of -0.203 and + 0.306 and
kurtosis was within the range of -0.156 and + 0.626 which complied with the normality threshold
of -1 to +1 (Cooper & Schindler, 2011). Multicollinearity was tested using Tolerance and
Variance Inflation Factor. The tolerance value was 0.856 and the VIF value was 1.168 showing
that there was no multicollinearity associated with proactiveness and firm performance variables
(Hair, Black, Babin & Anderson, 2010).
Structural Model and Hypothesis Testing
The structural or inner model identification was accomplished by examining path coefficients or
betas for hypothesis testing (Hair et al., 2011). The paths between the constructs represent
each hypothesis. Structural Equation Modeling partial least squares (SEM-PLS) was used for
model analysis and hypothesis testing. SEM-PLS was used because of four reasons. First, PLS
makes no prior distributional assumptions and is applicable to small populations. Secondly, PLS
can analyze complex model with large set of relationships among constructs and sub-constructs
(Esposito Vinzi, Trinchea & Amato, 2010). It provides more flexibility in modeling second order
constructs and formative constructs (Chin, 1998). Thirdly, PLS can account for measurement
errors of latent constructs and assess significance of structural models simultaneously. Lastly,
PLS examines the causal relationships among latent variables in situations of high complexity
and low theoretical information (Byrne, 2001).
The statistical objective of SEM-PLS is to show high R2 and significant t-values, thus
rejecting the null hypothesis of no effect. R2 values range between 1 and 0 where 1 means a
perfect prediction of the structural model (Hair et al. 2010). The hypothesized relationships were
Licensed under Creative Common Page 66 coefficient estimates was used to determine the significance of the relationship (Bordens &
Abbott, 2014). The resultant T-tests statistics from the bootstrapping procedure provided the
basis for determining which relationships are statistically significant (Hensler, Ringle &
Sinkovics, 2009).
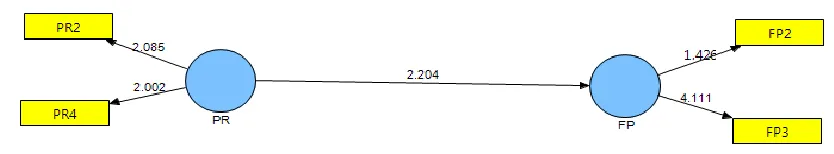
As indicated in Figures 4, the path coefficient between proactiveness and firm
performance was positive and significant at 0.05 level of significance (β=0.262, p<0.05). The
path coefficient implied that for every 1 unit increase in proactiveness, firm performance was
increased by 0.262 units. The quality of the structural model was assessed using the
determination of coefficients R2.. The value of R2 coefficient was 0.063 which indicated that
6.3% of the variation in firm performance can be accounted for by proactiveness. Based on the
assessment criterion suggested by Cohen (1988), the outer model was found to reflect a very
weak predictive relevance.
Figure 4: Path coefficient for Proactiveness and Firm Performance
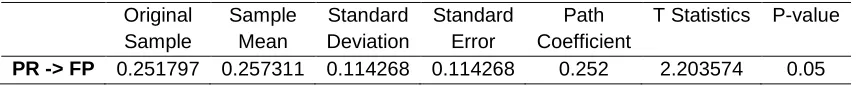
The stability of the estimates was examined by using the t-statistics obtained from a bootstrap
test with 500 resamples. Table 2 below sets out the path coefficient and the t- values observed
with the level of significance achieved from bootstrapping.
Table 2: Path Coefficient and T-values of Risk Taking
Original Sample
Sample Mean
Standard Deviation
Standard Error
Path Coefficient
T Statistics P-value
PR -> FP 0.251797 0.257311 0.114268 0.114268 0.252 2.203574 0.05
The resultant T-tests statistics are illustrated in Figure 5 showed that the model was significant
at 95% significance level for a two tailed test with t = 2.204. The results showed that
proactiveness has a positive and statistically significant relationship with firm performance. The
null hypothesis Ho1 was rejected and the alternative hypothesis that stated that there is a
relationship between proactiveness and firm performance of small and medium enterprises in
Licensed under Creative Common Page 67 Figure 5: T-statistics for the relationship between Proactiveness and Firm Performance
DISCUSSION AND CONCLUSIONS
Based on the findings, it can be concluded that, proactiveness is a major predictor of firm
performance of agro processing SMEs in Kenya in terms of employee growth and profitability.
Specifically, proactiveness has a significant positive effect on firm performance in terms of
growth and profitability (β=0.262, p<0.05, t=2.204). The results are consistent with other studies
that establish that proactiveness affects the firm performance of small firms (Boohene,
Marfo-Yiadom &Yeboah, 2012; Arshad, Rasli, Arshad & Zain, 2013; Baba & Elumalai, 2011). The
findings extend empirical studies by showing that proactiveness has positive effects on firm
performance. The performance of agro processing SMEs could benefit from being proactive.
Owner/managers of agro processing SMEs should consider proactiveness as an effective tool
for enhancing firm performance. The findings demonstrate entrepreneurship as a way of
thinking, reasoning and acting that is passionate about pursuit of favourable business
opportunities. The findings illustrate the entrepreneurial leadership of owner/managers of agro
processing SMEs whereby they act rather than react to business environment. The findings are
in line with Resource Based Theory which suggests that long term competitive advantage lies
primarily in firms creating bundles of strategic resources that competitors find difficult to
substitute or initiate without great efforts.
SUGGESTIONS FOR FURTHER RESEARCH
This study has a number of limitations that need to be addressed in further research studies.
First, the study focused on agro processing SMEs in Kenya which affects generalization of the
study findings to other industries and regions. There is need for more context specific research
in developing countries before establishing a general theory on the relationship between
proactiveness and firm performance. Secondly, the study established the relationship between
proactiveness and firm performance of agro processing SMEs. Further studies should
investigate the role of contingency factors in the proactiveness and firm performance
relationship under the contingency models of entrepreneurship (Covin & Slevin, 1991; Lumpkin
Licensed under Creative Common Page 68
REFERENCES
Abbot, M. L., & McKinney, J. (2013).Understanding and Applying Reserch Design. (1sted.). Somerset, NJ:
John Wiley & Sons, Inc.
Aggarwal, N., & Gupta, M. (2006). Market performance measures: Current status in Indian companies. Decision, 33(1), 47−74.
Ahimbisibwe, G. M., & Abaho, E. (2013). Export entrepreneurial orientation and export performance of SMEs in Uganda. Global Advanced Research Journal of Management and Business Studies, 2(1), 56- 62.
Al-Swidi, A. K., & Al-Hosam, A (2012). The effect of entrepreneurial orientation on the organizational performance: A study on the Islamic banks in Yemen using the partial least squares approach. Arabian Journal of Business and Management Review (Oman Chapter), 2(1), 73-84.
Armstrong, J. S. & Overton, T. S. (1977). Estimating nonresponse bias in mail surveys. Journal of Marketing Research, 14(3), 396–402.
Arshad, A.S., Rasli, A., Arshad, A.A., & Zain, Z.M. (2013). The impact of entrepreneurial orientation and business performance: A study of technology-based SMEs in Malaysia. Social & Behavioural Sciences, 46-53.
Atuahene-Gima K., & Ko, A. (2001). An empirical investigation of the effect of market orientation and entrepreneurship orientation alignment on product innovation.Organization Science, 12(1), 54-74.
Awang, A., Ahmad, Z, A., Asghar, A.R., Subari, K.A., & Kassim, S. A. (2011). Firm entrepreneurial orientation and knowledge/networking of agro based enterprises in Malaysia: The role of technology an strategy. African Journal of Business Management, 5 (22), 9685-9706.
Baba, R., & Elumalai, S. (2011). Entrepreneurial orientation of SMEs in Labuan and its effects on performance. Working Paper Series No. 1113. Malaysia.
Blackburn, R. A., & Smallbone, D. (2008). Researching small firms and entrepreneurship in the UK: developments and distinctiveness. Entrepreneurship Theory & Practice, 32(2), 267-288.
Bordens, K. S., & Abbott, B. B. (2014). Research design and methods: A process approach (9th ed.). San Francisco: McGraw Hill.
Boohene, R., Marfo-Yiadom, E., & Yeboah, M.A. (2012). An empirical analysis of the effect of entrepreneurial orientation on firm performance of auto artisans in the Cape Coast Metropolis, Developing County Studies, 2(9), 77- 88.
Byrne, B. M. (2001). Structural equation modeling with AMOS: Basic concepts, applications, and programming. Mahwah, NJ: Lawrence Erlbaum Associates, Inc.
Bryman, A. (2012). Social Research Methods, (4th ed). New York: Oxford University Press.
Bryman, A. & Bell, E. (2011).Business Research Methods, (3rd ed). New York: Oxford University Press. Chao, M.C., & Spillan, J.E. (2010).The journey from market orientation to firm performance. A comparative study of US and Taiwanese SMEs.Management Research Review, 33(5), 472-483.
Chin, W. W. (1998). The partial least squares approach for structural equation modeling. In George A. Marcoulides (Ed.), Modern Methods for Business Research, Lawrence Erlbaum Associates, 295-336. Cohen, J. (1988). Statistical power analysis for the behavioural sciences, (2nd ed.). Hillsdale
Cooper, R. D., & Schindler, S.P. (2011).Business Research Methods, (10thed.). New York: Mc Graw Hill.
Coulthard, M. (Spring, 2007). The role of entrepreneurial orientation on firm performance and potential influence of relational dynamism. Journal of Global Business and Technology. 29- 39.
Covin, J.G., & Miles, M.P. (1999). Corporate entrepreneurship and the pursuit of competitive Advantage. Entrepreneurship Theory & Practice, 23(3), 47-63.
Licensed under Creative Common Page 69 entrepreneurship scale in Ronstadt, R., Hornaday, J.A., Peterson, R. & Vesper, K.H. (Eds). Frontiers of Entrepreneurship Research. Wellesley: Babson College.
Covin, J. G., & Slevin, D. P. (1988).The influence of organization structure on the utility of an entrepreneurial top management style. Journal of Management Studies, 25, 217–234.
Covin, J. G., & Slevin, D. P. (1989). Strategic management of small firms in hostile and benign Environments. Strategic Management Journal, 10(1), 75-87.
Covin, J. G., & Slevin, D. P. (1991). A conceptual model of entrepreneurship as firm behavior. Entrepreneurship Theory & Practice, 16(1), 7-25.
Covin, J., Green, K. M., & Slevin, D. P. (2006). Strategic process effects on the entrepreneurial orientation-sales growth rate relationships. Entrepreneurship: Theory & Practice, 30(1), 57-81.
Cunningham, L. X., & Rowley, C. (2007).Human resource management in Chinese small and medium enterprises. Personnel Review, 36(3), 415-439.
Da Silva, C.A., Baker, D., Shepherd, A.W., Jenane, C., & Miranda-da-Cruz,S.(2009). Agro – industries for Development. Wallingford, United Kingdom: CABI Publishing.
Dess, G. G., & Lumpkin, G.T. (2005). The role of entrepreneurial orientation in stimulating effective corporate entrepreneurship. Academy of Management Executive, 19(1), 147-156.
Eggers, F., Kraus, S., Hughes, M., Laraway, S., & Syncerski, S. (2013). Implications of customer and entrepreneurial orientations for SME growth. Management Decision, 51(3), 524-546.
Entrialgo, M., Ferna´ndez, E., & Va´zquez, C. J. (2001). The effect of the organizational context on SME’s entrepreneurship: some Spanish evidence. Small Business Economics, 16(3), 223- 236.
Esposito Vinzi, V., Trinchera, L., & Amato, S. (2010). PLS Path Modeling: From Foundations to Recent Developments and Open Issues for Model Assessment and Improvement. In. V. Esposito Vinzi, W.W. Chin, J. Henseler & H. Wang (Eds) Handbook of Partial Least Squares: Concepts, Methods and Applications (47-82) Berlin, Germany: Springer Berlin Heidelberg
Fairoz, F.M., Hirobumi, T., & Tanaka, Y. (2010). Entrepreneurial orientation and performance of small and medium enterprises of Hambantoa District , Sri Lanka. Asian Social Science, 6(3), 34- 47.
Fornell, C., & Larcker, D. F. (1981). Evaluating structural equation models with unobservable variables and measurement error. Journal of Market Research, 18(1), 39–50.
Glancey, K. (1998). Determinants of growth and profitability in small entrepreneurial firms. International Journal of Entrepreneurship Behaviour and Research, 4(1), 18-27.
Haber,S., & Reichel, A. (2005). Identifying performance measures of small ventures – the case of the tourism industry. Journal of Small Business Management, 43(3), 257-287.
Hair, J. F., Black, W. C., Babin, B. J., & Anderson, R. E. (2010). Multivariate Data Analysis. A Global Perspective. (7thed.) Upper Saddle River, Boston: Pearson Education lnc.
Henseler J., Ringle, C. M., & Sinkovics, R. R. (2009). The Use of Partial Least Squares Path Modeling in International Market. Advances in International Market, 20, 277–319.
Idar, R & Mahmood, R. (2011). Entrepreneurial and market orientation relationship to performance: The SME Perspective. Interdisciplinary Review of Economics and Management, 1(2), 1-24.
Kaiser, H.E. (1974). An index of factorial simplicity. Psychometrika, 39, 31-36.
Keh, H. T., Nguyen, T. T., & Ng, H. P. (2007).The effects of entrepreneurial orientation and market information on the performance of SMEs. Journal of Business Venturing, 22(4), 592-611.
Kirsten, J., Karaan, A.S., & Dorward, A..R. (2009). Exchange, contracts and property rights enforcement in Kirsten, J.F., Dorward, A.R., Poulton, C., & Vink, N.(eds) Institutional Economics Perspectives on African Agricultural Development, Washington: International Food Programme Research Institute.
Licensed under Creative Common Page 70 Krauss, S.I., Frese, M., Freidrich, C & Unger, J.M. (2005). Entrepreneurial orientation: a psychological model of success among Southern African small business owners. European Journal of Work and Organizational Psychology, 14(3), 315–344.
Kirsten, J., Karaan, A. S., & Dorward, A. R. (2009). Exchange, contracts and property rights enforcement in Kirsten, J.F., Dorward, A.R., Poulton, C., & Vink, N.(eds) Institutional Economics Perspectives on African Agricultural Development. Washington: International Food Programme Research Institute, 35 - 73.
Kropp, F., Lindsay, N.J., & Shoham, A. (2008). Entrepreneurial orientation and international entrepreneurial business venture startup. International Journal of Entrepreneurial Behavior & Research, 14(2), 102-117.
Kropp, F., Lindsay, N.J., & Shoham, A. (2006). Entrepreneurial, market and learning orientations and international entrepreneurial business venture performance in South African firms. International Market Review, 23(5), 504 – 523.
Liu, Q., Manolova, T.S., & Edelman, L.F. (2009). Entrepreneurial Orientation and firm performance in China: the role of resource endowments. Frontiers of Entrepreneurship Research, 29 (13), 1-13.
Low, D.R., Chapman, R.L., & Sloan, T. R. (2007). Inter-relationships between innovation and market orientation in SMEs. Management of Research News, 30(12), 878-891.
Lumpkin, G.T., & Dess, G.G. (1996). Clarifying the entrepreneurial construct and linking it to Performance. Academy of Management Review, 21(1), 135-172.
Lumpkin, G.T., & Dess, G.G. (2001). Linking two dimensions of entrepreneurial orientation to firm performance: the moderating role of environment and industry life cycle. Journal of Business Venturing, 16, 429-451.
Lyon, D., Lumpkin, G., & Dess, G. (2000).Enhancing entrepreneurial orientation research: Operationalising and measuring a key strategic decision making process. Journal of Management, (26)5, 1055-1085.
Madhoushi, M., Sadati, A., & Delavari, H. (2011). Entrepreneurial orientation and innovation performance: The mediating role of knowledge management. Asian Journal of Business Management, 3(4), 310 – 316. Madsen, E.L. (2007). The significance of sustained entrepreneurial orientation on performance of firms – a longitudinal analysis. Entrepreneurship & Regional Development, 19(2), 185-204.
Miller, D., & Friesen, P. H. (1984).Organizations: A Quantum View, Englewood Cliffs, New Jersey: Prentice-Hall.
Moreno, A. N., & Casillas, J. C. (2008). Entrepreneurial orientation and growth of SMEs. A causal model. Entrepreneurship Theory & Practice, May, 507-528.
Morris, M. H., Kuratko, D. F., & Covin, J. G. (2008).Corporate Entrepreneurship & Innovation, 2nd ed. Mason: Thomson Higher Education.
Mugenda, A. G. (2008). Social Sciences Research: Conception, Methodology and Analysis, Nairobi: Kenya Applied Research and Training Services.
Murphy, G. B., Trailer, J. W., & Hill, R. C. (1996).Measuring performance in entrepreneurship research. Journal of Business Research, 36(1),15−23.
Okpara, J. O. (2009). Strategic choices, export orientation and export performance of SMEs in Nigeria. Management Decisions, 47(8), 1281-1299.
Onjala J. (2010). Impact of China –Africa Trade Relations: The case of Kenya, Final Report submitted to the African Economic Research Consortium (AERC), Nairobi.
Licensed under Creative Common Page 71 Pallant, J. (2010). SPSS Survival Manual. A step by step guide to data analysis using SPSS (4th ed.). Melbourne: Open University Press.
Patel, P., & D’Souza, R. (2009).Leveraging entrepreneurial orientation to enhance SME export performance. An Office of Advocacy Working Paper. No.337, 1-32.
Rauch, A., Wiklund, J., Freese, M., & Lumpkin, G, T. (2004). Entrepreneurial orientation and firm performance: Cumulative empirical evidence. Paper presented at the 23rd Babson College Entrepreneurship Research Conference. Glasgow.
Rauch, A., Wiklund, J., Lumpkin, G.T., & Frese, M. (2005). Entrepreneurial orientation and firm performance: An assessment of past research and suggestions for the future. Entrepreneurship Theory and Practice, 19(7), 12-18.
Rauch, A., Wiklund, J., Lumpkin, G.T., & Frese, M. (2009). Entrepreneurial orientation and firm performance: an assessment of past research and suggestions for the future. Entrepreneurship: Theory & Practice, 33(3), 761-787.
Republic of Kenya. (2007). Kenya -Vision 2030, A Globally Competitive and Prosperous Kenya. Nairobi: Government Printer. .
Republic of Kenya. (2012). Stastical Abstract. Nairobi: Kenya National Bureau of Statistics. Republic of Kenya. (2013). Economic Survey. Nairobi : Government Printer.
Singh, R. K., Garg, S. K., & Deshmukh, S. G. (2008). Strategy development by SMEs for competitiveness: a review. Benchmark: An International Journal, 15(5), 525-547.
Venkatraman, N. (1989). Strategic orientation of business enterprises: the construct, dimensionality, and measurement. Management Science, 35(8), 942-962.
Venkatraman, N., & Ramanujam, V. (1987). Measurement of business economic performance: an examination of method convergence. Journal of Management, 13(1), 109-122.
Wang, Y., & Poutziouris, P. (2010). Entrepreneurial risk taking: empirical evidence from UK family firms. Entrepreneurial Behavior & Research, 16(5), 370- 388.
Wijesekara, W. A., Kumara, P. A., & Gunawardana, T.S. (2014). The impact of market orientation and entrepreneurial orientation on performance: A study on small and medium scale garment manufacturers in Sri Lanka. Proceedings of the 3rd International Conference on Management and Economics.
Wilkinson, J., & Rocha, R. (2009). Agro-industries trends, patterns and development impacts inDa Silva, C.A., Baker, D., Shepherd, A., Jenane, C. & Miranda-da-Cruz, S. (Eds). Agro-industries for Development, Wallingford, United Kingdom: CABI Publishing.
Wiklund, J. (1999). The sustainability of the entrepreneurial orientation – performance relationship. Entrepreneurship Theory & Practice, 24(1), 37-48.
Wiklund, J., & Shepherd, D. (2003).Knowledge-based resources, entrepreneurial orientation, and the performance of small and medium sized business. Strategic Management Journal, 24 (13), 1307-1314. http://dx.doi.org/ 10.1002/smj.36.
Wiklund, J., & Shepherd, D. (2005). Entrepreneurial orientation and small firm performance: a configurational approach. Journal of Business Venturing, 20, 71-91.
World Bank. (2008). The World Development Report, Agriculture for Development. Washington DC: World Bank.
Yang, C. W. (2008).The relationships among leadership styles, entrepreneurial orientation and firm performance. Managing Global Transitions, 6(3), 257–275.
Yucel, I. (2011). Entrepreneurial orientation, executive’s individualism and firm performance: the moderating role of executives’ individualism. Far East Journal of Psychology and Business, 5(3), 63 -78.