Neuropsychiatric Disease and Treatment
Dove
press
O r i g i N a l r e s e a r c h
open access to scientific and medical research
Open access Full Text article
Kira Bensimon1,2
Nathan herrmann1,2,4
Walter swardfager1–4
hao Yi1
sandra e Black1–4
Fu-Qiang gao1,4
abraham snaiderman2,3
Krista l lanctôt1–4
1sunnybrook research institute, Toronto, ON, canada; 2Faculty of Medicine, University of Toronto, Toronto, ON, canada; 3Toronto rehabilitations institute,Toronto, ON, canada; 4canadian Partnership for stroke recovery, heart and stroke Foundation, Ottawa, ON canada
correspondence: Krista l lanctôt sunnybrook health sciences centre, room Fg08, 2075 Bayview avenue, Toronto, ON M4N 3M5, canada Fax +1 416 480 6022
email krista.lanctot@sunnybrook.ca
Kynurenine and depressive symptoms in a
poststroke population
Background and purpose: Depression is a commonly occurring and persistent sequel of stroke affecting approximately 29% of patients. An immunological hypothesis has been put forward, and synthesis of kynurenine from tryptophan has been proposed to link inflammatory activity with neurotoxicity and neurotransmitter dysfunction. This study assessed the relation-ship between peripheral blood kynurenine and poststroke depressive symptoms.
Patients and methods: This was a multisite cross-sectional observational cohort study of patients with ischemic stroke. Depressive symptoms were assessed using the Center for Epide-miological Studies Depression (CES-D) scale and divided into high, medium, and low depressive symptom tertiles. Concentrations of kynurenine and tryptophan were assayed from fasting serum samples, and the kynurenine/tryptophan ratio was compared between tertiles. Serum cytokine concentrations were assayed in a subgroup of patients, and the ratio of proinflammatory (IL-6, IL-18, IFNγ, TNF, IL-1β) to anti-inflammatory (IL-10) cytokines compared.
NLM identifier: NCT00254020.
Results: In these patients (n=86, 52.3% male, mean age 71.7±14.2 years), there were no dif-ferences in kynurenine/tryptophan ratios between CES-D scale tertiles (F2,76=0.04, P=0.96) controlling for relevant covariates. For cytokines (n=53), serum IL-1β concentrations (F2,52=3.55,
P=0.037) and serum ratios of IL-18/IL-10 (F2,52=3.30, P=0.046), IFNγ/IL-10 (F2,52=4.02,
P=0.025), and IL-1β/IL-10 (F2,52=4.34, P=0.019) were elevated in the middle CES-D tertile. Post hoc analyses suggested that serum ratios of IL-18/IL-10 (ρ=0.28, P=0.04), and IL-1β/ IL-10 (ρ=0.43, P=0.001), as well as IL-1β (ρ=0.29, P=0.04), were significantly associated with fatigue.
Conclusion: Peripheral kynurenine/tryptophan ratios were not associated with depressive symptoms in a poststroke population. However, in exploratory analyses a proinflammatory bias was identified specifically in patients with mild depressive symptoms and associated with poststroke fatigue, suggesting an avenue for future research.
Keywords: kynurenine, tryptophan, cytokine, inflammation, stroke, depression
Introduction
Poststroke depression (PSD) affects approximately a third of all stroke survivors.1
The prevalence of PSD reaches a maximum at roughly 3–6 months, diminishes by 50% at 1 year, and may remain elevated for 2 years and beyond.2,3 As such, PSD can
be chronic and nonremitting. Up to 35% of patients do not respond to currently avail-able antidepressants, with high nonremission rates, and residual symptoms commonly persist.4 A better understanding of the mechanisms associated with PSD is needed to
direct the search for additional or adjunctive therapies.
A relationship between elevations in peripheral proinflammatory cytokines and depression has been suggested in many cross-sectional studies.5 Many cytokines,
particularly IFNγ, IL-6, IL-1β, and TNF, upregulate the indoleamine 2,3-dioxygenase
Journal name: Neuropsychiatric Disease and Treatment Journal Designation: Original Research
Year: 2014 Volume: 10
Running head verso: Bensimon et al
Running head recto: Kynurenine and depressive symptoms poststroke DOI: http://dx.doi.org/10.2147/NDT.S65740
Neuropsychiatric Disease and Treatment downloaded from https://www.dovepress.com/ by 118.70.13.36 on 25-Aug-2020
For personal use only.
This article was published in the following Dove Press journal: Neuropsychiatric Disease and Treatment
22 September 2014
Dovepress
Bensimon et al
enzyme in multiple central and peripheral cell types, which catalyzes the rate-limiting step in the synthesis of kynurenine (KYN) from tryptophan (TRP), thereby increasing their ratio (K/T) in blood.6,7 Changes in both the K/T ratio and
concentrations of KYN and its metabolites have been demon-strated cross-sectionally in stroke.8 These changes have also
been associated with major depressive disorder (MDD)9–12
and depressive symptoms in patients with cardiovascular disease.13 The further metabolism of KYN into excitotoxic
metabolites, which are elevated centrally in MDD postmor-tem, has been suggested to contribute to neurodegeneration in ischemia and depressive disorders.12,14
A peripheral inflammatory response is observed post-stroke, due to a complex cascade of cytokine signals released from both innate and adaptive immune cells, including macrophages, neutrophils, and T-helper cells.15,16 Clinically,
inflammatory status can be surveyed by considering relative concentrations of pro- and anti-inflammatory cytokines, eg, the anti-inflammatory cytokine IL-10 is produced by regulatory T cells, which drop precipitously poststroke.16
IL-10 concentrations are often increased in tandem with proinflammatory cytokine concentrations in healthy individu-als, but this relationship is lost in MDD,17 where pro- versus
anti-inflammatory cytokine imbalances have been found.17–20
Pro- to anti-inflammatory cytokine imbalances have also been associated with poorer outcomes poststroke, in agreement with the neuroprotective properties of regulatory T cells and IL-10 in animal ischemia models.21–25 Therefore, in the
pres-ent study, the ratios of proinflammatory cytokines with IL-10 were explored in addition to cytokine concentrations.
While psychosocial, genetic, and physical disability cor-relates of PSD have been identified, relationships between inflammatory markers and PSD have not been consistently observed.26–28 Although some studies have described
rela-tionships between cytokines and fatigue or sickness-like behavior,26,28,29 rather than severe PSD per se, few studies
have taken into account that different contributing factors may underlie severe and mild PSD strata. The present study undertook analyses without assuming linear severity relation-ships. Therefore, the present study examined relationships between the K/T ratio and symptoms of depression in patients poststroke and explored relationships between ratios of pro- to anti-inflammatory cytokines with depressive symptoms. The study also examined possible relationships between cytokines and specific symptoms to account for qualitative differences between patients in depressive symptoms post-stroke. We hypothesized that the K/T ratio (primary) and concentrations of other inflammatory markers would differ
between subjects with mild, moderate, and severe depressive symptoms in a poststroke population.
Patients and methods
Participants
This cross-sectional observational study recruited participants admitted to acute care regional stroke centers in Toronto, ON, Canada. Consecutive patients meeting National Institute of Neurological and Communicative Disorders and Stroke30
and World Health Organization MONICA (multinational MONItoring of trends and determinants in CArdiovascular disease)31 criteria for stroke were invited to participate in
this study. Patients were recruited from Sunnybrook Health Sciences Centre (Toronto, ON, Canada) and three additional regional stroke centers (Toronto Rehabilitation Institute, St John’s Rehabilitation Centre, and Baycrest Hospital). All patients were referred to the primary study site at Sunnybrook for uniform assessment by the same study personnel. The study was approved by local research ethics boards from each institution, and all participants provided written informed consent. All study procedures were followed in accordance with institutional research ethics boards.
Acute ischemic infarcts were verified from computed tomography or magnetic resonance imaging reports per-formed at admission for all patients. Inclusion criteria also required participants to speak and understand English. Exclusion criteria were: prestroke diagnosis of dementia or significant cognitive impairment (Mini-Mental State Examination [MMSE] score 24), primary hemorrhagic stroke, decreased level of consciousness, severe aphasia or dysarthria, significant acute medical or neurological illness other than stroke, and the presence of a premorbid axis I psychiatric disorder other than depression. Histories of major depression or stroke were permitted and controlled for in statistical analyses as needed.
assessments
All neuropsychiatric testing was done within 24 hours of the blood draw. Severity of depressive symptoms was assessed using the Center for Epidemiological Studies Depression (CES-D) scale.32 The CES-D scale is a self-report instrument
that was used in the National Institutes of Neurological Com-municative Disorders Stroke Data Bank,33 and previously
validated in stroke patients using a structured psychiatric interview. The CES-D scale has been shown to have high concurrent validity with other depression measures in stroke patients (both observer-reported and self-reported),34
and has been used specifically as a measure of PSD.34–37
Neuropsychiatric Disease and Treatment downloaded from https://www.dovepress.com/ by 118.70.13.36 on 25-Aug-2020
Dovepress Kynurenine and depressive symptoms poststroke
CES-D scale scores have also been dichotomized: a score 16 was highly predictive of clinical depression (sensitivity 86%, specificity 90%, positive predictive value 80%),38 and a score
of 16 or greater has been considered a valid and reliable indicator of PSD.39 The CES-D scale was administered to
the participant in the presence of trained research personnel, with assistance if necessary. The MMSE40 was selected as
a cognitive screening instrument to exclude significant cog-nitive dysfunction (MMSE score 24), because it is brief, widely used, and validated in acute care settings.41 Stroke
severity was assessed using the National Institutes of Health Stroke Scale (NIHSS),42 either completed by clinicians upon
patient admission or extracted from the medical chart using a standardized method.43 For patients with an available clinical
computed tomography scan, stroke lesions were traced and lesion locations and volumes recorded. Patient demographics, risk factors, comorbidities, and concurrent medications were obtained from hospital charts and by patient interview.
Blood sampling and serum analyses
Fasting blood was collected via venipuncture in SST™ Vacutainer® (BD, Franklin Lakes, NJ, USA) tubes at 7.30 am
±30 minutes on the morning after the clinical assessments were conducted. Blood samples were centrifuged at 1,000 g for 10 minutes at 4°C, and serum was separated and stored at -80°C until it was assayed (Sunnybrook Health Sciences Centre). TRP and KYN concentrations were determined by high-performance liquid chromatography (HPLC), as described previously.44,45 TRP was measured by isocratic reverse-phase
HPLC without derivatization or fluorescence detection. For KYN, an equal volume of 3% perchloric acid was used for protein precipitation. After centrifugation, the con-centration of l-KYN in the supernatant was measured by
HPLC with ultraviolet detection at 258 nm. The mobile phase consisted of 9% acetonitrile in 0.05 M potassium phosphate monobasic, pumped through a reverse-phase 5 μm octadecyl column of 250×4.6 mm (Symmetry®; Waters, Milford, MA,
USA). For those participants who provided enough sample, analyses of serum cytokines IL-6, IL-10, IFNγ, TNF, IL-1β
and IL-18 were performed using a multiplex suspension bead-array immunoassay (Luminex, Austin, TX, USA). Cytokine concentrations were calculated from the median fluorescence intensities using the Luminex analyzer based on standard curve data obtained using the serially diluted cytokine standards provided in kits (BioSource, Burlington, ON, USA). Assay sensitivities were 0.2 pg/mL for IL-10, 1.0 pg/mL for IFNγ, 0.09 pg/mL for TNF, 0.057 pg/mL for IL-1β, 0.1 pg/mL for IL-6, and 12.5 pg/mL for IL-18.
Biochemical assays were performed blinded to all clinical information.
statistical analysis
For initial descriptive analyses, relationships between CES-D scale total tertiles and serum concentration of KYN, TRP, K/T ratio, lesion volumes, and clinical and demographic covariates were compared. To test the primary hypothesis, a univariate analysis of covariance (ANCOVA) model was performed to assess differences in the K/T ratio between low, intermediate, and highest CES-D scale tertiles, where all important covariates from initial descriptive analyses were included. NIHSS score, age, sex, and history of depression were chosen as covariates a priori, since these were identified previously as independent predictors of PSD2,46 and
antide-pressant use due to associations with depressive symptoms and immune markers.19,20,47 Age in particular has been found
to be positively correlated with the K/T ratio,48 pro- and
anti-inflammatory cytokines, and depression scores.2 CES-D scale
tertiles were chosen to best model the hypothesis that elevated K/T might manifest as mild depressive symptoms.
Since serum cytokine concentrations below the limits of detectability indicate low serum concentrations, val-ues returned below detectable limits were imputed at the lower limit of detectability for that analyte: 0.2 pmol/L for IL-10, 1.00 pmol/L for IFNγ, 0.09 pmol/L for TNF, and 0.06 pmol/L for IL-1β. Serum assays and stroke-lesion volumes were log-transformed to maintain a normal distribu-tion. For calculating proinflammatory cytokine to IL-10 ratios, they were calculated with raw values and log-transformed afterwards. Associations between immune imbalance and PSD were investigated using individual cytokine concentra-tions and the ratios of pro- to anti-inflammatory cytokines as exploratory outcomes in all patients for whom these data were available. ANCOVA models were performed to determine which serum cytokines or cytokine ratios were significantly elevated across CES-D scale tertiles. Tukey’s post hoc test was used to identify difference between specific tertiles.
To explore which depressive symptoms were associated with the K/T ratio, or serum cytokines or their ratios, bivari-ate Spearman’s correlations were conducted between each CES-D scale item and the K/T ratio, as well as the significant serum cytokine ratios from previous analyses. Possible het-erogeneity due to histories of depression or antidepressant use were also explored in post hoc analyses. All statistical analyses were performed using SPSS software (version 20; IBM, Armonk, NY, USA). Error bars in all figures represent standard deviation.
Neuropsychiatric Disease and Treatment downloaded from https://www.dovepress.com/ by 118.70.13.36 on 25-Aug-2020
Dovepress
Bensimon et al
sample size
A sample size of at least 84, divided into three groups, pro-vides a power of 80% to detect the minimum effect size that was observed previously in a cardiovascular population13
with a two-sided α-value of 0.05.
Results
Patient characteristics
A total of 382 post-ischemic stroke patients were screened for the study, of whom 138 patients were carefully selected who met inclusion criteria and did not meet any criterion for exclusion. A total of 86 patients (mean age 71.7±14.2 years, 47.7% female) who agreed to participate and for whom suf-ficient serum samples were obtained were included in this analysis. Demographics and clinical characteristics of each tertile are presented in Table 1. CES-D scale scores ranged from 0 to 48, with a mean ± standard deviation CES-D scale score of 13.5±11.5. Based on 33rd and 66th percentile CES-D scale scores, CES-D scale tertile ranges were 0–6, 7–16, and 17–48, respectively. Of all demographic and clinical charac-teristics, only smoking (current) and hypertension differed between CES-D scale tertiles. Concurrent medications did not
differ significantly between CES-D scale tertiles. As continu-ous variables, only NIHSS score (r=0.25, P=0.02) and age (r=0.23, P=0.04) were associated with CES-D scale scores.
K/T ratio and depressive symptoms
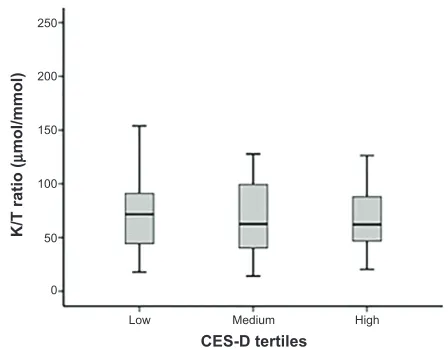
KYN, TRP, and K/T ratio assay results are reported in Table 2. The K/T ratio did not differ between CES-D scale tertiles (F2,76=0.04, P=0.96; see Figure 1) in a model controlling for NIHSS score (F1,76=1.12, P=0.28), age (F1,76=4.84, P=0.03), sex (F1,76=0.15, P=0.70), history of depression (F1,76=3.19,
P=0.08), antidepressant use (F1,76=0.22, P=0.64), hyperten-sion (F1,76=1.39, P=0.24), and smoking (F1,76=4.54, P=0.04). Neither KYN (F2,76=0.054, P=0.96) nor TRP (F2,76=0.44,
P=0.64) concentrations individually differed between CES-D scale tertiles; however, TRP was significantly lower in patients with a history of depression (F2,76=5.43, P=0.022) and in older subjects (F1,76=6.48, P=0.013).
cytokine concentrations and ratios
Cytokines were assayed in the 53 patients who provided sufficient serum for analysis, and results are reported in Table 2. This subset of patients did not differ from patients
Table 1 clinical demographic characteristics by depression tertiles (n=86)
Mean ± SD or % (low)* n=30
Mean ± SD or % (medium)* n=28
Mean ± SD or % (high)* n=28
χ2 or F** P-value†
age (years) 67.9±14.3 73.0±13.1 74.6±14.7 1.81 0.17
sex (male) 56.7 53.6 46.4 0.63 0.73
history of depression 3.3 3.6 14.3 3.42 0.18
antidepressant use 0 7.1 14.3 4.56 0.10
living alone 20.0 42.9 28.6 3.64 0.16
level of education high school 55.1 40.7 40.7 10.89 0.37
Marital status (married) 56.7 42.9 53.6 12.47 0.13
employment status (retired) 62.1 82.1 78.6 6.77 0.34
Days since stroke 25.4±35.1 22.9±37.3 20.1±28.6 0.18 0.84
lesion volume (mm3) (n=71) 31,107±61,158 17,700±39,967 15,502±14,894 0.86 0.43
ces-D scale 2.7±2.2 11.9±2.7 26.6±9.8
Nihss 4.2±5.2 5.3±3.9 6.3±5.3 1.29 0.28
MMse 26.3±4.2 27.2±2.3 26.3±4.4 0.51 0.60
hypertension 73.3 75.0 96.4 6.22 0.045‡
antihypertensive medication use 53.3 53.6 75.0 4.04 0.395
Diabetes 26.7 17.9 28.6 1.00 0.61
hyperlipidemia 66.7 53.6 82.1 5.22 0.07
cholesterol-lowering medication use 56.7 53.6 78.6 4.86 0.31
Obesity (BMi 30) 20.0 25.0 17.9 0.46 0.80
smoking 33.3 3.6 17.9 8.49 0.014‡
sum of risk factors§ 2.2±1.4 1.8±1.0 2.4±0.9 15.08 0.129
Notes: *lowest ces-D scale tertile (0–6), middle tertile (7–16), highest tertile (17–47); **χ 2 or F-values and corresponding †P-values reflect results of Pearson’s χ2 tests
with ces-D scale tertiles for categorical variables and aNOVas between ces-D scale tertiles and continuous variables, respectively; ‡P-values represent significant (P0.05)
associations between the ces-D scale and clinical/demographic variables; §sum of risk factors represents the sum of potential risk factors, including hypertension, diabetes,
hyperlipidemia, obesity, or smoking.
Abbreviations: sD, standard deviation; BMi, body mass index; ces-D, center for epidemiological studies Depression; Nihss, National institutes of health stroke scale; MMse, Mini-Mental state examination; aNOVa, analysis of variance.
Neuropsychiatric Disease and Treatment downloaded from https://www.dovepress.com/ by 118.70.13.36 on 25-Aug-2020
Dovepress Kynurenine and depressive symptoms poststroke
who did not provide sufficient serum with respect to age, sex, depression history, hypertension, or other comorbidities (all
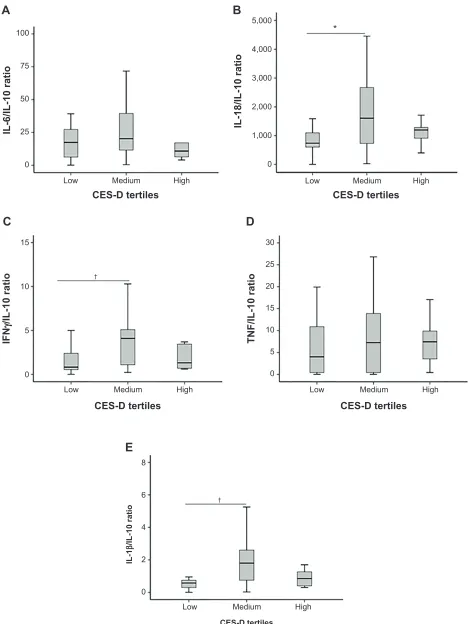
P0.05). Of these immunological markers, all KYN, TRP, K/T ratio, IL-6, and IL-18 levels were within detectable range. Imputations were made for 21% of IL-1β, 27% of TNF, 60% of IL-10, and 5.1% of IFNγ samples. Comparison of serum concentrations of IL-6, IL-10, IL-18, IFNγ, TNF, and IL-1β, and their ratios with IL-10 across CES-D scale tertiles are shown in Table 3. Of the individual cytokines, only IL-1β concentrations differed significantly between CES-D scale tertiles. Ratios of IL-18/IL-10, IFNγ/IL-10 and IL-1β/IL-10 were also significantly different between CES-D scale tertiles. Post hoc tests revealed that serum IL-18/ IL-10 (P=0.046), IFNγ/IL-10 (P=0.025), and IL-1β/IL-10 (P=0.019) (Figure 2) were elevated in the middle CES-D scale tertile compared to the first CES-D scale tertile.
Post hoc analyses
Post hoc analyses of specific depressive symptoms suggested that serum ratios of IL-18/IL-10 (ρ=0.28, P=0.04) and IL-1β/ IL-10 (ρ=0.43, P=0.001), as well as IL-1β (ρ=0.29, P=0.04) were significantly associated with CES-D scale item 7 (“everything was an effort”). However, this association was not found with K/T ratios (ρ=0.044, P=0.69). The IFNγ/IL-10 ratio was associated with CES-D scale items 11 (“restless sleeping”, ρ=0.35, P=0.01) and 17 (“crying spells”, ρ=0.29,
P=0.04). The IL-18/IL-10 ratio was also associated with CES-D scale item 17 (ρ=0.29, P=0.04). IL-1β was associ-ated with CES-D scale item 15 (“people were unfriendly”,
ρ=0.30, P=0.03).
In antidepressant free-patients (n=80), K/T ratios did not differ between CES-D scale tertiles (F2,79=1.49, P=0.19). In those with cytokine assays (n=47), ratios of IL-1β/IL-10 (F2,46=4.87, P=0.01), IFNγ/IL-10 (F2,46=3.83, P=0.03) and IL-1β concentrations (F2,46=4.41, P=0.02) remained different
between tertiles, and there remained a trend for IL-18/IL-10 (F2,46=3.01, P=0.06).
In patients without a premorbid history of depression (n=80), K/T ratios did not differ between CES-D scale tertiles (F2,79=0.41, P=0.67). In those with cytokine assays (n=51), ratios of IFNγ/IL-10 (F2,50=3.87, P=0.03), IL-18/IL-10 (F2,50=3.35, P=0.04), IL-1β/IL-10 (F2,50=4.26, P=0.02), and IL-1β concentrations (F2,50=4.01, P=0.03) remained different between tertiles.
To facilitate comparison of our results with other studies, we repeated the main analyses using an established clinically important CES-D scale cutoff of 16. K/T ratios did not dif-fer between groups (F1=2.05, P=0.15) in a model adjusted as per the main analysis.
Discussion
In this study, no relationship was identified between the K/T ratio and CES-D scale scores. This finding was maintained after excluding those with antidepressant use or a history of depression. In the context of MDD, both positive10–12 and
neg-ative findings with KYN metabolism have been reported.49–51
As replicated in this study, a recent meta-analysis found dis-ability to be among the most significant predictors of PSD,2
suggesting a minor role for immunological contributions. However, the present findings should be interpreted in light of other known properties of the KYN pathway and additional observations. For instance, whereas the production of quino-linic acid and its intermediates by KYN monooxygenase in microglia may induce oxidative stress and excitotoxicity,14
KYN catabolism into kynurenic acid by KYN aminotrans-ferase II in astrocytes may be neuroprotective.52 Therefore,
the production of both neurotoxic and neuroprotective
K/T ratio
(
µ
mol/mmol)
CES-D tertiles Low
0 50 100 150 200 250
Medium High
Figure 1 Mean serum kynurenine/tryptophan (K/T) ratios in low (0–6), medium (7–16), and high (17–47) center for epidemiological studies Depression (ces-D) scale tertiles (n=86).
Table 2 immunological assay results*
Immunological markers Mean ± SD or median (IQR)
KYN (μmol/l) 3.04±1.64
TrP (μmol/l) 43.88±11.82
K/T (μmol/mmol) 73.32±43.22
il-6 (pg/l) 3.90 (2.29–7.82)
il-10 (pg/l) 0.20 (0.20–2.07)
il-18 (pg/l) 251.40 (163.20–348.30)
il-1β (pg/l) 0.19 (0.12–0.40)
TNF (pg/l) 1.91 (0.09–3.28)
iFNγ (pg/l) 0.61 (0.23–1.00)
Notes: *n=86 for KYN, TrP, and K/T ratios; n=53 for cytokine assays.
Abbreviations: sD, standard deviation; iQr, interquartile range; KYN, kynurenine; TrP, tryptophan; K/T, KYN/TrP.
Neuropsychiatric Disease and Treatment downloaded from https://www.dovepress.com/ by 118.70.13.36 on 25-Aug-2020
Dovepress
Bensimon et al
metabolites when in balance may have no net effect on depressive symptoms.10,53 Immunoregulatory effects of KYN
may curb neuroinflammation,54 resulting in the
neuroprotec-tive properties observed in ischemia models,55 which might
obscure deleterious roles of KYN metabolites.54,55 Therefore,
while the present study establishes that the peripheral K/T ratio is not a PSD biomarker, it does not preclude possible roles of KYN or its metabolites in the brain.
In the present study, higher K/T ratios and lower TRP concentrations were associated with older age. TRP concen-trations were lower in subjects with a history of depression, although KYN concentrations were not different. Therefore, the present study replicates the relationship between low TRP and depressive diathesis seen in other populations, but does not provide evidence to support a role for KYN synthesis in this relationship. Mean K/T ratios in the present study (78 μmol/mmol) and another stroke study8 were higher than
those previously reported in MDD patients (25 μmol/mmol)10
or in coronary artery disease patients (40 μmol/mmol), where depressive symptoms measured by the CES-D scale were associated with the K/T ratio.13 Marked elevations in
the K/T ratio poststroke may be above the levels associated with depressive symptoms and instead indicative of other poststroke sequelae.8,56,57
Relationships between cytokines (ie, IL-1β) and cytokine ratios (IL-18/IL-10, IL-1β/IL-10, and IFNγ/IL-10) with depressive symptoms were identified in agreement with some24,26,27,29 but not all previous studies.22,24,25 These
explor-atory results suggest that the risk of mild PSD symptoms might be better characterized by inflammatory imbalance; IL-1β and the immunologic ratios studied tended to be high-est in the intermediate depressive symptoms tertile. These inverted U-shaped curves would be consistent with animal data, in which inflammatory activity produces “sickness
behaviors” that sometimes transition into a more severe syndrome reminiscent of human depression.58
The disagreement between studies that dichotomized patients into depressed or nondepressed categories may be partly explained by the heterogeneity in the presentation of depressive episodes poststroke; the present post hoc analyses agree with previous studies,28,29,59 suggesting that somatic
symptoms (ie, fatigue and sleep disturbance) may be associ-ated with immune dysregulation, in addition to some core affective symptoms (ie, sadness, crying, and negative social bias). Clinically, cytokines have been associated with post-stroke fatigue but not depression per se.28,29 Our exploratory
finding that cytokine ratios (IL-18/IL-10 and IL-1β/IL-10) as well as IL-1β were most consistently associated with CES-D scale item 7 (“everything was an effort”) rather than mood items are consistent with this. This item, either with or without the inertia item (“could not get going”), has been operationalized to measure fatigue.60,61 A recent study
exam-ined fatigue more specifically in patients poststroke, finding relationships with TRP availability and a KYN metabolite, but also finding no relationship with PSD.62 Taken together,
the results suggest a potential relationship between inflamma-tory cascades and fatigue and milder depressive symptoms, which may be qualitatively different from MDD.
As a possible limitation, inflammatory markers were not assessed in the acute phase of stroke and examined pro-spectively, which may have revealed different relationships; however, previous reports suggest that elevations in KYN and its metabolites persist for weeks to years following stroke or traumatic brain injury,8,63 and the present findings suggest
that elevations in other inflammatory markers are relevant to depressive symptoms in the subacute phase. These positive findings suggest that it would have been possible to observe a relationship if the K/T ratio was related to PSD. Although the CES-D scale is not a diagnostic instrument, the aim of this study was to characterize the relationship between the K/T ratio and depressive symptoms, for which the CES-D scale has been validated. Moreover, exploratory findings support the hypothesis that there may be nonlinear immuno-logical relationships with depressive symptoms, suggesting the utility of nondichotomous assessment. While KYN and some KYN metabolites can cross the blood–brain barrier,64
peripheral blood concentrations may not represent central concentrations and KYN metabolites were not assayed; how-ever, peripheral KYN has been correlated with cerebrospinal fluid KYN and quinolinic acid concentrations65 and with
post-stroke sequelae,8,57 justifying its exploration as a biomarker
for PSD. Finally, the main finding of the present study does
Table 3 Differences between cytokines and cytokine ratios by ces-D tertiles (n=53)
Cytokines Immunologic ratios
F2,46* P-value† F2,46* P-value†
il-6 3.04 0.06 il-6/il-10 0.88 0.42
il-18 2.12 0.13 il-18/il-10 3.30 0.046‡
TNF 0.34 0.71 TNF/il-10 0.69 0.51
iFNγ 2.54 0.09 iFNγ/il-10 4.02 0.025‡
il-1β 3.55 0.037‡ il-1β/il-10 4.34 0.019‡
il-10 1.83 0.17 – – –
Notes: *F-statistics and corresponding †P-values (‡P0.05) reflect results of
independents in analysis-of-covariance models controlling for Nihss score, age, antidepressant use, and hypertension. controlling for smoking instead of hypertension showed similar results (for il-1β, P=0.11; for il-18/il-10, P=0.008; for iFNγ/il-10, P=0.17; for il-1β/il-10, P=0.025).
Abbreviations: ces-D, center for epidemiological studies Depression; Nihss, National institutes of health stroke scale.
Neuropsychiatric Disease and Treatment downloaded from https://www.dovepress.com/ by 118.70.13.36 on 25-Aug-2020
Dovepress Kynurenine and depressive symptoms poststroke
A
IL-6/IL-10 ratio
C
IFN
γ
/IL-10 rati
o
E
IL-1
β
/IL-10 ratio
CES-D tertiles
100
75
50
25
0
0
0 2 4 6 8 5
10 15
†
†
Low Medium High
CES-D tertiles
Low Medium High
D
TNF/IL-10 ratio
0 5 10 15 20 25 30
CES-D tertiles
Low Medium High
CES-D tertiles
Low Medium High
CES-D tertiles
B
IL-18/IL-10 ratio
0 1,000 2,000 3,000 4,000 5,000
*
Low Medium High
Figure 2 Mean serum cytokine/il-10 ratios in low (0–6), medium (7–16), and high (17–47) center for epidemiological studies Depression (ces-D) scale tertiles; n=53 for each panel.
Notes: (A) Mean serum il-6/il-10; (B) mean serum il-18/il-10; (C) mean serum iFNγ/il-10; (D) mean serum TNF/il-10; (E) mean serum il-1β/il-10 ratio in low (0–6), medium (7–16), and high (17–47) ces-D scale tertiles. *P0.0005; †P0.05.
Neuropsychiatric Disease and Treatment downloaded from https://www.dovepress.com/ by 118.70.13.36 on 25-Aug-2020
Dovepress
Bensimon et al
not support the primary hypothesis, and the positive findings reported were based on exploratory and post hoc analyses in a subgroup of patients without correction for multiple comparisons. Although the relationship between cytokines and fatigue was determined based on a CES-D scale item, the validity of this item has been established,60,61 and the results
concur with those of other studies that used more nuanced fatigue assessments.28,29 Although the exploratory results do
not provide rigorous evidence, they are confluent with extant literature and provide an impetus for appropriately powered replicative and/or prospective studies. Finally, the associa-tions observed in this study do not imply causation.
Conclusion
K/T ratios were not associated with depressive symptoms in the acute phase following an ischemic infarct, although associations between depressive symptoms and disability and vascular risk factors were confirmed, and relationships between serum TRP concentrations and histories of depres-sion and age were found. Exploratory analyses suggested that inflammatory activity was associated with mild–moderate but not with severe depressive symptoms. Prospective studies might clarify relationships between immune imbalance and the evolution of depressive symptoms poststroke.
Acknowledgments
This research was supported by grants from the Heart and Stroke Foundation of Canada (T6383 and NA5857). Dr Swardfager was supported by fellowships from the Canadian Partnership for Stroke Recovery and the Toronto Rehabilitation Institute.
Disclosure
The authors report no conflicts of interest in this work.
References
1. Hackett ML, Yapa C, Parag V, Anderson CS. Frequency of depres-sion after stroke: a systematic review of observational studies. Stroke. 2005;36:1330–1340.
2. Ayerbe L, Ayis S, Wolfe CD, Rudd AG. Natural history, predictors and outcomes of depression after stroke: systematic review and meta-analysis.
Br J Psychiatry. 2013;202:14–21.
3. Whyte EM, Mulsant BH, Vanderbilt J, Dodge HH, Ganguli M. Depres-sion after stroke: a prospective epidemiological study. J Am Geriatr Soc. 2004;52:774–778.
4. Chen Y, Patel NC, Guo JJ, Zhan S. Antidepressant prophylaxis for post-stroke depression: a meta-analysis. Int Clin Psychopharmacol. 2007;22: 159–166.
5. Dowlati Y, Herrmann N, Swardfager W, et al. A meta-analysis of cytok-ines in major depression. Biol Psychiatry. 2010;67:446–457.
6. Fujigaki S, Saito K, Sekikawa K, et al. Lipopolysaccharide induction of indoleamine 2,3-dioxygenase is mediated dominantly by an IFN-gamma-independent mechanism. Eur J Immunol. 2001;31:2313–2318.
7. Pemberton LA, Kerr SJ, Smythe G, Brew BJ. Quinolinic acid production by macrophages stimulated with IFN-gamma TNF-alpha and IFN-alpha.
J Interferon Cytokine Res. 1997;17:589–595.
8. Darlington LG, Mackay GM, Forrest CM, Stoy N, George C, Stone TW. Altered kynurenine metabolism correlates with infarct volume in stroke.
Eur J Neurosci. 2007;26:2211–2221.
9. Gabbay V, Liebes L, Katz Y, et al. The kynurenine pathway in adoles-cent depression: preliminary findings from a proton MR spectroscopy study. Prog Neuropsychopharmacol Biol Psychiatry. 2010;34:37–44. 10. Myint AM, Kim YK, Verkerk R, Scharpe S, Steinbusch H, Leonard B.
Kynurenine pathway in major depression: evidence of impaired neu-roprotection. J Affect Disord. 2007;98:143–151.
11. Riedel WJ, Klaassen T, Schmitt JA. Tryptophan, mood, and cognitive function. Brain Behav Immun. 2002;16:581–589.
12. Steiner J, Walter M, Gos T, et al. Severe depression is associated with increased microglial quinolinic acid in subregions of the anterior cingulate gyrus: evidence for an immune-modulated glutamatergic neurotransmission? J Neuroinflammation. 2011;8:94.
13. Swardfager W, Herrmann N, Dowlati Y, et al. Indoleamine dioxygenase activation and depressive symptoms in patients with coro-nary artery disease. Psychoneuroendocrinology. 2009;34:1560–1566. 14. Schwarcz R, Whetsell WO Jr, Mangano RM. Quinolinic acid: an
endogenous metabolite that produces axon-sparing lesions in rat brain.
Science. 1983;219:316–318.
15. Lambertsen KL, Biber K, Finsen B. Inflammatory cytokines in experimental and human stroke. J Cereb Blood Flow Metab. 2012;32: 1677–1698.
16. Swardfager W, Winer DA, Herrmann N, Winer S, Lanctôt KL. Interleukin-17 in post-stroke neurodegeneration. Neurosci Biobehav
Rev. 2013;37:436–444.
17. Dhabhar FS, Burke HM, Epel ES, et al. Low serum IL-10 concentrations and loss of regulatory association between IL-6 and IL-10 in adults with major depression. J Psychiatr Res. 2009;43:962–969.
18. Kenis G, Maes M. Effects of antidepressants on the production of cytokines. Int J Neuropsychopharmacol. 2002;5:401–412.
19. Kubera M, Lin AH, Kenis G, Bosmans E, van Bockstaele D, Maes M. Anti-Inflammatory effects of antidepressants through suppression of the interferon-gamma/interleukin-10 production ratio. J Clin
Psychop-harmacol. 2001;21:199–206.
20. Maes M, Song C, Lin AH, et al. Negative immunoregulatory effects of antidepressants: inhibition of interferon-gamma and stimulation of inter-leukin-10 secretion. Neuropsychopharmacology. 1999;20:370–379. 21. Basic Kes V, Simundic AM, Nikolac N, Topic E, Demarin V.
Pro-inflammatory and anti-Pro-inflammatory cytokines in acute ischemic stroke and their relation to early neurological deficit and stroke outcome.
Clin Biochem. 2008;41:1330–1334.
22. Kim JM, Stewart R, Kim SW, et al. Associations of cytokine gene polymorphisms with post-stroke depression. World J Biol Psychiatry. 2012;13:579–587.
23. Liesz A, Suri-Payer E, Veltkamp C, et al. Regulatory T cells are key cerebroprotective immunomodulators in acute experimental stroke.
Nat Med. 2009;15:192–199.
24. Su JA, Chou SY, Tsai CS, Hung TH. Cytokine changes in the pathophysiology of poststroke depression. Gen Hosp Psychiatry. 2012; 34:35–39.
25. Yang L, Zhang Z, Sun D, Xu Z, Zhang X, Li L. The serum interleukin-18 is a potential marker for development of post-stroke depression. Neurol
Res. 2010;32:340–346.
26. Bossù P, Salani F, Cacciari C, et al. Disease outcome alexithymia and depression are differently associated with serum IL-18 levels in acute stroke. Curr Neurovasc Res. 2009;6:163–170.
27. Jiménez I, Sobrino T, Rodríguez-Yáñez M, et al. High serum levels of leptin are associated with post-stroke depression. Psychol Med. 2009;39: 1201–1209.
28. Ormstad H, Aass HC, Amthor K, Lund-Sørensen N, Sandvik L. Serum levels of cytokines, glucose, and hemoglobin as possible predictors of poststroke depression, and association with poststroke fatigue. Int J
Neurosci. 2012;122:682–690.
Neuropsychiatric Disease and Treatment downloaded from https://www.dovepress.com/ by 118.70.13.36 on 25-Aug-2020
Neuropsychiatric Disease and Treatment
Publish your work in this journal
Submit your manuscript here: http://www.dovepress.com/neuropsychiatric-disease-and-treatment-journal
Neuropsychiatric Disease and Treatment is an international, peer-reviewed journal of clinical therapeutics and pharmacology focusing on concise rapid reporting of clinical or pre-clinical studies on a range of neuropsychiatric and neurological disorders. This journal is indexed on PubMed Central, the ‘PsycINFO’ database and CAS,
and is the official journal of The International Neuropsychiatric Association (INA). The manuscript management system is completely online and includes a very quick and fair peer-review system, which is all easy to use. Visit http://www.dovepress.com/testimonials.php to read real quotes from published authors.
Dove
press
Dovepress Kynurenine and depressive symptoms poststroke
29. Ormstad H, Aass HC, Amthor KF, Lund-Sørensen N, Sandvik L. Serum cytokine and glucose levels as predictors of poststroke fatigue in acute ischemic stroke patients. J Neurol. 2011;258:670–676.
30. Foulkes MA, Wolf PA, Price TR, Mohr JP, Hier DB. The Stroke Data Bank: design methods and baseline characteristics. Stroke. 1988;19:547–554. 31. [No authors listed]. The World Health Organization MONICA Project
(monitoring trends and determinants in cardiovascular disease): a major international collaboration. J Clin Epidemiol. 1988;41:105–114. 32. Radloff LS. The CES-D scale: a self-report depression scaled for research
in the general population. Appl Psychol Meas. 1977;1:385–401. 33. Kunitz SC, Gross CR, Heyman A, et al. The pilot Stroke Data Bank:
definition, design, and data. Stroke. 1984;15:740–746.
34. Agrell B, Dehlin O. Comparison of six depression rating scales in geriatric stroke patients. Stroke. 1989;20:1190–1194.
35. Morris PL, Robinson RG, de Carvalho ML, et al. Lesion characteristics and depressed mood in the stroke data bank study. J Neuropsychiatry
Clin Neurosci. 1996;8:153–159.
36. Ramasubbu R, Flint A, Brown G, Awad G, Kennedy S. A neuroendo-crine study of serotonin function in depressed stroke patients compared to non depressed stroke patients and healthy controls. J Affect Disord. 1999;52:121–133.
37. Ramasubbu R, Robinson RG, Flint AJ, Kosier T, Price TR. Functional impairment associated with acute poststroke depression: the Stroke Data Bank Study. J Neuropsychiatry Clin Neurosci. 1998;10:26–33. 38. Parikh RM, Eden DT, Price TR, Robinson RG. The sensitivity and
speci-ficity of the Center for Epidemiologic Studies Depression Scale in screen-ing for post-stroke depression. Int J Psychiatry Med. 1988;18:169–181. 39. Shinar D, Gross CR, Price TR, Banko M, Bolduc PL, Robinson RG.
Screening for depression in stroke patients: the reliability and validity of the Center for Epidemiologic Studies Depression Scale. Stroke. 1986;17:241–245.
40. Folstein MF, Folstein SE, McHugh PR. “Mini-mental state” A practi-cal method for grading the cognitive state of patients for the clinician.
J Psychiatr Res. 1975;12:189–198.
41. Tombaugh TN, McIntyre NJ. The mini-mental state examination: a comprehensive review. J Am Geriatr Soc. 1992;40:922–935. 42. Brott T, Marler JR, Olinger CP, et al. Measurements of acute cerebral
infarction: lesion size by computed tomography. Stroke. 1989;20: 871–875.
43. Williams LS, Yilmaz EY, Lopez-Yunez AM. Retrospective assessment of initial stroke severity with the NIH Stroke Scale. Stroke. 2000;31: 858–862.
44. Anderson GM, Purdy WC. Liquid chromatographic-fluorometric system for the determination of indoles in physiological samples. Anal Chem. 1979;51:283–286.
45. Forrest CM, Mackay GM, Stoy N, et al. Tryptophan loading induces oxidative stress. Free Radic Res. 2004;38:1167–1171.
46. Hackett ML, Anderson CS. Predictors of depression after stroke: a systematic review of observational studies. Stroke. 2005;36: 2296–2301.
47. Kubera M, Kenis G, Bosmans E, Scharpe S, Maes M. Effects of serotonin and serotonergic agonists and antagonists on the production of interferon-gamma and interleukin-10. Neuropsychopharmacology. 2000;23:89–98.
48. Frick B, Schroecksnadel K, Neurauter G, Leblhuber F, Fuchs D. Increasing production of homocysteine and neopterin and degradation of tryptophan with older age. Clin Biochem. 2004;37:684–687.
49. Frazer A, Pandey GN, Mendels J. Metabolism of tryptophan in depres-sive disease. Arch Gen Psychiatry. 1973;29:528–535.
50. Møller SE, Kirk L, Honoré P. Tryptophan tolerance and metabo-lism in endogenous depression. Psychopharmacology (Berl). 1982;76:79–83.
51. Wood K, Harwood J, Coppen A. The effect of antidepressant drugs on plasma kynurenine in depressed patients. Psychopharmacology (Berl). 1978;59:263–266.
52. Nozaki K, Beal MF. Neuroprotective effects of L-kynurenine on hypoxia-ischemia and NMDA lesions in neonatal rats. J Cereb Blood
Flow Metab. 1992;12:400–407.
53. Schwarcz R, Pellicciari R. Manipulation of brain kynurenines: glial targets, neuronal effects, and clinical opportunities. J Pharmacol Exp
Ther. 2002;303:1–10.
54. Mezrich JD, Fechner JH, Zhang X, Johnson BP, Burlingham WJ, Bradfield CA. An interaction between kynurenine and the aryl hydrocarbon receptor can generate regulatory T cells. J Immunol. 2010;185:3190–3198.
55. Gigler G, Szenasi G, Simo A, et al. Neuroprotective effect of L-kynurenine sulfate administered before focal cerebral ischemia in mice and global cerebral ischemia in gerbils. Eur J Pharmacol. 2007;564:116–122.
56. Brouns R, Verkerk R, Aerts T, et al. The role of tryptophan catabolism along the kynurenine pathway in acute ischemic stroke. Neurochem
Res. 2010;35:1315–1322.
57. Gold AB, Herrmann N, Swardfager W, et al. The relationship between indoleamine 2,3-dioxygenase activity and post-stroke cognitive impair-ment. J Neuroinflammation. 2011;8:17.
58. Dantzer R, O’Connor JC, Freund GG, Johnson RW, Kelley KW. From inflammation to sickness and depression: when the immune system subjugates the brain. Nat Rev Neurosci. 2008;9:46–56.
59. Maes M, Galecki P, Verkerk R, Rief W. Somatization, but not depression, is characterized by disorders in the tryptophan catabolite (TRYCAT) pathway, indicating increased indoleamine 2,3-dioxygenase and lowered kynurenine aminotransferase activity. Neuro Endocrinol
Lett. 2011;32:264–273.
60. De Vries J, Van der Steeg AF, Roukema JA. Psychometric properties of the Fatigue Assessment Scale (FAS). Int J Clin Health Psychol. 2010;10:125–139.
61. Vestergaard S, Nayfield SG, Patel KV, et al. Fatigue in a representative population of older persons and its association with functional impair-ment, functional limitation, and disability. J Gerontol A Biol Sci Med
Sci. 2009;64:76–82.
62. Ormstad H, Verkerk R, Amthor KF, Sandvik L. Activation of the kynurenine pathway in the acute phase of stroke and its role in fatigue and depression following stroke. J Mol Neurosci. Epub 2014 Mar 25. 63. Mackay GM, Forrest CM, Stoy N, et al. Tryptophan metabolism and
oxidative stress in patients with chronic brain injury. Eur J Neurol. 2006;13:30–42.
64. Fukui S, Schwarcz R, Rapoport SI, Takada Y, Smith QR. Blood–brain barrier transport of kynurenines: implications for brain synthesis and metabolism. J Neurochem. 1991;56:2007–2017.
65. Raison CL, Dantzer R, Kelley KW, et al. CSF concentrations of brain tryptophan and kynurenines during immune stimulation with IFN-alpha: relationship to CNS immune responses and depression. Mol Psychiatry. 2010;15:393–403.
Neuropsychiatric Disease and Treatment downloaded from https://www.dovepress.com/ by 118.70.13.36 on 25-Aug-2020