Patient Preference and Adherence
The relationship between patient satisfaction
with service quality and survival in pancreatic
cancer
Digant Gupta Maurie Markman Mark Rodeghier Christopher G Lis Cancer Treatment Centers of America®, Schaumburg, IL, USA
Correspondence: Digant Gupta Cancer Treatment Centers of America, 1336 Basswood Road, Schaumburg, IL, USA 60173
Tel +1 847 342 6625 Fax +1 847 342 6626 Email gupta_digant@yahoo.com
Purpose: Despite the recognized relevance of symptom burden in pancreatic cancer, there has been limited exploration of whether an individual patient’s satisfaction with the overall quality of care received might influence outcome. We evaluated the relationship between patient satisfaction with health service quality and survival in patients with pancreatic cancer. Patients and methods: A random sample of 496 pancreatic cancer patients treated at Cancer Treatment Centers of America® (CTCA) between July 2007 and December 2010. A questionnaire that covered several dimensions of patient satisfaction was administered. Items were measured on a seven-point Likert scale ranging from “completely dissatisfied” to “completely satisfied.” Patient survival was the primary end point. Cox regression was used to evaluate the association between patient satisfaction and survival.
Results: The response rate for this study was 72%. Of the 496 patients, 345 (69.6%) reported being “completely satisfied” with the care provided. Median overall survival was 7.9 months. On univariate analysis, patients reporting they were “completely satisfied” experienced superior survival compared with patients stating they were “not completely satisfied” (hazard ratio = 0.62; 95% confidence interval: 0.50–0.77; P , 0.001). On multivariate analysis controlling for stage at diagnosis, treatment history, and specific CTCA treatment center, “completely satisfied” patients demonstrated significantly lower mortality (hazard ratio = 0.63; 95% confidence interval: 0.51–0.79; P , 0.001).
Conclusion: In this exploratory analysis, patient satisfaction with health service quality was an independent predictor of survival in pancreatic cancer. Further exploration of a possible meaningful relationship between patient satisfaction with the care they have received and outcome in this difficult malignancy is indicated.
Keywords: health services, oncology, prognosis, survival
Introduction
Pancreatic cancer is a common malignancy with approximately 30,000 cases diagnosed every year in the United States.1 It is the fourth leading cause of cancer deaths in the United States after lung, breast/prostate, and colorectal cancer.2,3 Pancreatic cancer is known for its debilitating symptoms and, despite considerable progress in the areas of epidemiology, molecular genetics, diagnostics, operative techniques, and patient management, the overall 5-year survival rate for pancreatic cancer is 4.4%, compared
with the survival rate for distant stage pancreatic cancer, which is merely 1.6%.2,4
Over 90% of pancreatic cancer patients die within a year of diagnosis and, for the majority of patients, treatment is aimed at palliation of symptoms only. Fatigue, loss of appetite, pain, and reduced physical, cognitive and emotional function are issues of major concern in palliative care of these patients.5
Dove
press
O R I G I n A L R E S E A R C h
open access to scientific and medical research
Open Access Full Text Article
Patient Preference and Adherence downloaded from https://www.dovepress.com/ by 118.70.13.36 on 26-Aug-2020
For personal use only.
Number of times this article has been viewed
This article was published in the following Dove Press journal: Patient Preference and Adherence
Though symptom burden in pancreatic cancer is well known, there has been a recent rise in awareness that patients’ satisfaction with the quality of the services they receive at a healthcare institution6,7 can affect their treatment outcome. Evaluations of service quality in an oncology setting provide important data concerning the patient satisfaction with the quality of care and treatment delivered by physicians, paramedical staff, and the hospital as a whole.8 Health providers can use data on service quality to design and track quality improvement over time and compare themselves to other health providers (when the same measures are used), as well as to recognize and expeditiously resolve service problems in real time.9,10 Evaluation of service quality involves a diverse array of methodologies, including longitudinal surveys, in-depth interviews, focus group discussions, patient panels, consultation of voluntary groups, and analyses of patient feedback and concerns. Such evaluations, when followed by speedy improvements to hospital operations and protocol, can enhance current and future patient satisfaction during and after treatment. Patient-reported service quality surveys are the most widely used method for objectively and systematically determining cancer patients’ satisfaction with the healthcare they received.11
There are several studies in the literature that have evaluated service quality in different cancers, such as gastroesophageal,12 breast,9,13 colorectal,14 lung, prostate15 and gynecological16,17 cancers. Collectively, these studies have found that satisfaction with the information provided by medical staff about a patient’s illness and the course of treatment is important. This is followed closely by satisfaction with the time spent with the physician and the interpersonal skills of the physician. Other key factors are: waiting time to get an appointment, empathy of staff with the patient, the continuity of care provided, and satisfaction with the nursing staff.11 Patient satisfaction with their treatment and services from medical providers is often influenced by the patient’s overall well-being and health.18,19 Similarly, patients who are responding more favorably to treatment will likely have greater survival and are also likely to have better current health and more positive feelings of well-being. Thus, there is a nexus among these characteristics, and because patient satisfaction is so commonly assessed in health care, we investigated the relationship between patient satisfaction with service quality and survival in pancreatic cancer patients treated at a national network of oncology hospitals. The current study is a sequel to our recently published study evaluating this relationship in colorectal cancer.20
Materials and methods
Study population
All pancreatic cancer patients were eligible for this study if they were seen in consultation at one of three Cancer
Treatment Centers of America® (CTCA) hospitals between
July 2007 and December 2010 and elected to have treatment at CTCA. The three CTCA centers were CTCA Eastern, CTCA Midwestern, and CTCA Southwestern. Patients asked to participate in this study were randomly selected from a population that had not responded to a service quality questionnaire within the preceding 60 days. The surveyed cohort included a total of 496 patients. The study was approved by the CTCA Institutional Review Board.
Service quality questionnaire
The service quality questionnaire used in this study was first implemented in August 2006. The instrument was developed based on input obtained from patient focus groups and survey dimensions that were collated from several existing studies or questionnaires of oncology patients.21–24 This service quality questionnaire covers the following dimensions of patient satis-faction: hospital operations and services, physicians and staff, and patient endorsements for others (friends and associates). The questionnaire was administered by trained survey associ-ates at each CTCA hospital during a patient’s treatment visit. Eligible patients were typically contacted while they were wait-ing for various appointments. The survey was paper based and was completed by the patient and returned, during that same visit, to designated locations at each CTCA hospital.
The questionnaire included 13 individual service quality items: “the ease of the registration process”; “the speed of the registration process”; “the timeliness with which care was delivered”; “the ease with which care was delivered;” “team helping you understand your medical condition;” “team explaining your treatment options;” “team involving you in decision making;” “the amount of time spent with you;” “team calling you by your name;” “team genuinely caring for you as an individual;” “team providing you with a sense of well-being;” “‘whole person’ approach to patient care;” and “satisfaction with the treating medical oncologist (patient’s primary physician).” The questionnaire also contained one overall service quality item measured using the following question: “Considering everything, how satisfied are you with your overall experience with the institution?”
Statistical analysis
Patient survival was the primary end point and was defined as the time interval between the date a patient first returned
Dovepress
Gupta et al
Patient Preference and Adherence downloaded from https://www.dovepress.com/ by 118.70.13.36 on 26-Aug-2020
the patient survey and the date of the patient’s death from any cause, or the date of last contact/last known to be alive. The 13 individual service quality items and one overall service quality item were used as independent variables in this study.
The survey items were measured on a seven-point Likert-type scale ranging from “completely dissatisfied” to “completely satisf ied.” Because of skewed data distributions, each service quality item was dichotomized into two categories for the purpose of this analysis: “completely satisfied” (7) and “not completely satisfied” (1–6). Other control variables investigated for their relationship with survival were age, prior treatment history, stage at diagnosis, sex, and CTCA center. The prior treatment history variable categorized patients into those who had received definitive cancer treatment elsewhere before coming to CTCA and those who were newly diagnosed at CTCA. The stage at diagnosis variable was dichotomized into metastatic (stage IV) and nonmetastatic disease (stages I–III). For CTCA center, dummy variables were created, with CTCA Southwestern as the reference category.
Descriptive statistics and frequencies were computed for each service quality item in the questionnaire. The overall survival was calculated using the Kaplan–Meier method. Service quality items were evaluated using univariate Cox proportional hazards models to determine which parameters showed individual prognostic value for survival. Multivariate Cox proportional hazards models were then performed to evaluate the joint prognostic significance of all service quality items that were significant on univariate analysis after controlling for patient characteristics. We used both a block-entry method (all variables entered together at the same time in one block) as well as the forward stepwise method. The forward stepwise method was used because, as is common in service quality data, many of the individual items are highly correlated. Stepwise regression avoids the problem of multicollinearity because two highly correlated attributes will normally not both be entered in the model. Since “overall patient satisfaction with service quality” is highly correlated with other individual service quality items, it was not included in multivariate Cox analyses when other service quality items were used, in order to achieve model stability. Instead, “overall patient satisfaction with service quality” was analyzed separately after adjusting for clinical and demographic factors.
Cox regression with time-invariant covariates assumes that the ratio of hazards for any two groups remains constant
in proportion over time. We checked this assumption by examining log-minus-log plots for the categorical predictors. Potential multicollinearity was assessed in two steps. Large values (above 0.7) of Kendall’s tau-b correlation coefficient were used as an initial screen for pairs of service quality measures, with one member of the pair not entered into the multivariate model (the measure that was more meaningful or actionable was retained). Kendall’s tau-b is an appropriate measure of association for categorical variables and is commonly used when both variables have the same number of categories. As a second check, the variance inflation factor was used with the final model to verify that multicollinearity was not significantly influencing model coefficients.25,26 The effect of perceived service quality on patient survival was expressed as a hazard ratio (HR) with 95% confidence interval (CI). A difference was considered to be statistically significant if the P value was less than or equal to 0.05. All data were analyzed using IBM SPSS version 20.0 (IBM, Armonk, NY).
Results
Response rate
A total of 689 returning pancreatic cancer patients were contacted at all three centers combined to participate in the survey between July 2007 and December 2010. However, only 496 patients responded. As a result, the response rate for this study was 72%.
Baseline patient characteristics
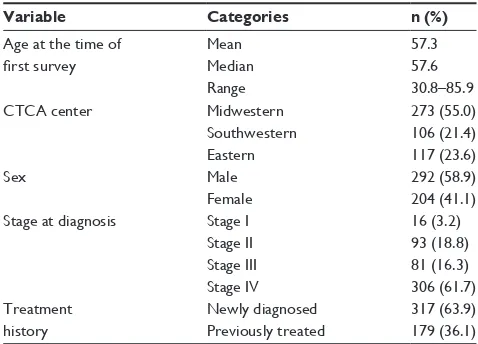
Table 1 displays baseline patient characteristics across the entire study population (n = 496). Most patients in the study were newly diagnosed and had stage IV disease
Table 1 Baseline patient characteristics (n = 496)
Variable Categories n (%)
Age at the time of
first survey
Mean Median Range
57.3 57.6 30.8–85.9
CTCA center Midwestern
Southwestern Eastern
273 (55.0) 106 (21.4) 117 (23.6)
Sex Male
Female
292 (58.9) 204 (41.1) Stage at diagnosis Stage I
Stage II Stage III Stage IV
16 (3.2) 93 (18.8) 81 (16.3) 306 (61.7) Treatment
history
newly diagnosed Previously treated
317 (63.9) 179 (36.1) Abbreviation: CTCA, Cancer Treatment Centers of America®.
Dovepress Patient satisfaction and survival
Patient Preference and Adherence downloaded from https://www.dovepress.com/ by 118.70.13.36 on 26-Aug-2020
at presentation. At the time of this analysis (May 2012), 387 (78%) patients had expired. The average time duration between the date first seen at CTCA and the date of survey was 134 days.
Service quality items
Table 2 describes patient satisfaction with service quality items pertaining to CTCA’s operations and services, as well as CTCA’s multidisciplinary patient care team. For the overall service quality item, 345 (69.6%) were “completely satisfied” while 151 (30.4%) were “not completely satisfied” with the care provided. The highest levels of dissatisfaction were observed for the following individual service quality items: “the timeliness with which your care was delivered,” “team helping you understand your medical condition,” and “team explaining your treatment options.”
Univariate analysis – predictors
of patient survival
Median overall survival for the entire patient cohort was 7.9 months (95% CI: 7.3–8.6 months). The median survival
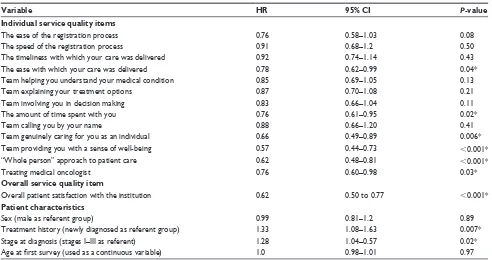
for “completely satisfied” patients and “not completely satisfied” patients was 8.6 and 6.2 months, respectively, log-rank P , 0.001. As shown in Table 3, six individual service quality items were significantly predictive of survival: “the ease with which care was delivered,” “the amount of time team spent with you,” “team genuinely caring for you as an individual,” “team providing you with a sense of well-being,” “team’s ‘whole person’ approach to patient care,” and “the treating medical oncologist (patient’s primary physician).” In addition, “overall patient satisfaction with service quality” was also significantly predictive of survival. Among the patient characteristics, prior treatment history and stage at diagnosis were significant predictors of survival.
Multivariate analysis – predictors
of patient survival
Before proceeding with multivariate analysis, the authors checked the bivariate Kendall’s tau-b correlation among the service quality predictors in order to screen for observable multicollinearity. “Ease of the registration process” and
Table 2 Service quality items
How satisfied are you with Completely satisfied* Not completely satisfied*
The ease of the registration process (n = 494)
425 (86.0) 69 (14.0)
The speed of the registration process (n = 493)
426 (86.4) 67 (13.6)
The timeliness with which your care was delivered (n = 486)
331 (68.1) 155 (31.9)
The ease with which your care was delivered (n = 488)
383 (78.5) 105 (21.5)
Team helping you understand your medical condition (n = 493)
313 (63.5) 180 (36.5)
Team explaining your treatment options (n = 490)
332 (67.8) 158 (32.2)
Team involving you in decision making (n = 489)
360 (73.6) 129 (26.4)
The amount of time spent with you (n = 491)
365 (74.3) 126 (25.7)
Team calling you by your name (n = 491)
433 (88.2) 58 (11.8)
Team genuinely caring for you as an individual (n = 491)
433 (88.2) 58 (11.8)
Team providing you with a sense of well-being (n = 490)
404 (82.4) 86 (17.6)
“Whole person” approach to patient care (n = 487)
407 (83.6) 80 (16.4)
Treating medical oncologist (n = 485)
386 (79.6) 99 (20.4)
Notes: *Expressed as number (percent). Items were dichotomized into two groups of “completely satisfied” (7) and “not completely satisfied” (1–6). Some sample sizes are
less than 496 because of missing responses.
Dovepress
Gupta et al
Patient Preference and Adherence downloaded from https://www.dovepress.com/ by 118.70.13.36 on 26-Aug-2020
“speed of the registration process” were highly correlated
(tau-b = 0.77). “Team explaining your treatment options”
was highly correlated with two items: “team helping you understand your medical condition,” (tau-b = 0.76); and
“team involving you in decision making,” (tau-b = 0.72).
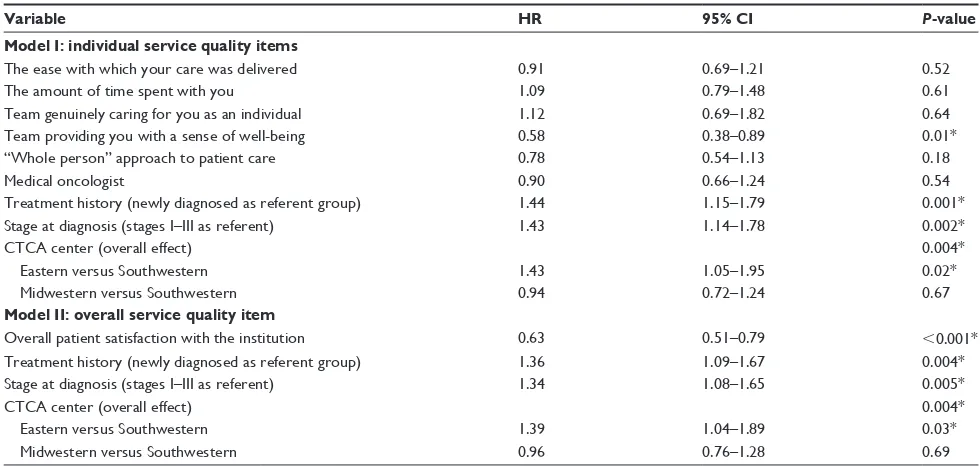
The six service quality items shown to be significant upon univariate analysis did not show high correlations with any other item. As a result, it was decided to include all of those six items in the multivariate Cox modeling. Table 4 displays the results of the multivariate Cox regression for the following two models: Model I investigates the six individual service quality items controlling for stage at diagnosis, treatment history, and CTCA center; Model II investigates the overall service quality item controlling for stage at diagnosis, treatment history, and CTCA center. In Model I, the only service quality item that was significant was “team providing you with a sense of well-being;” stage at diagnosis, prior treatment history, and CTCA center were also found to be statistically significant. In Model II, the item pertaining to overall service quality was found to be signifi-cant along with both stage at diagnosis and treatment history; stage at diagnosis, prior treatment history, and CTCA center were also found to be statistically significant. The results of both models were confirmed using the forward stepwise approach. Variance inflation factor values for the service
quality measures ranged from 1.5 to 2.5, none of which indicate a significant problem with multicollinearity.25,26 There was no evidence of nonproportional hazards in the multivariate models presented.
Discussion
The present study investigated the association between patient satisfaction with service quality and survival in pancreatic cancer patients treated in an acute care, national oncology hospital network.
The univariate and multivariate findings of this study suggest that when patients are satisfied with the healthcare, they might experience positive emotions that may favorably influence biologically relevant factors (eg, enhanced immune function, patient focus on maintaining adequate nutrition). Another possible interpretation is that a third variable, such as the patient’s general state of health, which was not measured in the current study, may affect both patient satisfaction and survival, leading to a spurious association. Patients with a better state of general health may have rated their satisfaction with service quality more highly than did patients whose general health was not as good.
Patient satisfaction (which is often assessed by heath care organizations) may be viewed as a useful, if imprecise, indicator of survival in pancreatic cancer patients, whether
Table 3 Univariate Cox regression analysis
Variable HR 95% CI P-value
Individual service quality items
The ease of the registration process 0.76 0.58–1.03 0.08
The speed of the registration process 0.91 0.68–1.2 0.50
The timeliness with which your care was delivered 0.92 0.74–1.14 0.43
The ease with which your care was delivered 0.78 0.62–0.99 0.04*
Team helping you understand your medical condition 0.85 0.69–1.05 0.13
Team explaining your treatment options 0.87 0.70–1.08 0.21
Team involving you in decision making 0.83 0.66–1.04 0.11
The amount of time spent with you 0.76 0.61–0.95 0.02*
Team calling you by your name 0.88 0.66–1.20 0.41
Team genuinely caring for you as an individual 0.66 0.49–0.89 0.006*
Team providing you with a sense of well-being 0.57 0.44–0.73 ,0.001*
“Whole person” approach to patient care 0.62 0.48–0.81 ,0.001*
Treating medical oncologist 0.76 0.60–0.98 0.03*
Overall service quality item
Overall patient satisfaction with the institution 0.62 0.50 to 0.77 ,0.001*
Patient characteristics
Sex (male as referent group) 0.99 0.81–1.2 0.89
Treatment history (newly diagnosed as referent group) 1.33 1.08–1.63 0.007*
Stage at diagnosis (stages I–III as referent) 1.28 1.04–0.57 0.02*
Age at first survey (used as a continuous variable) 1.0 0.98–1.01 0.97 Notes: *P, 0.05. Individual and overall service quality questions were dichotomized into two categories: “completely satisfied” (7) and “not completely satisfied” (1–6). “Not completely satisfied” was the referent group.
Dovepress Patient satisfaction and survival
Patient Preference and Adherence downloaded from https://www.dovepress.com/ by 118.70.13.36 on 26-Aug-2020
that association be due to improved general health, more positive emotions, or a combination of these. Although clinical indicators of prognosis are primary, these findings suggest that health care providers pay close attention to those patients who are less than completely satisfied during treatment. Doing so and alleviating any readily remedied causes of dissatisfaction may improve patient commitment to treatment protocols and secondary factors, such as adequate nutrition.
A recently published prospective cohort study by Fenton et al27 investigated the relationship between patient satisfaction and mortality in adult respondents. Patient satisfaction was assessed using five items from the Con-sumer Assessment of Health Plans Survey. It was found that respondents in the highest patient satisfaction quartile (relative to the lowest patient satisfaction quartile) had higher mortality (adjusted HR, 1.26; 95% CI, 1.05–1.53). These results are in contrast to the results observed in our study, where better overall patient satisfaction was associ-ated with greater survival. However, there are several dif-ferences between our study and the one by Fenton et al that are worth mentioning. The patient population in the Fenton study comprised a national sample of adults with a variety of underlying medical conditions excluding cancer. Further, the Fenton study did not include psychosocial measures of patient satisfaction apart from the question on “time spent
with the physician.” Finally, the Fenton study did not adjust for the main underlying disease/medical condition although the authors did control for a surrogate measure of underlying disease, the self-reported health. This sug-gests that the relationship between patient satisfaction and survival might well be a function of the underlying disease population being investigated. Clearly, future prospective studies among diverse patient populations are warranted to better elucidate the relationship between patient satisfac-tion and survival.
Several limitations of the study require acknowledgment. The patient cohort was limited to only those patients who spoke English, so this study sample is, therefore, not broadly representative of pancreatic cancer patients in general. Our study, which is exploratory and hypothesis generating by nature, used a nonvalidated patient satisfaction questionnaire. Further, as discussed above, it might be argued that patients with greater satisfaction with service quality might be the ones with better general health, leading to a confounded association between patient satisfaction and survival. However, we did control for the effects of tumor stage and prior treatment history in our analysis. These two variables can be considered proxies for self-rated health given that patients with advanced-stage disease who have been extensively treated are likely to have worse general health compared with patients who
Table 4 Multivariate Cox regression analysis
Variable HR 95% CI P-value
Model I: individual service quality items
The ease with which your care was delivered 0.91 0.69–1.21 0.52
The amount of time spent with you 1.09 0.79–1.48 0.61
Team genuinely caring for you as an individual 1.12 0.69–1.82 0.64
Team providing you with a sense of well-being 0.58 0.38–0.89 0.01*
“Whole person” approach to patient care 0.78 0.54–1.13 0.18
Medical oncologist 0.90 0.66–1.24 0.54
Treatment history (newly diagnosed as referent group) 1.44 1.15–1.79 0.001*
Stage at diagnosis (stages I–III as referent) 1.43 1.14–1.78 0.002*
CTCA center (overall effect) 0.004*
Eastern versus Southwestern 1.43 1.05–1.95 0.02*
Midwestern versus Southwestern 0.94 0.72–1.24 0.67
Model II: overall service quality item
Overall patient satisfaction with the institution 0.63 0.51–0.79 ,0.001*
Treatment history (newly diagnosed as referent group) 1.36 1.09–1.67 0.004*
Stage at diagnosis (stages I–III as referent) 1.34 1.08–1.65 0.005*
CTCA center (overall effect) 0.004*
Eastern versus Southwestern 1.39 1.04–1.89 0.03*
Midwestern versus Southwestern 0.96 0.76–1.28 0.69
Notes: *P, 0.05. Individual and overall service quality questions were dichotomized into two categories: “completely satisfied” (7) and “not completely satisfied” (1–6). “Not completely satisfied” was the referent group. Model I investigates the individual service quality items controlling for stage at diagnosis, treatment history, and CTCA
center; Model II investigates the overall service quality item controlling for stage at diagnosis, treatment history, and CTCA center.
Abbreviation: CTCA, Cancer Treatment Centers of America®.
Dovepress
Gupta et al
Patient Preference and Adherence downloaded from https://www.dovepress.com/ by 118.70.13.36 on 26-Aug-2020
are newly diagnosed with early-stage disease. That said, it is imperative for future studies to control for self-reported health when analyzing the relationship between patient satisfaction and survival. Finally, we could not perform a comparison of baseline characteristics between responders and nonresponders since we did not have any information available on nonresponders.
The strengths of our study include: a large randomly selected sample size, the fact that we measured service quality as close to the time service was delivered as pos-sible, and the fact that we used patient survival (the most objective and most commonly used health outcome mea-sure in oncology) as our dependent variable. To the best of our knowledge, this exploratory study is the first in the health care literature to report on the association between patient satisfaction with service quality and survival in a large sample of patients with advanced pancreatic cancer. Based on this provocative observation, it is reasonable to suggest that further exploration of a possible meaningful relationship between patient satisfaction with the care they have received and outcome in this difficult malignancy is indicated.
Conclusion
We demonstrated the predictive significance of patient sat-isfaction with health service quality as it relates to patient survival in pancreatic cancer. We identified two key inde-pendent service quality predictors of patient survival: “team providing you with a sense of well-being” and “overall patient satisfaction.” These are entirely new findings in the literature, to the best of our knowledge.
Acknowledgments
This study was funded by Cancer Treatment Centers of America®. We wish to thank Kristine Stolfi, Sara Mortensen, Jody Wehrwein, and Cindy Rawlings for data collection for this project. We would also like to thank Diane Ottersen, Shelly Ware, and Jane Fridman for providing us with the updated demographic and survival data. Finally, we thank all of our patients and their families.
Disclosure
The authors report no conflicts of interest in this work.
References
1. Siegel R, Naishadham D, Jemal A. Cancer statistics, 2012. CA Cancer
J Clin. 2012;62(1):10–29.
2. Rocha Lima CM, Centeno B. Update on pancreatic cancer. Curr Opin
Oncol. 2002;14(4):424–430.
3. Shaib YH, Davila JA, El-Serag HB. The epidemiology of pancreatic cancer in the United States: changes below the surface. Aliment
Pharmacol Ther. 2006;24(1):87–94.
4. Pandol S, Gukovskaya A, Edderkaoui M, Dawson D, Eibl G, Lugea A. Epidemiology, risk factors, and the promotion of pancreatic cancer: role of the stellate cell. J Gastroenterol Hepatol. 2012;27 Suppl 2: 127–134.
5. Labori KJ, Hjermstad MJ, Wester T, Buanes T, Loge JH. Symptom profiles and palliative care in advanced pancreatic cancer: a prospective study. Support Care Cancer. 2006;14(11):1126–1133.
6. Kleeberg UR, Feyer P, Günther W, Behrens M. Patient satisfaction in outpatient cancer care: a prospective survey using The PASQOC questionnaire. Support Care Cancer. 2008;16(8):947–954.
7. Williams B, Coyle J, Healy D. The meaning of patient satisfaction: an explanation of high reported levels. Soc Sci Med. 1998;47(9): 1351–1359.
8. Cleary PD. The increasing importance of patient surveys. Qual Health
Care. 1999;8(4):212.
9. Bergenmar M, Nylén U, Lidbrink E, Bergh J, Brandberg Y. Improvements in patient satisfaction at an outpatient clinic for patients with breast cancer.
Acta Oncol. 2006;45(5):550–558.
10. Bolus R, Pitts J. Patient satisfaction: the indispensable outcome. Manag
Care. 1999;8(4):24–28.
11. Lis CG, Rodeghier M, Gupta D. Distribution and determinants of patient satisfaction in oncology: A review of the literature. Patient
Prefer Adherence. 2009;3:287–304.
12. Kavadas V, Barham CP, Finch-Jones MD, et al. Assessment of satis-faction with care after inpatient treatment for oesophageal and gastric cancer. Br J Surg. 2004;91(6):719–723.
13. Defossez G, Mathoulin-Pelissier S, Ingrand I, et al; REPERES research network. Satisfaction with care among patients with non-metastatic breast cancer: development and first steps of validation of the REPERES-60 questionnaire. BMC Cancer. 2007;7:129.
14. Mathiesen TP, Willaing I, Freil M, et al. How do patients with colorectal cancer perceive treatment and care compared with the treating health care professionals? Med Care. 2007;45(5):394–400.
15. Sherlaw-Johnson C, Datta P, McCarthy M. Hospital differences in patient satisfaction with care for breast, colorectal, lung and prostate cancers. Eur J Cancer. 2008;44(11):1559–1565.
16. Vashisht A, Domoney CL, Handscomb K, Smith JR, Bridges JE. Patient satisfaction with the care provided at a gynaecology oncology clinic.
J Obstet Gynaecol. 2000;20(2):183–184.
17. von Gruenigen VE, Hutchins JR, Reidy AM, et al. Gynecologic oncology patients’ satisfaction and symptom severity during palliative chemotherapy. Health Qual Life Outcomes. 2006;4:84.
18. Bleich SN, Ozaltin E, Murray CK. How does satisfaction with the health-care system relate to patient experience? Bull World Health
Organ. 2009;87(4):271–278.
19. Lis CG, Rodeghier M, Grutsch JF, Gupta D. Distribution and determi-nants of patient satisfaction in oncology with a focus on health related quality of life. BMC Health Serv Res. 2009;9:190.
20. Gupta D, Lis CG, Rodeghier M. Can patient experience with service quality predict survival in colorectal cancer? J Healthc Qual. Epub August 22, 2012.
21. Brédart A, Robertson C, Razavi D, et al. Patients’ satisfaction ratings and their desire for care improvement across oncology settings from France, Italy, Poland and Sweden. Psychooncology. 2003;12(1):68–77. 22. Kleeberg UR, Tews JT, Ruprecht T, Höing M, Kuhlmann A, Runge C.
Patient satisfaction and quality of life in cancer outpatients: results of the PASQOC study. Support Care Cancer. 2005;13(5):303–310. 23. Loblaw DA, Bezjak A, Bunston T. Development and testing of a
visit-specific patient satisfaction questionnaire: the Princess Margaret Hospital Satisfaction with Doctor Questionnaire. J Clin Oncol. 1999;17(6):1931–1938.
24. Sixma HJ, Kerssens JJ, Campen CV, Peters L. Quality of care from the patients’ perspective: from theoretical concept to a new measuring instrument. Health Expect. 1998;1(12):82–95.
Dovepress Patient satisfaction and survival
Patient Preference and Adherence downloaded from https://www.dovepress.com/ by 118.70.13.36 on 26-Aug-2020
Patient Preference and Adherence
Publish your work in this journal
Submit your manuscript here: http://www.dovepress.com/patient-preference-and-adherence-journal
Patient Preference and Adherence is an international, peer-reviewed, open access journal focusing on the growing importance of patient preference and adherence throughout the therapeutic continuum. Patient satisfaction, acceptability, quality of life, compliance, persistence and their role in developing new therapeutic modalities and compounds to
optimize clinical outcomes for existing disease states are major areas of interest. This journal has been accepted for indexing on PubMed Central. The manuscript management system is completely online and includes a very quick and fair peer-review system. Visit http://www.dovepress.com/ testimonials.php to read real quotes from published authors.
25. Besley D, Kuh E, Welsch R. Regression Diagnostics: Identifying
Influential Data and Sources of Multicollinearity. New York: Wiley;
2004.
26. O’Brien, RM. A caution regarding rules of thumb for variance inflation factors. Quality and Quantity. 2007;41:673–690.
27. Fenton JJ, Jerant AF, Bertakis KD, Franks P. The cost of satisfaction: a national study of patient satisfaction, health care utilization, expen-ditures, and mortality. Arch Intern Med. 2012;172(5):405–411.
Dovepress
Dove
press
Gupta et al
Patient Preference and Adherence downloaded from https://www.dovepress.com/ by 118.70.13.36 on 26-Aug-2020