36
Performance Evaluation Of Physical Layer Using
Lora Technology For Indoor Environment
I. S. Ismail, N. A. Abdul Latiff, N. A. Azmi Ali, N. M. Abdul Latiff
Abstract: Low Power Wide Area Network is a new wireless technology which is designed for low power with long-range communication, and LoRa is one of the primary solutions of the technology. The objective of this paper is to evaluate the performance of the physical layer of LoRa Technology in an indoor environment. An experimental testbed is conducted using LoRa module as LoRa transmitter and receiver node and several LoRa parameters such as transmit power, bandwidth, spreading factor and coding rate are exploited. A series of experiments are performed at different locations with different LoRa parameters to investigate the effect of these parameters on the packet data throughput, received signal strength indication and signal-to-noise ratio. The results showed that the combination of different LoRa physical parameters have a clear impact on the overall performance. In addition, the external parameters such as the variant of distance between the transmitter and the receiver node and the obstacles that exist between the two nodes can also affect the performance of LoRa network.
Index Terms: Internet of Things, LoRa, long-range communication, LPWAN.
—————————— ——————————
1
INTRODUCTION
The Internet of Things (IoT) is one of the technological drivers towards Industry 4.0 and has become one of the essentials in the modern life today. Generally, every devices that are connected to the internet, or communicate among each other via the internet are part of the IoT network. The increasing preponderance of IoT technologies has made a great positive impact not only in daily human activities but also in other applications such as real-time environmental monitoring system, energy and resources management, industrial control and productions system and smart city and transportation [1],[2]. In addition, recent advances in IoT have made it possible to be adopted in healthcare sector which contributes to enhancement of healthcare services, innovation in medical applications and reduction in healthcare costs. Wireless technology is commonly used together with IoT application. Applications with different function require different technology to function correctly. Common short-range wireless technologies such as Bluetooth and ZigBee are not suitable for applications which require long-range radio communication and low bandwidth. Although cellular technology is able to provide a wider coverage area than short-range radio technology, it consumes a lot of energy which is not suitable for low power applications. The latest advancement in communication device has seen that it becomes smaller, cheaper and more energy efficient. Consequently, it inspired the development of a communication technology called Low Power Wide Area Networks (LPWAN). This new technology becomes a complement to the traditional communication technologies such as cellular and short-range wireless technologies by enhancing a better functionality and requirement for IoT applications. This paper aims to study the performance of LoRa technology for indoor environment which the focus will be on physical layer known as LoRa (Long Range).
An experimental testbed is constructed, and the relationship between LoRa parameters such as transmit power, bandwidth, spreading factor and coding rate with LoRa performance parameters such as received signal strength indication (RSSI), signal-to-noise (SNR) and packet data throughput are analysed. The effect of distance between LoRa nodes (transmitter and receiver nodes), and also the location of LoRa node at indoor environment that affects the network performance of LoRa are also examined. The rest of the paper is organized as follows. Section 2 gives overview on LPWAN and LoRa technology while Section 3 describes on the experimental setup. Results obtained from the experiments are explained and discussed in Section 4. Finally, Section 5 concludes the paper.
2
OVERVIEW
OF
LOW
POWER
WIDE
AREA
NETWORKS
AND
LORA
TECHNOLOGY
The Low Power Wide Area Network is a new type of wireless communication network which allows long-range communication at a low bit rate [3], [4], [5]. It is designed to cover large coverage area, extends the battery’s lifetime and also has low operational cost. The LPWAN technologies prove that the connectivity range of the LPWAN node can achieve up to 3 kilometres for the urban area. Meanwhile, for the rural area the range is more than 10 kilometres [6]. In the line of sight condition, the communication range is up to 20 kilometres [7], and it is still possible to achieve up to 30 kilometres range as reported in [8]. Generally, the characteristics of LPWAN technologies can be classified into three key features; long-range, low power, and scalability. The long-range communication between end nodes and gateway (the receiver) is achievable by LPWAN devices due to the star topology network and the used of modulation techniques in the wireless communication. LPWAN devices operate in the unlicensed ISM bands at 169 MHz, 433 MHz, 868/915 MHz, and 2.4 GHz. However, these frequencies vary depending on which region the devices are being used [9] for example; the recommended region are Europe, North America, Asia, etc. [10]. LoRaWanTM 1.1 Regional Parameter document [11] describes the frequency allowed on most of the region for the ISM band. The document also includes the suggested channel plan for several selected countries. For example, the channel plan for Malaysia is Region Asia, 923 MHz with the range of frequency band between 919 – 924 MHz. The LPWAN technology developed by Semtech which is known as LoRa
————————————————
• I. S. Ismail, N. A. Abdul Latiff, and N. A. Azmi Ali, Co-Author are currently with School of Ocean Engineering, Universiti Malaysia Terengganu, 21030 Kuala Terengganu, Terengganu, Malaysia. • N. M. Abdul Latiff is currently with School of Electrical Engineering,
Universiti Teknologi Malaysia, 81030 UTM Johor Bahru, Johor, Malaysia.
• Corresponding author email (N. A. Abdul Latiff):
Technology [12] is designed to provide long-range communication, low power consumption, and secure data transmission. It also operates in the unlicensed SUB-GHz ISM band using a chirp spread spectrum (CSS) modulation for optimizing the power consumption and more extended communication range. The LoRa Technology uses the combination of two layers which are the physical layer known as LoRa for the connectivity and Medium Access Control layer that is known as LoRaWan [13]. The Lora device called HopeRF also used LoRa Technology as its modem for low power long-range transceiver module due to the advantages of the technology to increase the link budget and immunity to in-band interference. The used of spread spectrum modulation and forward error correction techniques in the technology is also able to improve the communication range and robustness of radio communication links compared to traditional Frequency-Shift Keying (FSK) based modulation [14].
LoRa, taken from the abbreviation of Long Range is a proprietary chirp spread spectrum modulation technique by Semtech. Meanwhile, the default LoRa MAC protocol used in LoRa networks is known as LoRaWan. In the open systems interconnection (OSI) reference model, LoRa is represented as the physical layer (layer 1), and LoRaWan is represented as layer 2 and layer 3 [15]. The carrier signal from chirp spread spectrum modulation of LoRa consists of chirps that is the signals with frequency increases or decreases over time. LoRa’s chirps enable the signal to transmit at long distances and demodulated even when its power is up to 20 dB lower than the noise floor [16]. Fig. 1 presents the Lora technology communication stack [13].
Fig. 1. Network layer of LoRa technology [13].
The performance in the communication of LoRa can be optimized by changing the selection of several LoRa physical layer parameters. These parameters are bandwidth, spreading factor, coding rate, carrier frequency and transmission power. The manipulation of LoRa physical layer parameters in LoRa communication is able to influence the effective bit rate of the modulation, its resistance to noise and interference, and its ease of decoding.
3 EXPERIMENT
SETUP
In order to evaluate the performance of LoRa, a series of experiments is done in a building at Faculty of Engineering, University Putra Malaysia. Fig. 2 shows the floor plan for the location of the receiver node and transmitter node. The experimental area covers three floors of the building where the location of the receiver node is fixed. It is located at the first floor in a room labelled as R in Fig. 2. Meanwhile, the locations of transmitter node are labelled as L1, L2, L3, and L4 at the first floor. Table 1 shows the location of all transmitter
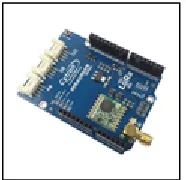
Location 8, and Location 9 until Location 12 are situated at the same coordinates with Location 1 until Location 4 respectively, but on different floors. The transmitter and receiver nodes used in this experiment are the Cytron LoRa-RFM Shield as shown in Fig. 3. This shield is designed using LoRa RFM95W LoRa module. An
Fig. 2. Location of transmitter node at the floor
omnidirectional antenna is used with 3dBi gain. For the transmitter node, the Cytron LoRa-RFM Shield is installed together with Arduino Uno Rev3 and powered by two 3.7V 1100mAh Li-Ion battery. Meanwhile for the receiver node, the shield is assembled together with Arduino and it is directly
Fig. 3. Cytron LoRa-RFM Shield.
connected to the computer for data collection. The
TABLE1
LOCATION OF TRANSMITTER NODE AT THE FLOOR
Floor Location
1st
Floor
Location 1 (L1)
Location 2 (L2)
Location 3 (L3)
Location 4 (L4) 2nd
Floor
Location 5 (L5)
Location 6 (L6)
Location 7 (L7)
Location 8 (L8) 3th
Floor
Location 9 (L9)
Location 10 (L10)
Location 11 (L11)
Location 12 (L12)
TABLE2
PARAMETERS FOR LORA NODE
Lora Parameter Value
Transmit Power (P) (dB) 14, 23
Frequency (F) (MHz) 919.0
Bandwidth (BW) (kHz) 125, 250, 500
Spreading Factor (SF) 7, 9, 11
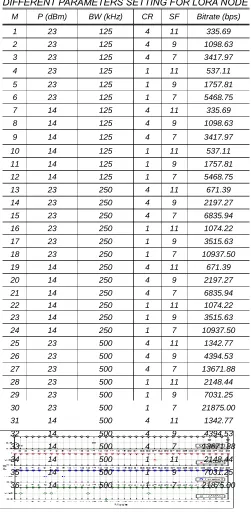
38 parameters. Table 2 shows the parameters of LoRa node and
its parameter values used during the experiment. The frequency, 919.0 MHz is chosen since the range of Malaysia LoRa frequency is from 919.0 MHz to 923.0 MHz. Table 3 shows the combinations of parameters for LoRa node. Each combination is known as Mode (M), where M = 1, 2,…, 36. The Mode is set to both transmitter and receiver node so that each transmission uses the same parameters for both nodes. For example, if the transmitter node is set in Mode 5, then the receiver node is set in Mode 5 as well. For each location, the transmitter node sent 20 packets data with the size of 8 bytes/packet and duty cycle of 5 seconds using Mode 1. Meanwhile, the receiver node is set to always listen to incoming data using the same mode which is Mode 1. When all 20 packets data have been received by the receiver node,
the Mode for both transmitter and receiver node is changed to Mode 2 and the process of sending the new 20 packets data is repeated until the last mode. Then, the transmitter node is moved to the next location. All the processes are repeated for the new location of the transmitter node. The performances of LoRa node in this study are evaluated using three metrics which are packet data throughput, RSSI (Received Signal Strength Indicator) and SNR (Signal to Noise Ratio). The packet data throughput is also known as packet receive ratio (PRR) where it shows the total packet data per time slot where the size of packet data is 8 bytes and the time slot is 5 seconds. The RSSI and SNR are recorded by the receiver node after it received the packet data from the transmitter node.
4 RESULTS
AND
DISCUSSION
4.1 Packet Received Ratio
The PRR is a ratio for the total number of successfully received packet data over the total number of transmitted packet data. The total number of transmitted packet data per mode is 20. The results below (Fig. 4 to Fig. 6) show the PRR for each mode with the transmitter node location, respectively. For overall PRR, the transmitter node at Location 2, 6, and 10 shows the value of PRR that is over 0.95 for each floor. Meanwhile, the PRR of all modes for location 1, 5, and 9 for each floor shows that there are more data loss occurred as the location of transmitter node is far from the receiver node.
Fig. 4. PRR for Location 1, 2, 3, and 4
Fig. 5. PRR for Location 5, 6, 7 and 8
TABLE 3
DIFFERENT PARAMETERS SETTING FOR LORA NODE
M P (dBm) BW (kHz) CR SF Bitrate (bps)
1 23 125 4 11 335.69
2 23 125 4 9 1098.63
3 23 125 4 7 3417.97
4 23 125 1 11 537.11
5 23 125 1 9 1757.81
6 23 125 1 7 5468.75
7 14 125 4 11 335.69
8 14 125 4 9 1098.63
9 14 125 4 7 3417.97
10 14 125 1 11 537.11
11 14 125 1 9 1757.81
12 14 125 1 7 5468.75
13 23 250 4 11 671.39
14 23 250 4 9 2197.27
15 23 250 4 7 6835.94
16 23 250 1 11 1074.22
17 23 250 1 9 3515.63
18 23 250 1 7 10937.50
19 14 250 4 11 671.39
20 14 250 4 9 2197.27
21 14 250 4 7 6835.94
22 14 250 1 11 1074.22
23 14 250 1 9 3515.63
24 14 250 1 7 10937.50
25 23 500 4 11 1342.77
26 23 500 4 9 4394.53
27 23 500 4 7 13671.88
28 23 500 1 11 2148.44
29 23 500 1 9 7031.25
30 23 500 1 7 21875.00
31 14 500 4 11 1342.77
32 14 500 4 9 4394.53
33 14 500 4 7 13671.88
34 14 500 1 11 2148.44
35 14 500 1 9 7031.25
Although Location 2 is the second nearest location, its overall PRR value is the highest than other locations especially
Fig. 6. PRR for Location 9, 10, 11, and 12
Fig. 7. RSSI for Location 1, 2, 3, and 4
Location 4, the nearest location. If the distance between the transmitter node and the receiver node is not the cause for the packet loss, then the obstacles exist between the locations may be the source for the occurrence. Location 9 that is located at the third floor shows the worst performance where the PRR is less 0.5 for about nine modes. This is because Location 9 has the highest distance to the receiver node. However, the overall packet data is still received by the receiver node using Mode 1 as shown in Fig. 5. The reason for this is because, Mode 1 is used to transmit data with the lowest data rate with low bandwidth and high spreading factor. In addition, high power is used to transmit data signal. The comparison of the power can be identified clearly when the transmitter node’s power is 23dBm and 14dBm. The same parameters are used in Mode 1 and 7 with different power. The PRR for the Mode 1 is higher than Mode 7 because more data can be received by the receiver node since higher power is used for the transmitter node.
4.2 Received Signal Strength Indicator (RSSI)
In this experiment, the average RSSI is considered as the sensitivity of the receiver node to receive packet data from the transmitter node. The value of RSSI recorded by the receiver node is for every packets node received. Fig. 7 to Fig. 9 depict the average RSSI for each mode at their respective transmitter node locations. Meanwhile, Table 4 lists the minimum, maximum and average RSSI values and the respective mode for each location according to the floor. Overall, based on the mean value of RSSI, the transmitter node at Location 2 of first floor, Location 6 of second floor, and Location 10
of third floor recorded high value of RSSI at the receiver node. This is followed by Location 4, 8, and 12, and then Location 3, 7, and 11. Finally, then the weakest RSSI value occurred at Location 1, 5, and 9. Although the transmitter nodes are placed at different floor, the pattern of RSSI value is the same for all levels.
At the 1st floor, the value of RSSI for the transmitter node at the Location 2 is the highest with the values of RSSI between 80.75 dBm to 97 dBm and an average value of -88.8047 dBm. However, Location 4 which has similar distance to the receiver node with Location 2 achieved slightly lower value of RSSI, between -87.45 dBm to -108.95 dBm with the average value of -95.7645 dBm. This shows that the communication for the
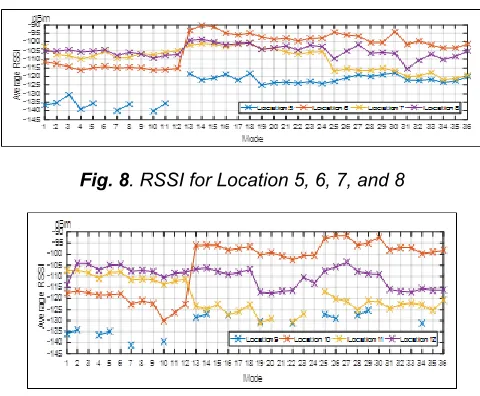
Fig. 8. RSSI for Location 5, 6, 7, and 8
Fig. 9. RSSI for Location 9, 10, 11, 12 TABLE 4
RSSI VALUES ACCORDING TO FLOORS Floo
r Location Min (dBm) Max (dBm)
Mean (dBm)
1st
1 -117.7500
(Mode 4)
-107.3500
(Mode 27) -112.1203
2 (Mode 28) -97.0000 (Mode 3) -80.7500 -88.8047
3 -106.7000
(Mode 28)
-95.4500 (Mode 14 &
15)
-101.7005
4 -108.9500
(Mode 34)
-87.4500
(Mode 1) -95.7645
2nd
5 -140.1765
(Mode 10)
-117.8421
(Mode 30) -125.6784
6 -116.3000
(Mode 4)
-90.2500
(Mode 14) -103.3238
7 -121.8400
(Mode 34)
-100.5500
(Mode 18) -109.5126
8 -115.6000 (Mode 31) (Mode 14) -98.6500 -105.2723
3rd
9 -141.2000
(Mode 5)
-125.4000
(Mode 29) -131.7101
10 -130.1000
(Mode 10)
-91.6500
(Mode 26) -105.1375
11 -131.0588
(Mode 19)
-107.2000
(Mode 2) -119.1516
12 -117.8000
(Mode 20)
-103.6667
40 transmitter node at Location 2 has less obstacles and
interference compared to transmitter node at Location 4. Meanwhile, on the same floor, Location 1 with the longest distance between the transmitter node and the receiver node shows a lower value of RSSI compared to other locations. This situation is expected because there are more obstacles and interference associated with long distance between the nodes.
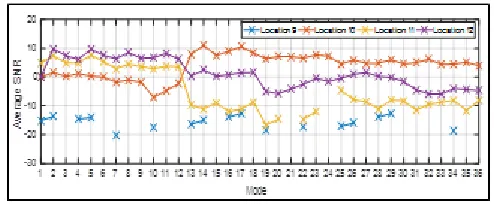
Fig. 10. Average SNR for Location 5, 6, 7 and 8
Fig. 11. Average SNR for Location 5, 6, 7 and 8
Based on Table 4, the pattern of RSSI value at Location 6 (second floor) and Location 10 (third floor) is different with the first floor. For both locations, Mode 1 to 12 show lower RSSI values compared to other modes in their respective level. This is because Mode 1 to 12 used bandwidth of 125 kHz. Although the transmitted power, the coding rate and the spreading factor values are changed, the RSSI values for Mode 1 to 12 show a big gap compared to other modes.
4.3 Signal to Noise Ratio (SNR)
SNR is used to compare the desired signal level with the background noise level. SNR is defined as the ratio of signal power to the noise power in decibels. If the value of SNR is higher than 0 dB, it indicates that the signal’s power is higher than noise. In this experiment, the SNR values are recorded when the transmitter node receives the data signal. Fig. 10 to Fig. 12 depict the average SNR for each mode at their respective transmitter node locations. Location 2 and Location 6 have the highest SNR values compared to other locations with the SNR value that is above 0 for all modes. Meanwhile for Location 10, the SNR values for Mode 1 to Mode 12 are much lower than the rest of the modes at the same location. This is due to the difference in bandwidth values where the bandwidth used for Mode 1 to Mode 12 is 125 kHz. Hence it can be concluded that the long distance between the transmitter and the receiver node using bandwidth of 125 kHz will result in lower SNR level. However, these SNR values are still acceptable as they are still above -10dB.
5 CONCLUSION
This paper presents a performance evaluation of LoRa at the indoor environment. A series of experiment are done at the indoor environment using Cytron LoRa-RFM Shield as LoRa
Fig. 12. Average SNR for Location 9, 10, 11 and 12
module with two nodes, transmitter and receiver node. Several LoRa parameters such as transmitted power, bandwidth, spreading factor and coding rate are varied in order to investigate their effect on physical layer performance. In addition, we have investigated the performance of LoRa in terms of RSSI, SNR, and packet data throughput at various transmitter locations. The results show that the performance of LoRa is mostly dependent on the configuration of transmitting power, bandwidth, spreading factor and coding rate. However, external parameters such as distance and obstacle also play an important role that affects the performance of LoRa.
6
ACKNOWLEDGMENT
This work was supported in part by University Malaysia Terengganu and Ministry of Education Malaysia under project no. 59466.
7
REFERENCES
[1] Abawajy, J. H. and Hassan, M. M. (2017) Federated Internet of Things and Cloud Computing Pervasive Patient Health Monitoring System. IEEE Communications Magazine. 55(1): 48–53.
[2] Montori, F., Bedogni, L. and Bononi, L. (2018) A Collaborative Internet of Things Architecture for Smart Cities and Environmental Monitoring. IEEE Internet of Things Journal. 5(2): 592–605.
[3] Kim, D. H., Lim, J. Y. and Kim, J. D. (2016) Low-Power, Long-Range, High-Data Transmission Using Wi-Fi and LoRa. Proceedings of 2016 6th International Conference on IT Convergence and Security (ICITCS). Prague, Czech Republic.
[4] Neumann, P., Montavont, J. and Noel, T. (2016) Indoor deployment of low-power wide area networks (LPWAN): A LoRaWAN case study. Proceedings of 2016 IEEE 12th International Conference on Wireless and Mobile Computing, Networking and Communications (WiMob). New York, NY, USA. [5] Kim, D. and Jung, M. (2017) Data Transmission and
Network Architecture in Long Range Low Power Sensor Networks for IoT. Wireless Personal Communications. 93(1): 119–129.
in the IoT and smart city scenarios. IEEE Wireless Communications. 23(5): 60–67.
[7] Pham, C. (2016) Low-cost, low-power and long-range image sensor for visual surveillance. Proceedings of The 2nd Workshop on Experiences in the Design and Implementation of Smart Objects - SmartObjects ’16. New York, New York, USA.
[8] Petajajarvi, J. et al. (2015) On the coverage of LPWANs: range evaluation and channel attenuation model for LoRa technology. Proceedings of 2015 14th International Conference on ITS Telecommunications (ITST). Copenhagen, Denmark.
[9] Georgiou, O. and Raza, U. (2017) Low Power Wide Area Network Analysis: Can LoRa Scale?. IEEE Wireless Communications Letters. 6(2): 162–165. [10]Pop, A.-I. et al. (2017) Does Bidirectional Traffic Do
More Harm Than Good in LoRaWAN Based LPWA Networks?. Proceedings of GLOBECOM 2017 - 2017 IEEE Global Communications Conference. Singapore [11]LoRa Alliance, I. (2016) LoRaWAN Regional
Parameters v1.1 REV B. https://lora-
alliance.org/sites/default/files/2018- 04/lorawantm_regional_parameters_v1.1rb_-_final.pdf. (accessed: 9 January 2018).
[12]Semtech LoRa Technology. Available at: https://www.semtech.com/technology/lora. (accessed: 09 Jan 2018).
[13]LoRa Alliance (2015) A technical overview of LoRa and LoRaWAN. https://www.lora-alliance.org/technology. (accessed: 9 January 2018). [14]Hope Microelectronics Co. (2014)
RFM95/96/97/98(W) - Low Power Long Range
Transceiver Module.
http://www.hoperf.com/rf_transceiver/lora/. (accessed: 09 Jan 2018).
[15]Ayele, E. D. et al. (2017) Performance analysis of LoRa radio for an indoor IoT applications. Proceedings of 2017 International Conference on Internet of Things for the Global Community (IoTGC). Funchal, Portugal.