489
0020-7454/02 $12.00 + .00 DOI: 10.1080/00207450290025608
Brief Communication
Received 3 January 2002.
Address correspondence to Prof. Dr. Uner Tan, Department of Physiology, BlackSea Tech-nical University Medical School, Trabzon, Turkey. E-mail: unertan@meds.ktu.edu.tr or unertan100@ netscape.net
VALIDITY OF SPECTRAL ANALYSIS
OF EVOKED POTENTIALS
IN BRAIN RESEARCH
ALEXANDER V. KRAMARENKO
Central Clinic Hospital N5 Kharkov, Ukraine
UNER TAN
Department of Physiology BlackSea Technical University Medical School Trabzon, Turkey
The averaged electronencephologram (EEG) response of the brain to an external stimulus (evoked potential, EP) is usually subjected to spec-tral analysis using the fast Fourier transform (FFT), especially to dis-cover the relation of cognitive ability to so-called brain dynamics. There is indeed a discrepancy between these two systems, because the brain is a highly complex nonlinear system, analyzed by a linear system (FFT). We present in this work some inaccuracies that occurred when EPs are subjected to spectral analysis, using a model signal. First of all, the EP power spectra depended upon the number of samples used for averag-ing; the input EP (model signal) and the output EP (from the system) seemed to be similar in forms, but they exhibited completely different spectral power curves. It was concluded that the spectral analysis of evoked responses by using FFT (linear system analysis) in relation to brain (highly complex nonlinear system) may mislead neuroscientists.
Evoked potentials (EPs) may be defined as the changes the elec-troencephalogram (EEG) undergoes when a certain event occurs, e.g., when a sensory stimulus is applied (see Quiroga, Sakowitz, Basal, & Schurmann, 2001). Jervis, Nichols, Johnson, Allen, and Hudson (1983) have established that auditory evoked potentials (AEPs) are due to the superposition of an additional signal elicited by the stimulus to the background EEG (superposition or additivity). These authors have also developed a physical model in terms of the vector addition of the harmonic DFT (discrete Fourier transform) compo-nents of the additive signal to the corresponding compocompo-nents of the background EEG. Accordingly, Basar, Demiralp, Schurmann, Basal-Eroglu, and Ademoglu (1999b) have later hypothesized that event-related potentials (ERPs) may be superpositions of stimulus-evoked and time-locked EEG rhythms reflecting response properties of the brain.
subtrac-tion of the large number of window mainlobes and sidelobes (spec-tral leakage; Jervis et al., 1989). Karakas and Basar (1983) have investigated the high frequency components of the visual EPs using the FFT and unexpectedly obtained 200-, 400-, 700-, 1200-, and 2200-Hz positions in the amplitude-frequency characteristics; they have concluded that the response activities of 200 Hz and 2200 Hz are unique to the visual system.
Concerning the clinical use of the spectral analysis of the EPs, Khachunts et al. (2001) have performed a comparative spectral analysis of the short latency auditory EPs in normal and neurological pathol-ogy (neuroma, concussion of the brain, and epilepsy), and found rather specific pattern of changes in the power of the medium- and high-frequency components of these evoked responses. Connolly (2000) has reported that performance on adapted neuropsych-ological tests can be measured using ERPs: “a number of tests have been adapted and performance assessed using ERPs.” Connolly also noticed the essentially descriptive nature of this approach and its linkage to fundamentally epiphenomenal features of pathologies, and presented an example showing the attentional abnormalities in ERPs of schizophrenics, which was already shown 40 years ago using “galvanic skin response.”
Reinvang (1999) has stated that “although diagnostic use of ERPs must be guarded because of limited standardization and validation, information-processing analysis with ERPs may aid significantly in interpretation of behavioral data.” EEGs and EPs are used in cogni-tive brain research with the appropriate speed to capture the neural information processing compared to brain imagery technology (Se-galowitz, 2000). However, the current theory suggests that at least 128 electrode sites are needed for accurate localization (Srinivasan, Tucker, & Murias, 1998; Gevins, Leon, Smith, Le, & Du, 1995). Despite that, there are many studies using only a few pairs of re-cording electrodes to investigate the relation of cognition to brain evoked responses (e.g., Basar, Schurmann, & Sakowitz, 2001; Khachunts et al., 2001; Quiroga, Sakowitz, Basar, & Schurmann, 2001). Meta-bolic systems, such as positron emission tomography (PET) and functional magnetic resonance imaging (fMRI), localize well but work too slowly.
most models propose explicitly or implicitly that the brain’s organi-zation for cognition is of a linear, deterministic type, “but this model cannot grasp the entire picture and complexity of neuroscience” (Melancon & Joanette, 2000). In the present work, we have at-tempted to show how misleading a spectral analysis of the EPs applying the linear system analysis to a highly complex nonlinear system would be, as we frequently encounter in the scientific litera-ture (e.g., Basar, Basar-Eroglu, Karakas, & Schurmann, 1999a).
The EPs are generally subjected to mathematical analysis—spectral analysis. That is, the EPs are recorded, averaged, and their fre-quency components are then analyzed usually using the FFT. This, in turn, creates a paradoxical situation when immovable limitations conditioned by the EP registration method itself are ignored. For example, there is an analysis of the positive and negative peaks of small amplitude without taking into account a noise value, which is always present in the registered signal. Noise is an integral part of the method of EP recording procedure. For a coherent receiver in-cluding the EP recording system, the EEG activity is noise in addi-tion to the noise of the recording electrodes and amplifiers (white noise with a uniform frequency distribution). That is why any filter limiting-frequency band eliminates only some part of the noise energy. The noise level of the EP is equal to EEG level divided by square root of the registered stimulus quantity. If the registered stim-ulus quantity is infinite, then the noise level is zero, but it never occurs.
regis-tration through averaging method (strictly speaking the correlation technique) has a nonlinear amplitude-frequency response, which is practically ignored during the course of spectral analysis of the EPs.
METHODS AND RESULTS
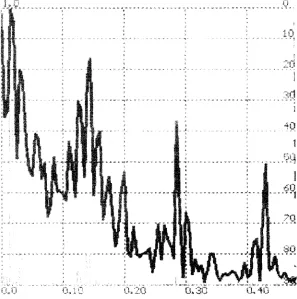
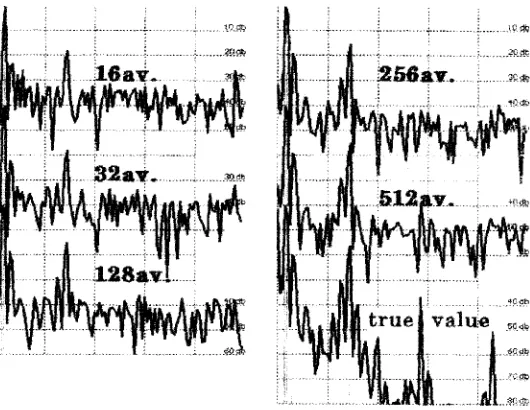
Let’s try (without questioning the physiological value of the EP method) to study the situation with the help of a mathematical model, which will always be better than the real ones, because the model does not take into account the errors of the EEG registration, the noise of the electrodes and amplifiers will be zero, and there are no artifacts that unavoidably exist in any record. For example, there is a test signal composed of a small number of harmonic components (Figure 1). Let us get its spectrum (Figure 2). Now we will try to isolate this signal from the combination of pseudonoisy and pseudo-harmonic components that imitate the EEG. Let us predetermine the ratio of amplitudes of the EEG imitator and the EP imitator as 3:1 (actually this ratio is much worse). We will also take into consider-ation the fact that averaging realizconsider-ation is a bit shorter than the EP. As seen in Figure 3, we will obtain entirely different spectra de-pending upon the number of samples to be averaged. After accumu-lation of 512 samples, let us compare the initial test signal with the obtained signal, as well as their spectra.
As illustrated in Figure 4, there is a considerable difference be-tween the input and output spectra. These results show that the “hash” significantly changes the spectrum of the test signal, and if the level is lower than 40 db, it is impossible to say anything about the spectrum. Also note that this is the spectrum for 512 averaged samples. If the quantity of stimuli is less than 512, the result will be
even worse—the form of the test signal after extracting from the spectrum also changes, but it is less visible; the zero harmonic, that is, the constant component of the EP, is suppressed in the spectrum. These distortions in the EP form and its spectrum are by no means chimeras. They are even bigger in real conditions.
Now let us consider the problems that occur as a result of non-linear (comb) amplitude-frequency response of the whole-tract reg-istration. It should seem that this problem can be easily solved by predetermination of stimulus pulses during the temporal values deter-mined by a pseudorandom-number generator. This is actually so for signals that are not correlated with the EP, but for any changes in
FIGURE 3. Dependence of the spectrum on the number of sweeps used for averaging from 16 to 512 sweeps.
response of brain structures to an external stimulus, this method will be ineffective (Figure 5).
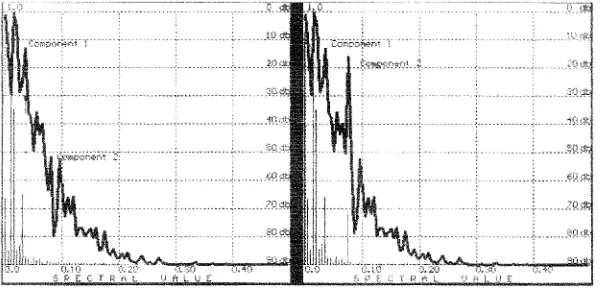
Let us study the simplest case and suppose that there is a true EP composed of two additive monochromatic components (Figure 6). Let us assume that one of them (Figure 6, top) has not changed a phase during processing, and the other one’s angle is changed by almost 180 degrees. We will register the EP by a standard method, that is, we will average 512 samples and get a spectrum. The result (Figure 7) is irretrievable; component 2 is suppressed by 30 db! This is a result of nonlinearity of the amplitude-frequency response (compare the true spectra on the right with the obtained one on the left).
CONCLUSIONS
FIGURE 4. The initial test signal (above: input EP signal), the obtained signal (out-put EP signal), and their spectra (left: for in(out-put test signal; right: for the out(out-put signal).
it may be concluded that a result from the spectral estimation of the EP depends on the quantity of the samples (number of epochs) and on the ratio of the levels of the spontaneous EEG and EP. The constant component cannot be estimated by the results of the spec-tral analysis; each specspec-tral component is determined not by its true
FIGURE 6. EP signal (top: no phase change) composed of Component 1 and Compo-nent 2, summary of evoked potential data (angle, 180 degrees), and its spectrum showing the peaks for the Component 1 and Component 2.
value, but by the results of its multiplication to cosine of half of the accumulated angle of swivel of phase of this component for the time of registration. However, we never know (and will not know) to which angle the phase of each spectral component has swivelled in the process of EP registration. Briefly, we think that the math-ematical treatment of EPs, such as spectral analysis to elucidate physiological mechanisms would improve research papers and/or confirm a hypothesis that a scientist likes for some reason. On the other hand, it is also conceivable that treating the true brain dynam-ics as a highly complex nonlinear system may help us to approach and understand so-called higher brain functions such as perception, attention, learning, memory, and even conscious experience (Free-man, 1995).
REFERENCES
Basar, E., Basar-Eroglu, C., Karakas, S., & Schurmann, M. (1999a). Are cognitive pro-cesses manifested in event-related gamma, alpha, theta, and delta osscillations in the EEG? Neuroscience Letters, 259, 165–168.
Basar, E., Demiralp, T., Schurmann, M., Basar-Eroglu, C., & Ademoglu, A. (1999b). Oscillatory brain dynamics, wavelet analysis, and cognition. Brain and Language, 66, 146–183.
Basar, E., Schurmann, M., & Sakowitz, O. (2001). The selectively distributed theta sys-tem: Functions. International Journal of Psychophysiology, 39, 197–212.
Connolly, J. F. (2000). Applying cognitive research in the twenty-first century: Event-related potentials in assessment. Brain and Cognition, 42, 99–101.
Freeman, W. J. (1995). Societies of brains. Hillsdale, NJ: Lawrence Erlbaum Associates. Gevins, A., Leon, H., Smith, M. E., Le, J., & Du, R. (1995). Mapping cognitive brain function with modern high-resolution electroencephalography. Trends in Neurosciences, 18, 429–436.
Jervis, B. W., Coelho, M., & Morgan, G. Q. (1989). Spectral analysis of EEG responses. Medical & Biological Engineering & Computing, 27, 230–238.
Jervis, B. W., Nichols, M. J., Johnson, T. E., Allen, E. M., & Hudson, N. R. (1983). A fundamental investigation of the composition of auditory evoked potentials. IEEE Trans-actions on Bio-Medical Engineering, 30, 43–50.
Karakas, S., & Basar, E. (1983). High-frequency components of human visual evoked potentials. International Journal of Neuroscience, 19, 161–172.
Khachunts, A. S., Vaganyan, L. G., Tatevosyan, N. E., Tatevosyan, I. G., Kostanyan, E. G., & Manasyan, K. A. (2001). Spectral characteristics of short-latency auditory evoked potentials in neurological diseases. Human Physiology, 27, 585–590. Melancon, G., & Joanette, Y. (2000). Chaos, brain, and cognition: Toward a nonlinear
order? Brain and Cognition, 42, 33–36.
Reinvang, I. (1999). Cognitive event-related potentials in neuropsychological assessment. Neuropsychology Review, 9, 231–248.
Segalowitz, S. J. (2000). Dynamics and variability of brain activation: Searching for neu-ral correlates of skill acquisition. Brain and Cognition, 42, 163–165.