RURAL WOMEN'S ORGANISATION, TRAINING AND WORK IN
THE CONTEXT OF POVERTY AND CATASTROPHE:
A CASE STUDY OF DHAKULY VILLAGE IN BANGLADESH
BY
SEEMA AGARWAL
PhD THESIS 1985
LIST OF CHAPTERS AND APPENDICES
I.
Poverty, Basic Needs and DevelopmentII.
Women's Poverty and Development PolicyIII. A Problem of Measurement: A Look at the Methodologies for Evaluation of Women's Work
IV. A Poverty Profile of Rural Bangladesh
V. Women's Organisation, Training and Work in Dhakuly Village, Bangladesh
VI. Poverty and Catastrophe: A Look at the Need for Protection Against Catastrophic Occurrences in Rural
87
I I I
136
161
Bangladesh 235
VII. A New Approach to Measurement Approach
The Economic Viability
VIII. Applications of the New Approach, Results of the Field Survey, and Hain Conclusions
269
298 Appendix I. Profiles of Rural Poverty: Evidence from Asia 369 Appendix II. Additional Data on Population and Economic 389
Situation of Bangladesh
Appendix III. Illustration of the Calculations for Multiplier
Appendix IV.
Appendix V.
and PACE-Score 394
Additional Details about the Calculation and Interpretation of the Insecurity Index
Copy of Questionnaire in English and Bengali
398
DETAILED LIST OF CONTENTS
CHAPTER I : POVERTY, BASIC NEEDS AND DEVELOPMENT
1. II.
III.
IV.
Development and l~SlC ~eeds
Poverty and BaS1C Needs
1. The relative inequality approach L. The absolute income approach
3. The absolute poverty approach
4. The relat1ve poverty approach
The Income-based measurement of Poverty
A Prof1le Of Poverty - Describ1ng the Poor
1 • The household 1S poor
L. The household is physically weak
3. The household is isolated
4. The household is vulnerable 5. The household is powerless
V. Significant trends and facts observed about poor
communities within poor nations
VI. General conditions of poor households within poor
rural communties
VII. Other basic issues
1. Employment and unemployment
2. Consumption, cost of living and entitlement
3. Population and food
4. Inequality and the structure of the economy
CHAPTER II : HOl1EN' S POVERTY AND DEVELOPHENT POLICY· Page 89
91
91
94
97I. Acceptance of women's issues as a Development policy issue II. Two approaches to policy :
1. Equity-oriented approach 2. Poverty-oriented approach III. \'1omen, Poverty and Development
a) First theme: Home production - its value and cost 97
b) Second theme : ITob opportunities - supply and demand 100 c) Third theme: Less education and training for women 102 IV. The findings of an evaluation of women's participation
in the home economy
V. The household as unit of analysis
103
105
CHAPTER III : A PROLLEl1 OF NEASURENENT : A LOOI\: AT THE ~1ETHODOLOGIES FOR EVALUATION OF \\'ONEN'S HORK
I. l-leasures of women's work :
A. Present practices : the counting of women
113
E. Definitional biases
114
C. Homen "unaccounted for"
118
D. Key questions in the evaluation of women's ,york 119 II. Approaches to measurement of labour force participation
(including women) :
A. Direct Inquiry approach
B Production Function approach C. Nultiple Regression approach D. Expenditure approach
E Time as a measure of women's work F. Hoving average approach
G. Economic Viability approach
III. The basic needs framework and women's contrbution
CHAPTER IV : A POVERTY PROFILE OF RURAL BANGLADESH I. The setting
II. III.
IV. V.
VI.
Hlstorlc and demographlc sltuation of l~ngladesh The lncidence of poverty
a) The poverty line b) Real wages
The process of increasing impoverishment Rural employment profile :
a) Labour force participation b) Najor occupations
c) Wage rates
Socio-economic stratificatlon
CHAPTEi< V : Vim-lEN' S ORGANISATION, TRAINING AND l'JOR}Z IN DHAKULY VILLAGE, LANGLADESH
I. UnderlYlng lssues of women's organlsation, tralning and work
II. The status and the socio-economic situation of women in Bangladesh
III. IV.
v.
VI.
The domestic tasks of rural women
Nul tiple constra ints in the 1 i ves of rural 'vomen a) the technological and structural constraints b) the social and cultural constraints
Dhakuly village - The social context LRAC - The organisational context : a) history and approach to development b) phases of DI~C's programme
VII.
VIII.
IX.
Women's organisation...: The BRAC approach a) what seems to work
b) what seems not to work
c) what needs to be designed and tested d) methods of organisation
Women's training and work in Dhakuly village - the .bRAC effort : kinds of training and work
a) production enhancement schemes: horticulture
animal husbandry - poultry rearing
210 211 211 214 217 218 218 220 221
b) employment expansion schemes : 223
traditional craft development - block printing 226 grass basket/mat making, silk culture
agriculture
Strengths and Weaknesses of
BRAe
227 228 '. 231
CP..APTE;~ VI : POVERTY AND CATASTROPHE : A LOOE. AT THE NEED FOR PI~OTECTION AGAINST CATASTROPHIC OCCUl~RENCES IN HURAL BANGLADESH I . Definition of catastrophe and discontinuity
II. Justification for need to look at catastrophe in development
I I I .
IV.
V.
Prevalence and types of catastrophies in t-:angladesh
in Dhakuly village
Implication of catastrophic occurrences - a look at the causes and the damage
What are the questions to be asked ?
VI. The basic Needs approach to Development VII. Some enlightening remarks
VIII. Definition of protection against catastrophe
IX. \..;hat has been the role of BAAC in guarding against catastrophic occurrences
CHAPTER VII : A NE\'J APPROACH TO HEASUREHENT THE ECONOHIC VIAj:ILITY APPROACH
~vhy not Income ?
a) Income and women's contribution b) Income and poverty
c) Income and baslc needs d) Income and catastrophe II. \'I'hy Catastrophe ?
III. Need for a new and better measure
IV. The Economic Viability Approach to measurement
247 255 263 266 272 272 273 274 274 275 276 278 a) Determinants of Economic Viability 278
b) Components of the PACE-Score 280
c) General method for calculating the PACE-Score 281 d) Use of multiplier and spilloever effect
e) ~ (QMM€I'\\- 0.... the.. wc.i8"'T~ [,.\~ed
V. component-wlse descrlptlon of the PACE-Score VI. The Total PACE-Score
CHAPTER VIII : APPLICATIONS OF THE NEW APPROACH, RESULTS OF THE FIELD SURVEY, AND MAIN CONCLUSIONS
Demographic particulars of Dhakuly village a) Four sub-groups of households
b) Distribution of population in each sub-group by sex
II. III. IV. V. VI. VII. VIII. IX. X. Page
c) Age distribution of population 303
PACE-Score as the main source of survey results 305 PACE-Score and its components in the Sub-groups 307 PACE-Score ln ascending order of the Total Score 312 PACE-Score ln ascending order of the Asset Score 320 Further details regarding the role of Assets : 324
a) Average land owned per household 325
b) Average land owned per capita 327
c) Average homestead owned per household 329 d) Average homestead owned per capita 331 e) Average other productive assets owned per household333 f) Average other productive assets owned per capita 335 g) Total productive assets owned by sub-groups 337 Quantitative and qualitative components of the
Female score
New applications of the PACE-Score and the concept of the 'Security Line'
Introducing the 'Insecurity Index' MAin conclusions :
a) conceptual and methodological
b) Conclusions derived from the PACE-Score and the Field survey
338 ·347 352 355 355 356
c) Operational conclusions 364
APPENDIX I PROFILES OF RURAL POVERTY : EVIDENCE FROM ASIA 369 APPENDIX II
APPENDIX III
APPENDIX IV
APPENDIX V
ADDITIONAL DATA ON POPULATION AND ECONOMIC
SITUATION OF BANGLADESH 389
ILLUSTRA.TION OF THE CALCULATIONS FOR MULTIPLIER AND PACE-SCORE
ADDITIONAL DETAILS ABOUT THE CALCULATION AND INTERPRETATION OF THE INSECURITY INDEX
COpy OF QUESTIONNAIRE IN ENGLISH AND BENGALI
394
LIST OF TADLES, FIGURES, GRAPHS, SCATTERS AND CHARTS-·
LIST OF TAbLES
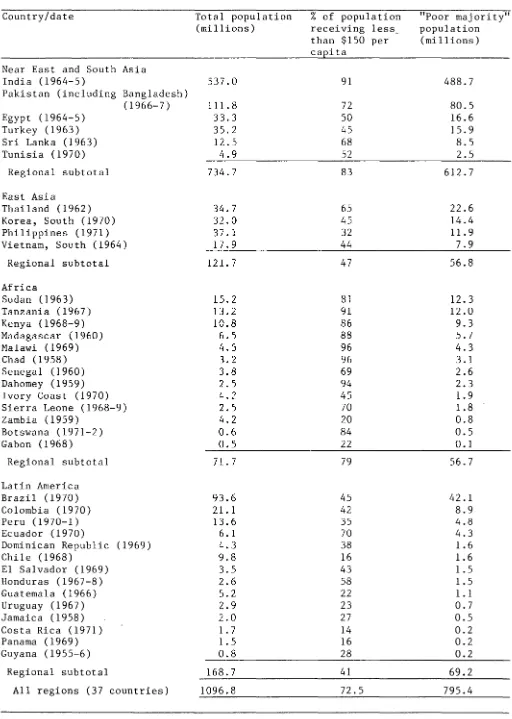
1.1 Poor niajori ty populations in several developing countries
31
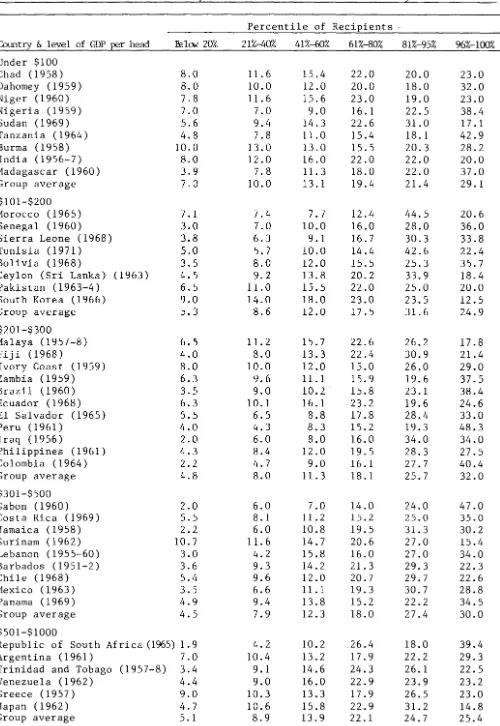
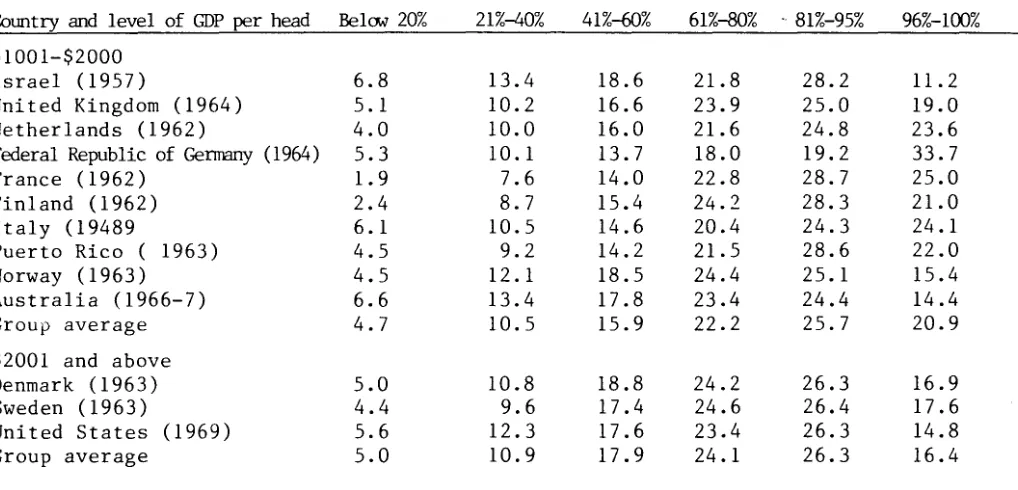
1.2 Sizedistribution of personal income before tax in fifty
1.3 1.4
1.5
3.1
4.1
six countries
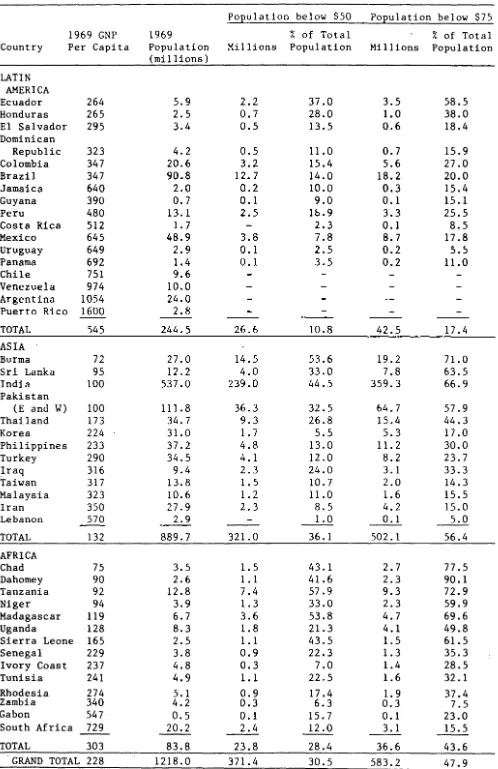
Estimates of population below Poverty line in 1969 Growth of population (1960 - 73) and food production
(1952 - 74) per cent per annum Growth of GNP per head 1960 - 73
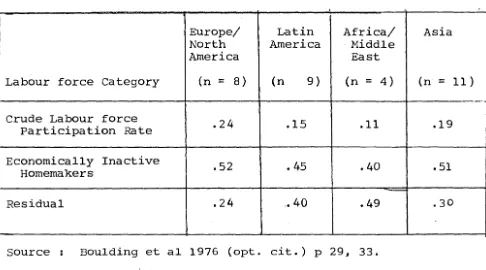
Regional means of female labour force participation rates and economically inactive homemakers and residual Incidence of poverty in Bangladesh (percentages)
4.2 Distribution of major occupations and status of rural labour force - 1980
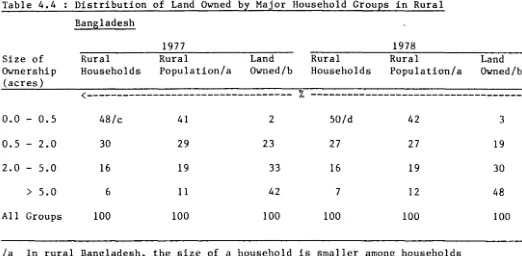
4.3 Average daily wage rates of workers - rural areas 4.4 Distribution of land owned by major household groups
13.1
3.2 8.3 8.4
in rural Bangladesh
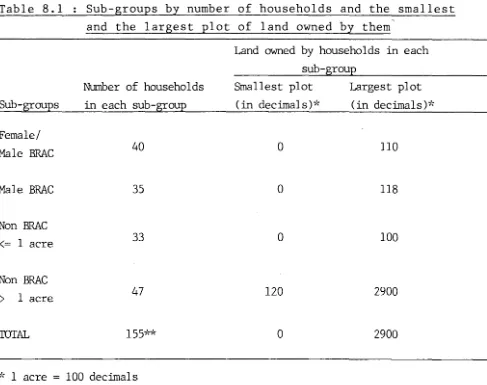
Sub-groups by number of households and the smallest and the largest plot of land owned by them
Sex distribution of population of Dhakuly village AgE! aistribution of population
Distribution of PACE-Score in Dhakuly village by components and sub-groups
33
41 80 80118
147153
155
158
301
302303
3088.5 Female participation in economic activities 311 8.6 Total PACE-Score in ascending order and the contribution
of Assets, Males and Females t~ i t : both in absolute
313
8.7 Average values of different kinds of assets by sub-groups
8.8 Asset scores in ascending order with corresponding Female and Male scores
8.9 Distribution of Land owned by Slze of land owned per household
8.10 Distribution of land owned by value per capita In Dhakuly village
8.11 Distribution of homesteads owned by size of homestead per household
8.12 Distribution of homestead owned by value per capita 8.13 Distribution of other productive assets owned by
househOlds by their value
8.14 Per capita distribution of other productive assets by value
8.15 Distribution of all productive assets in Dhakuly village 321
Page
322
325
327
329
331
333
335
including land, homestead and other assets : Values
337
of assets by sub-groups
8.16 Average female score and its quantitative and
qualitative components by sub-groups of households 341 8.17 Distribution of females according to literacy and
level of education 343
8.18 Distribution of males according to literacy and level
of education 344
8.19 Attendance in the local primary school by sub-groups
of househOlds 345
8.20 Acceptance of family planning by sub-groups of householdsJ46
8.21 Distribution of househOlds In four sub-groups according
Al.l Income shares of decile groups 384 Al.2 Reasons given for sales of land and for outstanding debts 385 Al.3 Reasons given for sales of land by landholding size 386 Al.4 Relative inequality - Gini coefficints of income 387
distribution in latin America
Al.5 Rural population in poverty in Latin America 387 Al.6 Rural Africa - some estimates of inequality in rural areas 388 AI.7 Gini coefficients of concentration in the distribution
of landholding in selected countries 389
A3.1 Distribution of households by value of land per capita 396 A3.2 Calculation of PACE-Score for land owned by each
household in Dhakuly village A4.1 Derivation of the Gini ratio
LIST OF FIGURES
397 401
1.1 The deprivation trap 64
1.2 Food output per head 1955-74 79
4.1 Real wages in Rural Bangladesh 148
A4.1 Lorenz curve for PACE-SLore of households of Female/Male
BRAC sub-group 402
LIST OF GRAPHS
1. Total PACE-Score in ascending order and the contribution
2. Total PACE-Score in ascending order and the contribution of Assets, Eales and Females to i t
terms
: in percentage
3. Asset scores in ascending order with corresponding Female scores
LIST OF SCATTERS
:-
1-2.
3.
Female score as percentage of total score Asset score as percentage of total score Male score as percentage of total score
LIST OF CHARTS
:-1 .
2.
3.
4.a
Gross Natlonal Product, per head i973
Growth in income and populatlon The domlnance of agrlculture
The share of rlch and poor ln national lncome
4.b Percentage of lncome recelved by poorest 40 per cent ot households
5. The advance of poverty : percentage Of the rural populatlon llvlng above and below the poverty llne
6. Cereal output (Kg) per head 1~5S - 14
7. Percentage ot farming households wlth less than 1 acre of land
8. The rlslng number Of landless ln Indla : agrlcultural labourers as percentage of the rural labour force,
19bU and 1~7U
9.
10.
Fluctuatlons In earnlngs : changes In real daily wage rates of agrlcultural labourers
The growth of lnequallty per cent In rural lncome
shares of the poorest 20
383
CRii.PTER 1
Chapter 1: Poverty. Basic Needs and Development
I Development and Basic Needs. II Poverty and Basic Needs.
1. The relative inequality approach 2. The absolute income approach 3. The absolute poverty approach 4. The relative poverty approach
III The Income-based measurement of poverty.
IV A Profile of Poverty - Describing the Poor.
1. The household is poor
2. The household is physically weak 3. The household is isolated
4. The household is vulnerable 5. The household is powerless
V Significant Trends and Facts Observed about Poor Communities within Poor Nations.
VI General Conditions of Poor Households within Poor Rural Communities.
VII Other Basic Issues.
1. Employment and Unemployment
2. Consumption, Cost of Living and Entitlement 3. Population and Food
4. Inequality and the Structure of the Economy
30 36 36 38 49 50 56 59 60
61
62 62 66 6870
70
7678
Development and Basic Needs
" 'Development' means the process of moving away from 'under-development', of rising out of poverty
"z
thus wrote GunnarMyrdal in 1968 in his classic book 'Asian Drama'. The hope from 'development' today, almost two decades later, is still very much the same. From the earliest days when development planning was attempted in many of the developing countries, raising the
standard of living of the poorest section of the population to an acceptable level has been one of the major goals, explicitly
stated as such in the development plans in some countries and
implicit in others. However, over the three decades of experience, the perceptions of the strategies to be pursued in trying to
achieve this goal have changed. (1)
The early development plans aimed at accelerating the rate of
growth of real national income, focusing essentially on the process of capital accumulation and its allocation - in other words, the growth of GNP - was regarded as the main objective or index of development. The question of how the benefits of growth in
national income were shared by different socio-economic groups in the society was not a major consideration in those early days, and the question was infrequently raised. One reason for this neglect was, of course, the belief that even the poorest will benefit from growth, that there will be an automatic 'trickle-down' of the benefits of economic growth to the poorest segments of the population; "they assumed, in other words, that increases
as industrialisation, agricultural productivity, physical overhead capital, investment, and per capita GNP were closely associated
with increases in the extent of political and economic participation" (2). T N Srinivasan suggests (3) that perhaps the main reason for this neglect of specific redistributive policies in development planning of the early stages, was that "in the framework of a mixed economy that excluded any revolutionary restructuring of production and exchange relations, excessive emphasis on redistri-bution at an early stage in the growth process was thought to
retard growth and hence the long-run feasibility of sustaining any appreciable increase in the levels of living of the poor"; as indeed, Gunnar Myrdal also wrote a decade earlier (4), "it is commonly believed that substantial improvements in the levels of living must be postponed for some time in order to permit
capital accumulation and even higher productivity and levels of living in the future."
The conviction that sustained and rapid growth is the desirable route toward a better life for the poor countries as well as the poor in these countries, was indeed shared by the major aid donors of that time. The view distinc~ly was that once the poor countries reached the stage of sustainable and sustained growth, that is, the "take-off" stage in the terminology of the times (see Rostow 1960), they would increasingly look like the mature economies of
~---.---~-(2) Adelman and Morris (1973) 'Economic Growth and Social Equity in Developing Countries' Stanford University Press.
(3) T N Srinivasan (1977) , Development, Poverty and Basic Human Needs: Some Issues' World Bank Reprint Series no. 76.
the West. Furthermore, the late start of these countries would enable them to take advantage of modern technology and aid would shorten conslderably for them the period needed to reach the take-offs as compared to the historical experience of the mature economles. Aid was viewed thus as helping this process of
modernisation without revolutionary change. (5)
Since the mid-sixties however, development specialists have begun to realise that development plans did not work in the expected way. Perhaps Myrdal (1968) best stated the case against the uncritical use of traditional economic concepts and theories in poor nations when he observed that " Economic theorists, more than any other social scientists, have long been disposed to arrive at general propositions and then postulate them as valid for every time, place and culture. There is a tendency in
contemporary economic theory to follow this path to the extreme .. .. when theories and concepts designed to fit the special
conditions of the Western World - and thus containing the implicit assumptions about soclal reality by which this fitting was
accomplished - are used ln the study of underdeveloped countries, where they do not fit, the consequences are serious." (6)
Indeed, the consequences were serious. In 197~, exactly a decade after Myrdal wrote those words, Robert S McNamara was to write these words in the foreword to the World Development Report of the World Bank : "The past quarter century has been a period of
(5) For readings on the role of Aid, see among others, Hans Singer and Javed Ansari 'Rich and Poor Countries', George Allen and Unwin, London 1977 ; Robert L Rhodes (ed.)'Imperialism and Under-development',Monthly Review Press, 197U
unprecedented change and progress in the developing world. And yet, despite this impressive record, some eoo million individuals continue to be trapped in what I have termed absolute poverty : a condition of life so characterised by malnutrition, llliteracy, disease, squalid surroundings, high infant mortality, and low life expectancy, as to be beneath any reasonable definition of human decency."
In fact, doubts had begun to be raised well before these words
of Robert S McNamara, as to whether in fact the poor had benefitted from the growth in national income achieved in the 1950's. Prime Minister Jawaharlal Nehru of India was one of the earliest to vOlce doubts about the impact of such strategies on the poor. The Committee on Distribution of Income and Levels of Living was appointed by the Government of India in 1960 to inquire into the changes in levels of living during the First and Second Plans, to study the trends in distribution of income and wealth, and in particular to ascertain the extent to which the operation of the economic system has resulted in concentration of wealth and means of production. (7). One of the first papers, with an explicitly stated objective of providing a minimum level of living for the masses of poor people by the end of the Fifth Indian Five-Year
Plan (1975-76), was produced in 1962 and the Fifth Plan incorporated a minimum needs programme. (7c). Furthermore, these doubts and
reorientation of thinking was accompanied, by the middle and late 1960's, with a growing disenchantment with foreign aid.(e).
(7) a. Government of India, The Report of the committee on Distribution of Income and Levels of Living : Part I Planning Commission, New Delhi, February 1964.
b. Government of India, A Technical Note on the Approach to the Fifth Five-Year Plan of India, 1974-79; Planning Commission, New Delhi, April 1973.
The Twelfth World Conference of the society for International Development, held in ottawa in 1971, further emphasized that the focus in economic development had been on gross national products, and that the result had been increased poverty for most of the developing world. According to the report, there were two major false steps in such development. " The first
step involves the focus on per capita income as the aggregate measure of wealth,worrying about how much is produced and how fast l t is produced rather than what is produced and ho~ j t J~
distributed. The second mistake is to assume that income distribution policies can be divorced from growth policies. Once production is organized to exclude large numbers of people and support a technological elite, which is the pattern in most countries, i t becomes impossible to redistribute income to those not participating. The pattern of consumption and distribution of goods is built into the pattern of production."
Adelman and Morris added further fuel to this fire in 1973 when they wrote: "Anyone concerned with the welfare of the world's underprivileged people must recognise that business can not continue as usual in the development community. Development policies that ought in principle to have made for a more
equitable distribution of income have served merely as additional instruments for increasing the wealth and power of existing
elites. Even more serious, new elites, many of whom owe their power to development programmes, have become adept at manipulating economic and political institutions to serve their private ertds ..
.. Without new institutions and policies specifically designed to
improve the lot of the poor, there is no realistic chance of social justice in the under-developed world of our time." (9)
This concern about the distributional aspects of growth was reflected further in appeals by the International Labour Office
(ILO) and the World Bank in the 1 ~rJU' s, to make the creation of productive employment opportunities, rather than aggregate income growth, a primary objective of policy. The ILO initiated work on strategies with an explicit focus on employment (lU), and the World Bank supported emphasis on redistribution with growth. "A fundamental redirection of development strategy" was called for consisting of a rural strategy that "focuses on increasing the productivity of the small farmer and the self-employed
through better access to land, water, credit, markets and other facilities" and an urban strategy of "(restructuring) the modern sector to make i t resp6n~ive to the opportunity cost of labour and capital ... (and) policies designed to reach the self-employed and to make small-scale producers more effi~ient." (11)
This emphasis emerged due to the percieved 'imperfections' that stood in the way of an improved allocation of resources, with benefits to the poor. These 'imperfections' were largely to do with jobs/income-earning opportunities. In the towns, access to
jobs in organized industry were restricted, so that the majority had to eke out a miserable existence by work of low productivity
--'''~77-:;----~::---:'~~~----:-:----:--- (9) Adelman and Morris' 1973, apr cit.
(lQ) ILO 1972, 'Employment, incomes and Equality-a strategy for increasing productive employment in Kenya'
ILO 1974, 'Sharing in Development - A programme of Employment, Equity and Growth for the Philippines'
in the 'informal sector. In the countryside, where land
ownership is highly concentrated, the landless labourers, the sharecroppers, the suppliers of direct services and those with only tiny plots of land were denied access to the resources that would have raised their productivity and income. Lack of access to productive assets, low wages and rapid population growth, i t was believed, kept their earnings low. It was not growth as such,
but the structure of ownership and power, and the policies pursued by the governments, which prevented the poor from benefitting from growth. Moreover, i t was believed that
unemployment and under-employment were only a small part of the problem. The trouble was not so much absence of work, as
relatively unproductive and unremunerative work. Indeed, only those who had some other means of support could afford to be unemployed. (See ILO studies of 1972 and 1974 cited above).
However, the policies associated with 'redistribution' through promotion of equal opportunities in employment and education, accompanied with major government policies like land reform and credit, also seemed not to work. By the mid-seventies, a whole
sea of literature had emerged dealing with problems of 'redistribution' (for example, Mark Blaug 1974, Thurow 197~, Bowles 1975, Fields
198U, Unesco/lIEP 'Education, Work and Employment' Vol.I&II,etc.). The apprehension that even the suggested shift in emphasis towards an equalising of opportunity through primarily employment and
educational goals, may not be enough to tackle the problem of
poverty within a reasonable time led the ILO to go a step further. The declaration of principles and programme of action adopted by the Tripartite World Conference on Employment organized by the
and policies should include explicitly, as a priority objective, along with the promotion of employment, the satisfaction of basic needs of each country's population. It further specified that basic needs should be understood to include certain minimum
requirements of a family for private consumption, such as adequate food, shelter, and clothing as well as certain household equipment and furniture, as well as certain essential services, such as safe drinking water, sanitation, public transport, and health, educational and cultural facilities. "A basic needs oriented strategy", the
conference emphasized, "implies the participation of the people in making the decisions which effect them through organization of their own choice."
The 'basic-needs' approach to development, very simply, stems directly from the view that 'the poor' will only benefit through strategies that aim at helping them directly rather than indirectly through growth, or employment, or education. The school of thinkers associated with what is popularly known as the conflict perspective
(for example, A G Frank, Samuel Bowles, Gintis, Martin Carnoy, Paolo Friere, Ivan Illich, etc), were perhaps the major influence in bringing about this shift, though needless to say, the very evidence from the field did also support the case for disillusion-ment with existing strategies for 'redistribution' with benefits for the poor. It is of interest to note that the main ideas of the basic needs approach to the problem of the poor can be traced to the paper by the late 'Pitamber Pant of the Indian Planning commission (12). The author explicitly posed the problem of
poverty alleviation in terms of providing at least a minimum level
(12) Government of India 1962 - Perspective of Development 19611976; opt. cit. (reprinted in srinivasan and Bardhan 1974
of living for the entire population. This minimum needs basket included essential items of consumption such as food, fuel and light, clothing, and shelter, as well as services such as health, sanitation, safe drinking water, and education to be provided through the government budget. The author recognized that some sections of the population might not benefit from development that creates productive employment opportunities because of the high dependency ratios in their households. These groups were to be provided their minimum level of living through income transfers.
One can thus see that there has been a marked shift in emphasis over the past three decades, over the perceptions of strategies that need to be pursued in trying to achieve the goal of
development. (See also Kevin P Clements 'Prom Right to Left in
Development Theory' Institute of Southeast Asian Studies, Occasional paper No 61, Singapore 198U). This shift looks something like this:
Redistribution
Growth Basic Needs
of GNP ---. ~hrough employment ---. fulfilment and education
Commenting on this shift, Streeten and Burki (13) write: " The evolution, from growth as the principal performance criterion, vla employment and redistribution, to basic needs is an evolution from abstract to concrete objectives, from a preoccupation with means to a renewed awareness of ends, and from a double negative
(reducing unemployment) to a positive (meeting basic needs). The basic needs strategy builds upon the experience gained in the past and carries i t a step further."
To take experlence yet a step further still, i t is being
increasingly observed and noted recently that perhaps even the
basic needs approach to development is not succeding in combating
the extreme poverty in the developing world.
the World Bank published a
which they took some pains
Poverty and Basic
~
to dem~strate the
In september 1geU,
Needs series, in
extent of mass
poverty and deprivation in the developing world, despite the
efforts of various programmes aimed at meeting the basic needs
of the poor (14). They pointed out initially that during the
last two decades, developing countries had made some progress
in meeting the basic needs of their populations : there was a
slight increase in the average amount of food available per capita,
from 208 Kg in 1961 to 2~8 Kg in ~976; the total number of
children enrolled in schools increased from 142 million in 1960
to 315 million in 1975; there was some increase in the supply
of water and sewerage and there was a slight increase in the
stock of housing available to the poor. The study goes on to
indicate how these improvements have had some effects on the quality
of life of the poor : in all developing countries, there has been
a 15 per cent improvement in life expectancy at birth - i t
increased from 47 years in 1960 to 54 years in 1977; the rate of
adult literacy increased from 39 per cent to 51 per cent during
the fifteen year period 1960-75.
Despite these improvements, however, an enormous gulf still
exists between the poor and the non-poor. The study points out
that despite the improvements cited above, the life expectancy gap between the developed and the developing countries has
narrowed only slightly : children born in the developed countries in 1977 could expect to live twenty-five years longer than those born in developing countries. Moreover, within the developing countries themselves, a significant gap persists between the poor and the middle-income countries in both life expectancy and the rate of literacy. It is commonly accepted that education, access to basic health facilities, nutrition, the availability of water supply and sanitation facilities, and adequate shelter al contribute to improvements in life expectancy. The study indicates however, that despite improvements in the access to
these goods and services, the situation in the developing countries remains disquieting. The number of people in developing countries who receive less than the minimum required amount of food energy as determined by the Food and Agriculture Organisation of the United Nations increased from 368 million in the period 1969-71 to 424 million in the period 1974-76. The greatest number of the undernourished live in the poor countries of South Asia and sub-Saharan Africa, and a significant proportion of them are children below the age of fifteen years. There are about 850 million people In developing countries who have little or no
access to school. Of these illiterates, 250 million are children and another 400 million are adult women. The rate of infant
mortality in the developing countries is estimated to be 100 per thousand of the population, whereas i t is only 25 in ·developed countries. The gap in female life expectancy at birth is
water supplies. In many poor countries women spend as much as half their work time collecting water for consumption within
households. Nearly two-fifths of the population of the developing countries remain without shelter.
Accompanied with such evidence ( which not only vivdly suggests the especially disadvantaged status of women and children, but also indicates the magnitude of the problem of poverty and
minimum basic needs fulfilment faced by the developing countries), leading developmentalists are beginning recently to emphasize the further, and indeed a critical need for an understanding of
poverty in order to accomplish the fulfilment of basic needs ideal. For example, in 1980 also, William Paul McGreevey wrote: " The ultimate success or failure of development policy depends on the progress of the poor in attaining enough food, good health and longevity, satisfying and remunerative work, and the chance for personal growth through education." (15). In this sense, poverty and basic needs are intricately linked, as indeed is pointed out by streeten and Burki (16) when they say that " the aim of a basic needs strategy is, then, to increase and redistribute production so as to eradicate deprivation that arises from lack of basic goods and services." On the subject of deprivation, Amartya Sen writes, " Poverty is, of course, a matter of deprivation." (17).
(15) William Paul McGreevey, ' Third World Poverty', Lexington Books, 1980. (my emphasis)
(16) Streeten and Burki, 1978, opt.cit.
In the light of such an awareness, and for the purposes of this thesis, i t is felt that a section should be devoted to Poverty and basic needs. But before moving on to that, I would like to
specify that the goal of 'development' In this thesis is seen very much as a continuum which looks something like this:
Poverty
Basic Needs
~fulfilment
Developmen~
My emphasis, therefore, throughout the analysis contained in
this thesis, shall be on Poverty and Basic Needs fulfilment within the more general goal of Development. In other words, my concern mainly is with poverty, and its alleviation, and with the movement towards the fulfilment of basic needs ; ( and more specifically still, with the status and role of women within this objective, in the context of rural Bangladesh ). In this sense, both poverty alleviation and the fulfilment of basic needs are seen to be
poverty and Basic Needs
Both relative and absolute deprivation are essential ingredients of the common understanding of poverty. If people are dying of hunger in a famine situation, i t is legitimate to see i t as a case of acute poverty - in other words, the absolute deprivation of the people is obvious, even without probing into the relative picture. On the other hand, even if no one goes hungry, but some are terribly deprived compared to others and see their
relative deprivation as acute, then i t lS legitimate to diagnose poverty,even though the criteria here are entirely relative rather than absolute.
Both the extent of absolute and relative poverty, or to put i t another way, both the extent of poverty and inequality, is staggering when one looks at the data for the world. Paukert
(1973) (18) has recently compiled data on absolute poverty and relative inequality in a large number of countries (see tables
1.1 &1.2). On the same issue of relative inequality between
nations, Andre Gunder Frank has written (19) " Thirty developed countries, having less than 30 per cent of the world's current population and foreseeably only 20 per cent of the world's
population in the year 2000, nowacount for approximately 90 per cent of the world's income, financial resources, and steel
production, and 95 per cent of the world's scientific and techno-logical production. Eight of the countries alone have 80 per"
(18) F Paukert, 1973, , Income Distribution at Different Levels of Development: A Survey of Evidence " International Labour Review, Aug-Sept pp97-125; (as cited in Fields 1980).
Country/date
Near East and South Asia India (1964-5)
Pakistan (including Bangladesh) (1966-7) Egypt (1964-5)
Turkey (1963) Sri Lanka (1963) Tunisia (1970)
Regional subtotal
East Asia
Thailand (1962) Korea, South (1970) Philippines (1971) Vietnam, South (1964)
Regional subtotal
Africa
Sudan (1963) Tanzania (1967) Kenya (1968-9) Madagascar (1960) Malawi (1969) Chad (1958) Senegal (1960) Dahomey (1959)
Ivory Coast (1970) Sierra Leone (1968-9) Zambia (1959)
Botswana (1971-2) Gabon (1968)
Regional subtotal
Latin America Brazil (1970 ) Colombia (1970) Peru (1970-1) Ecuador (1970)
Dominican Republic (1969 ) Chile (1968)
El Salvador (1969) Honduras (1967-8) Guatemala (1966) Uruguay (1967) Jamaica (1958) Costa Rica (1971) Panama (1969) Guyana (1955-6)
Regional subtotal
All regions (37 countries)
Total population (millions) 537.0 111. 8 33.3 35.2 12.5 4.9 734.7 34.7 32.0 37.1 17.9 121. 7 15.2 13.2 10.8 6.5 4.5 3.2 3.8 2.5 4.2 2.5 4.2 0.6 0.5 71.7 93.6 21.1 13.6 6.1 4.3 9.8 3.5 2.6 5.2 2.9 2.0 1.7 1.5 0.8 168.7 1096.8
% of population receiving less than $150 per capita 91 72 50 45 68 52 83 65 45 32 44 47 81 91 86 88 96 96 69 94 45 70 20 84 22 79 45 42 35 70 38 16 43 58 22 23 27 14 16 28 41 72.5
Table 1.1 : Note
Countries included are the thirty-seven AID-assited countries for-which income-distribution data are reported in Shail Jain, "Size Distribution of Income: Compilation of Data," International Bank for Reconstruction and Development, Bank Staff Working Paper No. 190, November 1974. Twenty-seven AID-assisted countries are not included for lack of income-distribution data. These are Afghanistan, Bolivia, Burundi, Cameroon, Central African Republic, Ethiopia, Gambia, Ghana, Guinea, Haiti, Indonesia, Khmer Republic, Laos, Lesotho, Liberia, Mali, Morocco, Nepal, Nicaragua, Niger, Paraguay, Rwanada, Swaziland, Togo, Upper Volta, Yemen Arab Republic, and Zaire. But the total 1970 population of these countries was only 242 million, compared to 1,097 million for the countries included in the table. The method and sources for the table are as follows. Population and GDP data are for 1970 ( converted to 1969 prices in all cases), except for Pakistan, Sierra Leone, Tanzania, Thailand, India, Senegal, Sudan, South Vietnam, Egypt, and Zambia (1969 data); Botswana (1968 data); Chad (1963 data); and Dahomey (1967 data). Dates for the income-distribution data are shown in parentheses next to the country name. Income-distribution data in the IBRD source just cited were presented in the form of income shares accruing to twenty equal subgroups of the population. To calculate the percentage of the population receiving an annual per capita GDP below $150, the income share of a subgroup was multiplied by the total GDP figure for that country. This product was then
divided by the number of individuals in that subgroup or the total population divided by 20. GDP and population refer to the most recent year for which data are available. With $150 as a guide, the closest 5% interval was located and, assuming equal distribution within this interval, the approximate percentage determined. The order in which countries are presented within regions was deter-mined by the magnitude and the poor majority of the population (col. 3).
Sources: AID (1975). The sources for the population and GDP figures were the U.N. Statistical Yearbook, 1969 and the U.N. Yearbook of National Accounts Statistics, 1971, V, III, respectively. GNP deflator indexes found in "Gross National Product", AID, F M SRD, May 1974, were used to convert all GDP figures to 1969 prices.
Percentile of Recipients
-Country & level of GOP per head PelCM 20% 21%-40% 41%-60% 61%-80% 81%-95% 96%-100%
Under $100
Chad (1958 ) 8.0 11.6 15.4 22.0 20.0 23.0
Dahomey (1959 ) 8.0 10.0 12.0 20.0 18.0 32.0
Niger (1960) 7.8 11.6 15.6 23.0 19.0 23.0
Nigeria (1959) 7.0 7.0 9.0 16.1 22.5 38.4
Sudan (1969) 5.6 9.4 14.3 22.6 31.0 17.1
Tanzania (1964) 4.8 7.8 11.0 15.4 18.1 42.9
Burma (1958) 10.0 13.0 13.0 15.5 20.3 28.2
India (1956-7) 8.0 12.0 16.0 22.0 22.0 20.0
Madagascar (1960 ) 3.9 7.8 11. 3 18.0 22.0 37.0
Group average 7.0 10.0 13.1 19.4 21.4 29.1
$101-$200
Morocco (1965 ) 7.1 7.4 7.7 12.4 44.5 20.6
Senegal (1960 ) 3.0 7.0 10.0 16.0 28.0 36.0
Sierra Leone (1968 ) 3.8 6.3 9.1 16.7 30.3 33.8
Tunisia (1971) 5.0 5.7 10.0 14.4 42.6 22.4
Bolivia (1968 ) 3.5 8.0 12.0 15.5 25.3 35.7
Ceylon (Sri Lanka) (1963 ) 4.5 9.2 13.8 20.2 33.9 18.4 Pakistan (1963-4 ) 6.5 11.0 15.5 22.0 25.0 20.0 South Korea (1966) 9.0 14.0 18.0 23.0 23.5 12.5
Group average 5.3 8.6 12.0 17.5 31.6 24.9
$201-$300
Malaya (1957-8) 6.5 11.2 15.7 22.6 26.2 17 .8
Fiji (1968) 4.0 8.0 13.3 22.4 30.9 21.4
Ivory Coast (1959) 8.0 10.0 12.0 15.0 26.0 29.0
Zambia (1959) 6.3 9.6 11. 1 15.9 19.6 37.5
Brazil (1960) 3.5 9.0 10.2 15.8 23.1 38.4
Ecuador (1968 ) 6.3 10.1 16.1 23.2 19.6 24.6 El Salvador (1965 ) 5.5 6.5 8.8 17.8 28.4 33.0
Peru (1961) 4.0 4.3 8.3 15.2 19.3 48.3
Iraq (1956) 2.0 6.0 8.0 16.0 34.0 34.0
Philippines (1961) 4.3 8.4 12.0 19.5 28.3 27.5
Colombia (1964 ) 2.2 4.7 9.0 16.1 27.7 40.4
Group average 4.8 8.0 11.3 18.1 25.7 32.0
$301-$500
Gabon (1960) 2.0 6.0 7.0 14.0 24.0 47.0
Costa Rica (1969) 5.5 8.1 11.2 15.2 25.0 35.0
Jamaica (1958) 2.2 6.0 10.8 19.5 31.3 30.2
Surinam (1962) 10. 7 11. 6 14.7 20.6 27.0 15.4 Lebanon (1955-60) 3.0 4.2 15.8 16.0 27.0 34.0 Barbados (1951-2 ) 3.6 9.3 14.2 21.3 29.3 22.3
Chile (1968) 5.4 9.6 12.0 20.7 29.7 22.6
Mexico (1963 ) 3.5 6.6 11.1 19.3 30.7 28.8
Panama (1969) 4.9 9.4 13.8 15.2 22.2 34.5
Group average 4.5 7.9 12.3 18.0 27 .4 30.0
$501-$1000
Republic of South Africa (1965) 1.9 4.2 10.2 26.4 18.0 39.4 Argentina (1961 ) 7.0 10.4 13.2 17.9 22.2 29.3 Trinidad and Tobago (1957-8) 3.4 9.1 14.6 24.3 26.1 22.5 Venezuela (1962 ) 4.4 9.0 16.0 22.9 23.9 23.2
Greece (1957) 9.0 10.3 13.3 17.9 26.5 23.0
Japah (1962 ) 4.7 10.6 15.8 22.9 31.2 14.8
Country and level of GDP per head Belew 20%
$1001-$2000
Israel (1957) 6.8
United Kingdom (1964) 5.1 Netherlands (1962) 4.0 Federal Republic of Gennany (1964) 5 . 3
France (1962) 1.9
Finland (1962) 2.4
Italy (19489 6.1
Puerto Rico ( 1963) 4.5
Norway (1963) 4.5
Australia (1966-7) 6.6
Group average 4.7
$2001 and above
Denmark (1963) 5.0
Sweden (1963) 4.4
United States (1969) 5.6
Group average 5.0
21%-40% 41%-60% 61%-80%' 81%-95% 96%-100%
13.4 10.2 10.0 10.1 7.6 8.7 10.5 9.2 12.1 13.4 10.5 10.8 9.6 12.3 10.9 18.6 16.6 16.0 13.7 14.0 15.4 14.6 14.2 18.5 17.8 15.9 18.8 17.4 17.6 17.9 21.8 23.9 21.6 18.0 22.8 24.2 20.4 21.5 24.4 23.4 22.2 24.2 24.6 23.4 24.1 28.2 25.0 24.8 19.2 28.7 28.3 24.3 28.6 25.1 24.4 25.7 26.3 26.4 26.3 26.3 11.2 19.0 23.6 33.7 25.0 21.0 24.1 22.0 15.4 14.4 20.9 16.9 17.6 14.8 16.4
cent of the world's non-militarymanufactured exports :. West
Germany 21 per cent, united States 17 per cent, Japan 14 per cent, the united Kingdom, France and Italy each about 8 per cent and Canada 4 per cent. Moreover, the 30 per cent of the world's population living in these 30 developed countries (both capital and socialist) produce 60 per cent of the world's agricultural output and consume over 60 per cent of the world's food measured in the wheat consumption equivalent, or 40 per cent of the world's dietary energy."
Gary S Fields (~980) has outlined the fundamental concepts and differences of various approaches to absolute poverty and
relative inequality (20). In summary, he has outlined four classes of measures
:-1. Relative inequality approach 2. Absolute income approach 3. Absolute poverty approach 4. Relative poverty approach
It is perhaps useful and interesting to go over these four
distinct approaches to poverty and relative inequality, as they do bring to the forefront some of the stark differences between the various ways of looking at the problem. Each approach has its own particular use and interest, and of course, they are all of importance to any student of poverty and inequality. However, as the emphasis in this thesis is more particularly on absolute poverty, the ' absolute poverty approach ' is found to be of more immediate interest here. I have therefore elaborated on that approach, while leaving the others fairly brief.
1. The relative inequality approach 1S adopted 1n most studies of income distribution in developing countries. Professor Kuznets
(1955, 1963, 1966) was perhaps the pioneer of this approach, and some of the most recent contributions are those of Adelman and Morris (1973), Chenery et al (1974) and Ahluwalia (1976).
sometimes, in research on relative inequality, the Lorenz curve itself is taken as the criterion for inequality comparisons. The closer the Lorenz curve is to the forty-five degree line, the more equal the distribution of income is said to be.
All relative inequality measures 1n current use are based on the Lorenz curve in two senses: (a) They use the income distribution data depicted by the Lorenz curve to construct an index of
income inequality, and (b) Like the Lorenz curve, they are mean independent, that is, if everyone's income changes by some
constant percentage, relative inequality is unchanged. The Gini coefficient bears the closest relationship to the Lorenz curve, being the ratio of the area between the Lorenz curve and the forty-five degree line to the total area of the triangle. Next most closely related to the Lorenz curve is the family of fractile measures, such as the income share of the poorest 40 per cent or richest 5 per cent. Fractile shares can be read directly from the Lorenz curve, but they use only part of the information in it.
2. The absolute income approach makes two basic welfare judgements: a) that more income is preferred to less, and
b) that a dollar of income accruing to a poor person adds more to social welfare than a dollar accruing to a richer person.
A well known example of the absolute income approach is the work of Atkinson (1970), who suggests that we conc£eve of social
welfare in the economy as the sum of the values placed on each individual's (or family's) income. Hence the function takes the form:
where W is social welfare and U is the utility of an individual or family. The form of this function means that each family's
utility is a function only of its own income, more income increases utility but at a decreasing rate, all families are treated alike in social welfare judgements, and total social welfare is the
sum of each family's well-being. ( For details, see Atkinson 1970, , On the Measurement of Inequality', Journal of Economic Theory 2: 244-63 ).
Another example of the absolute income approach is the work of Ahluwalia and Chenery (1974). Their proposal is to divide society
into socio-economic groups according to assets, income levels, and so on, and to measure the income growth of each. certain poverty groups - such as small farmers, landless labourers, and the urban unemployed - may be defined. In practice though, the population is divided into quintile groups. The overall rate of growth of welfare is given by :
where g. is the income growth of the ith quintile, ordered from
1
lowest to highest, and w. is the welfare weight assigned to the
1
3. The absolute poverty approach differs from the absolute
income approach in so far as i t concentrates on changes in economic well-being of the poor to the neglect of the rest of the income distribution. This approach is of particular relevance to this thesis, due to its obvious link with the basic-needs issue.
For a full understanding of 'the poor', according to this approach, one must first define 'poverty' in absolute terms. In his famous study of poverty in York, Seebohrn Rowntree (1970) defines families as being in 'primary poverty' if their -total earnings are
insufficient to obtain the minimum necessities for the maintenance of merely physical efficiency."(21). It is not surprising that biological considerations related to the requirements of survival or work efficiency have often been used in defining the 'poverty line' . starvation, clearly, is the most telling aspect of poverty.
Reffering to this view of absolute poverty, Ahluwalia and Chenery (1974) corrunent that the primary concern here is with" absolute standards of living in terms of calorie intake and nutrition
levels, clothing, sanitation, health, education, and so on." (22) For this we need a measurement of poverty which reflects
deficiencies in these essential requirements. To the extent to which these deficiencies are reflected in income levels, such a measure can be approximated by comparing absolute levels of income or consumption of different sections of the population with
, minimum levels ' somehow defined ; in Sen's words,'the poor'
(21) seebohrn Rowntree 1901, ' Poverty - A Study of Town Life', London: Macmillian ; ( as cited in A K Sen 1981, , Poverty and Famines ' OUP. )
are those people whose consumption standards fall short of the defined norms, or whose incomes lie below the poverty line. (23)
The incidence of poverty in developing countries defined in absolute nutritional terms has powerful appeal for dramatizing the need for policy action in both domestic and international spheres. Estimates of this type have been attempted for some countries using 'poverty lines' for each country to measure population below these levels. See, for example, Dandekar and Rath (1971), Fishlow (1972), Anand (1977), Alamgir (1976), Bhatty (1974), Osmani(1978), Fields and Fei (1978), and so on. These studies use available survey data and apply minimum levels defined in terms of income or consumption, based on minimum
nutritional requirements. International agencies have also utilized this approach by estimating poverty lines for the development world based on income figures that correspond with ability to purchase an internationally defined bundle of 'minimum needs' ,which has largely to do with 'minimum nutritional require-ments', or 'minimum consumption needs'. The united States Agency for International Development, for example, makes use of the
figure of US
$
150 per capita in less-developed countries (seeAID, 1975); the World Bank uses $ 50 or $ 75 (see Ahluwalia, 1974); the Food and Agriculture Organization of the United Nations uses the figure of $ 75 (see FAO 1973); the Asian Development Bank
uses the figure of aproximately $ 80 (see ADB 1983); and so on.(24)
(23) Amartya Sen 1981 opt. cit.
Ahluwalia and Chenery (1974) have derived estimates of population below the poverty line in 1969 by combining income share data with total income estimates obtained from the national accounts. For each country they have estimated the population living below two arbitrary 'poverty lines' of annual per capita incomes of
us
$
50 and US$
75 (in 1971 prices). The estimates are given in Table 1.3. (25). Such estimates are obviously extremely crude from a statistical point of view, as Ahluwalia and Chenery are quick to point out. They also suffer from conceptual problems involved in defining a minimum real income level to be applied across all countries. To be socially meaningful, minimum levels can not be defined according to some absolute biological standards but must necessarily vary with the general level of economic,social, and political development. Even a biological standard does not lead to the same level of minimum real income. variations ln climate are a well-known factor affecting minimum requirements of both food and housing for the same level of welfare. These and other limitations of the 'poverty line', along with some of itCs attractions, are further discussed in greater depth a little later on in this section. Despite the limitations however, i t is instructive to consider the resulting estimates of incidence of absolute poverty presented in table 1.3.
(25) Ahluwalia and Chenery et al (1974) opt. cit. p 12.
The population below any poverty line can be read off the Lorenz curve at the point where the slope of the curve equals the ratio of the poverty income level to per capita income. The relative income concept for these calculations is personal income but data on personal income are not
POEulation below $50 POEulation below $75
1969 GNP 1969 % of Total % of Total
Country Per Capita Population Millions Population Millions Population (millions)
LATIN AMERICA
Ecuador 264 5.9 2.2 37.0 3.5 58.5
Honduras 265 2.5 0.7 28.0 1.0 38.0
El Salvador 295 3.4 0.5 13.5 0.6 18.4
Dominican
Republic 323 4.2 0.5 11.0 0.7 15.9
Colombia 347 20.6 3.2 15.4 5.6 27.0
Brazil 347 90.8 12 .. 7 14.0 18.2 20.0
Jamaica 640 2.0 0.2 10.0 0.3 15.4
Guyana 390 0.7 0.1 9.0 0.1 15.1
Peru 480 13.1 2.5 10.9 3.3 25.5
Costa Rica 512 1.7 2.3 0.1 8.5
Mexico 645 48.9 3.8 7.8 8.7 17.8
Uruguay 649 2.9 0.1 2.5 0.2 5.5
Panama 692 1.4 0.1 3.5 0.2 11.0
Chile 751 9.6
Venezuela 974 10.0 Argentina 1054 24.0 Puerto Rico 1600 2.8
TOTAL 545 244.5 26.6 10.8 42.5 17.4
ASIA
Burma 72 27.0 14.5 53.6 19.2 71.0
Sri Lanka 95 12.2 4.0 33.0 7.8 63.5
India 100 537.0 239.0 44.5 359.3 66.9
Pakistan
(E and W) 100 111.8 36.3 32.5 64.7 57.9
Thailand 173 34.7 9.3 26.8 15.4 44.3
Korea 224 31.0 1.7 5.5 5.3 17.0
Philippines 233 37.2 4.8 13.0 11.2 30.0
Turkey 290 34.5 4.1 12.0 8.2 23.7
Iraq 316 9.4 2.3 24.0 3.1 33.3
Taiwan 317 13.8 1.5 10.7 2.0 14.3
Malaysia 323 10.6 1.2 11.0 1.6 15.5
Iran 350 27.9 2.3 8.5 4.2 15.0
Lebanon 570 2.9 1.0 0.1 5.0
TOTAL 132 889.7 321.0 36.1 502.1 56.4
AFRICA
Chad 75 3.5 1.5 43.1 2.7 77.5
Dahomey 90 2.6 1.1 41.6 2.3 90.1
Tanzania 92 12.8 7.4 57.9 9.3 72.9
Niger 94 3.9 1.3 33.0 2.3 59.9
Madagascar 119 6.7 3.6 53.8 4.7 69.6
Uganda 128 8.3 1.8 21.3 4.1 49.8
Sierra Leone 165 2.5 1.1 43.5 1.5 61.5
Senegal 229 3.8 0.9 22.3 1.3 35.3
Ivory Coast 237 4.8 0.3 7.0 1.4 28.5
Tunisia 241 4.9 1.1 22.5 1.6 32.1
Rhodesia 274 5.1 0.9 17.4 1.9 37.4
Zambia 340 4.2 0.3 6.3 0.3 7.5
Gabon 547 0.5 0.1 15.7 0.1 23.0
South Africa 729 20.2 2.4 12.0 3.1 15.5
TOTAL 303 83.8 23.8 28.4 36.6 43.6
GRAND TOTAL 228 1218.0 371.4 30.5 583.2 47.9
The countries included in the table account for about ~o per cent of the total population of the developing countries including China. About a third of this population falls below the poverty line defined by US $ 50 per capita and about half falls below
US $ 75 per capita. Much of this is clearly due to the low levels of per capita income of many countries rather than to highly
skewed income distribution patterns. India, Pakistan, Bangladesh and Sri Lanka with 55 per cent of the total population together account for about 75 per cent of the population living below
US $ 50. These countries are all characterized by low to moderate inequality. More interestingly, the table shows that a high per capita income does not ensure that there is no 'absolute poverty' problem. Differences in the patterns of income distribution between countries mean that the poverty problem may be equally serious in countries with very different per capita income levels. Both Ecuador and Sri Lanka have about a third of the population below US
$
50 poverty line even though Ecuador's per capita income is three times as high. Similarly, Peru and the Philippines both have a quarter of the population below the poverty line, although the per capita income of Peru is twice that of Philippines.if they are accompanied by deterioration in relative income shares.
Even after we have defined the concept of poverty and identified broadly who the poor are, and specified that the concept of
poverty is concerned with the conditions of the poor, much remains to be done. Not only do we have to identify the characteristics of the poor, an excercise that lS crucial to any understanding of both the poor and the means by which to help them, but we do also have the problem of aggregation over the group of the poor, and this involves moving from the description of the poor to some overall measure of 'poverty' as such. It is important to add here however, that in fact the problem of description and that of
measurement are not distinct at all and i t must be remembered that in order to 'measure' the poor, one is in effect describing them. It is the degree and the complexity of the description that lS reflected in the measurement index used. This point will become more clear as we move on to examine the most commonly used
measurement indices for identifying the extent or degree of poverty. The nature of poverty on the other hand is better tackled by
For now, we must turn b~iefly to examine some of the limitations of the 'poverty line' based on generally accepted 'nutritional
norms' . Sen has called i t the 'biological approach' (see Sen 1981) and has presented various arguments that point out the several
problems with its use (see Sen 1980, 1981). Webb has also mapped out remarkably well the conceptual and practical difficulties associated with the" minimum dietary needs" measure of absolute poverty ( 26).
First, there are significant variations related to physical
features, climatic conditions and work habits. ( See for example, Townsend 1974, SUkhatme 1977
&
1978, Srinivasan 1977&
1979 ). To be socially meaningful, minimum levels can not be defined according to some absolute biological standards, but mustnecessarily vary with the demographic and social characteristics of different communities, as well as with different constitutions, habits, and cultures of its people. The cogency of nutritional norms has been questioned because of the interpersonal variability of nutritional requirements and the existence of ' adaptive
mechanisms' operating over time (27).
Second, the translation of minimum
,
nutritional , requirements into minimum,
food,
requirements depends on the choice of commodities. This reflects on the problem of,
tastes,
(see Osmani 1978) . In other words, even though it may be more(26) Richard Webb 1976 'On the statistical Mapping of Urban Poverty and Employment " World Bank Staff Working Paper no.
227, p 12-16.
(27) See particularly SUkhatme 1977 and 1978 1979.
cost-effective to choose a minimum diet for meeting specified nutritional requirements from food items sold at specified costs, the reality of the situation is that people's food habits are not, in fact, determined by such a cost maximization excercise. The actual incomes at which specified nutritional requirements are met will depend greatly on the consumption habits and tastes of the people in question; minimum cost diets are likely to contain unaccostomed or virtually unacceptable foods.
Third, for non-food items such minimum requirements are not easy to specify, and the problem is usually solved by assuming that a specified proportion of total income will be spent on food. with this assumption, the minimum food costs can be used to derive minimum income requirements. But the proportion spent on food varies not merely with habits and culture, but also with relative prices and availability of goods and services. Sen (1981) has gone to some length to point out that i t is often a problem of declining entitlements as prices of food rise, that leads to starvation.
It is clear to see that the uncritical use of the ' biological approach' or ' nutritional approach' (as so called by Sen 1980, 1981), does deserve criticism. However, in making this criticism i t is possible to overlook a simple point, which is that malnutrition can provide a basis for a standard of poverty, without poverty