R E S E A R C H A R T I C L E
Open Access
Determinants of serum levels of vitamin D: a study
of life-style, menopausal status, dietary intake,
serum calcium, and PTH
Leila Shirazi
1,2*, Martin Almquist
2,3, Johan Malm
4, Elisabet Wirfält
5and Jonas Manjer
2,6Abstract
Background:Low blood levels of vitamin D (25-hydroxy D3, 25OHD3) in women have been associated with an increased risk of several diseases. A large part of the population may have suboptimal 25OHD3 levels but high-risk groups are not well known. The aim of the present study was to identify determinants for serum levels of 25OHD3 in women, i.e. factors such as lifestyle, menopausal status, diet and selected biochemical variables.
Methods:The study was based on women from the Malmö Diet and Cancer Study (MDCS), a prospective,
population-based cohort study in Malmö, Sweden. In a previous case–control study on breast cancer, 25OHD3 concentrations had been measured in 727 women. In these, quartiles of serum 25OHD3 were compared with regard to age at baseline, BMI (Body Max Index), menopausal status, use of oral contraceptives or menopausal hormone therapy (MHT) , life-style (e.g. smoking and alcohol consumption), socio-demographic factors, season, biochemical variables (i.e. calcium, PTH, albumin, creatinine, and phosphate), and dietary intake of vitamin D and calcium. In order to test differences in mean vitamin D concentrations between different categories of the studied factors, an ANOVA test was used followed by a t-test. The relation between different factors and 25OHD3 was further investigated using multiple linear regression analysis and a logistic regression analysis.
Results:We found a positive association between serum levels of 25OHD3 and age, oral contraceptive use, moderate alcohol consumption, blood collection during summer/ autumn, creatinine, phosphate, calcium, and a high intake of vitamin D. Low vitamin D levels were associated with obesity, being born outside Sweden and high PTH levels.
Conclusions:The present population-based study found a positive association between serum levels of 25OHD3 and to several socio-demographic, life-style and biochemical factors. The study may have implications e. g. for dietary recommendations. However, the analysis is a cross-sectional and it is difficult to suggest Lifestyle changes as cause- effect relationships are difficult to assess.
Background
Low blood levels of vitamin D (25-hydroxy D3, 25OHD3) in women have been associated with an in-creased risk of hypertension [1], myocardial infarction [2], sudden cardiac death [3], depression [4], diabetes [5], obesity [6], fracture [7] and cancer [8,9]. However, determinants of levels of 25OHD3 are not well known, and few studies have examined the impact of lifestyle,
and menopausal status, dietary and biochemical factors on vitamin D status. Furthermore, a large part of the population in northern countries might suffer from sub-optimal 25OHD3 levels because of inadequate exposure to sunlight [10], due to geographical location [11], cul-tural differences [12], and race [13,14].
Sun exposure plays a central role in vitamin D metab-olism as vitamin D is formed in the skin under the influ-ence of UV light [15], and there is a well-known seasonal variation with lowest levels during the winter [16]. The other source of vitamin D is from the diet, but the association between dietary intake and serum 25OHD3 levels has not been extensively investigated
* Correspondence:Leila.shirazi@med.lu.se
1Department of Surgery, Ystad Hospital, Ystad, Sweden
2
Department of Clinical Sciences Malmö Surgery, Lund University, Malmö, Sweden
Full list of author information is available at the end of the article
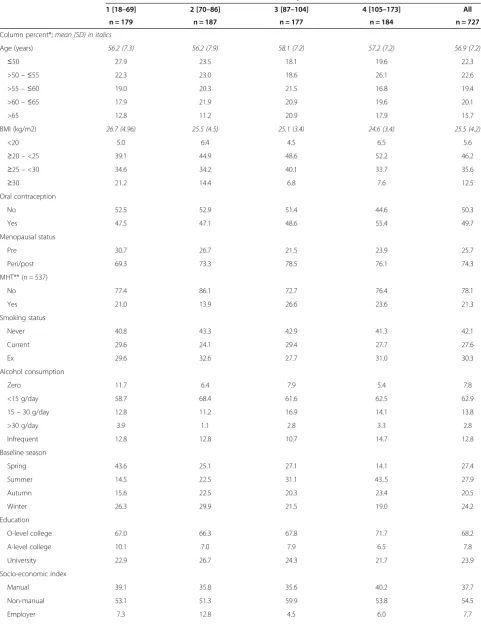
Table 1 Distribution of serum vitamin D quartiles in relation to reproductive history, life-style factors and season
Factor Serum vitamin D quartile [nmol/L]
1 [18–69] 2 [70–86] 3 [87–104] 4 [105–173] All
n = 179 n = 187 n = 177 n = 184 n = 727
Column percent*;mean (SD) in italics
Age (years) 56.2 (7.3) 56.2 (7.9) 58.1 (7.2) 57.2 (7.2) 56.9 (7.2)
≤50 27.9 23.5 18.1 19.6 22.3
>50–≤55 22.3 23.0 18.6 26.1 22.6
>55–≤60 19.0 20.3 21.5 16.8 19.4
>60–≤65 17.9 21.9 20.9 19.6 20.1
>65 12.8 11.2 20.9 17.9 15.7
BMI (kg/m2) 26.7 (4.96) 25.5 (4.5) 25.1 (3.4) 24.6 (3.4) 25.5 (4.2)
<20 5.0 6.4 4.5 6.5 5.6
≥20–<25 39.1 44.9 48.6 52.2 46.2
≥25–<30 34.6 34.2 40.1 33.7 35.6
≥30 21.2 14.4 6.8 7.6 12.5
Oral contraception
No 52.5 52.9 51.4 44.6 50.3
Yes 47.5 47.1 48.6 55.4 49.7
Menopausal status
Pre 30.7 26.7 21.5 23.9 25.7
Peri/post 69.3 73.3 78.5 76.1 74.3
MHT** (n = 537)
No 77.4 86.1 72.7 76.4 78.1
Yes 21.0 13.9 26.6 23.6 21.3
Smoking status
Never 40.8 43.3 42.9 41.3 42.1
Current 29.6 24.1 29.4 27.7 27.6
Ex 29.6 32.6 27.7 31.0 30.3
Alcohol consumption
Zero 11.7 6.4 7.9 5.4 7.8
<15 g/day 58.7 68.4 61.6 62.5 62.9
15–30 g/day 12.8 11.2 16.9 14.1 13.8
>30 g/day 3.9 1.1 2.8 3.3 2.8
Infrequent 12.8 12.8 10.7 14.7 12.8
Baseline season
Spring 43.6 25.1 27.1 14.1 27.4
Summer 14.5 22.5 31.1 43..5 27.9
Autumn 15.6 22.5 20.3 23.4 20.5
Winter 26.3 29.9 21.5 19.0 24.2
Education
O-level college 67.0 66.3 67.8 71.7 68.2
A-level college 10.1 7.0 7.9 6.5 7.8
University 22.9 26.7 24.3 21.7 23.9
Socio-economic index
Manual 39.1 35.8 35.6 40.2 37.7
Non-manual 53.1 51.3 59.9 53.8 54.5
[17]. Sun exposure and diet may indeed be affected by socioeconomic factors and life-style; for instance low vitamin D levels have been noted among low income groups [18], and among individuals with heavy alcohol consumption [19]. However, apart from this, few studies have reported on vitamin D in relation to life-style and menopausal status. Vitamin D metabolism is closely re-lated to PTH, calcium and phosphate [20].
This study is based on data from the Malmö Diet and Cancer Study (MDCS), a prospective, population-based cohort study in Malmö, Sweden [21]. At baseline, 17,035 women answered a questionnaire on life-style, repro-ductive life and socio-demographic factors. An import-ant part of the examination was a dietary assessment and collection of blood samples [22].
The aim of the present study was to identify determi-nants for serum levels of 25OHD3 in women, i.e. factors such as lifestyle, menopausal status, diet and selected biochemical variables.
Methods
The malmö diet and cancer study
The Malmö Diet and Cancer Study (MDCS) is a pro-spective, population-based cohort study in Malmö, Sweden’s third largest city with about 300,000 inhabi-tants. The main aim of the MDCS was to estimate the potential association between dietary factors and malig-nancy [23]. All women in Malmö born 1923–1950 were invited and the baseline examination took place between 1991 and 1996. The majority of women were born in Sweden or other Nordic countries. Finally, 17,035 women participated, corresponding to a participation rate of approximately 40%.
Baseline examination
All participants completed a questionnaire on socio-economic factors (e.g. education, occupation, country of birth), life-style (e.g. smoking, alcohol consumption, use of oral contraceptives (OC) and menstrual status), and for women also menopausal status. Smoking status was classified as current, never or ex-smoking. An open ended question assessed use of medications. For the pur-pose of the present analysis, menopausal hormone ther-apy (MHT) was classified into two categories: non-users and current users. Women were classified as pre- or peri/ postmenopausal using information on previous
gynaecologic surgery and last menstruation as previously described in detail [24]. Anthropometric measurements were performed and Body Mass Index (BMI) was calcu-lated (kg/m2). BMI was classified as underweight <20, normal weight≥20 - <25, overweight ≥25 - <30, and obesity ≥30. Season was classified as “spring” (March-April), “summer” (May-August), “autumn” (September-October) and “winter” (November-February), based on the date of the baseline examination.
Dietary data
Dietary data was obtained through a modified diet his-tory consisting of (a) a 168-item dietary questionnaire for assessment of the consumption frequencies and por-tion sizes of regularly eaten foods (i.e. sandwiches, cakes and cookies, fruit, breakfast cereals, milk and yoghurt, coffee, tea, candy, snacks etc.) and the general meal pat-tern, (b) a 7 day menu-book for registration of cooked lunch and dinner meals, cold beverages including alco-hol, drugs, natural remedies and nutrient supplements, and c) a one-hour diet history interview [25]. The food intake information was converted to nutrient intake data using the nutrient information available in the MDCS Food and Nutrient Database. This database, specifically developed for the MDCS, originates from PC KO ST2 -93 of the Swedish National Food Administration. The average daily intake of total energy and nutrients was calculated. The procedure has been previously described in detail [26]. The relative validity of the diet history method has previously been examined with 18 days of weighed food records collected during one year as the reference [25]. In women, the energy-adjusted validation correlation coefficients were for calcium 0.65 and for total energy intake 0.54, when administrating the diet history prior to the reference method.
This study examined the following nutrient variables: total energy (kcal), vitamin D (μg) and calcium (mg). Separate analyses were performed for intake related to food, and total intake including supplements. In order to adjust for energy, the residual method was applied using log-transformed variables of total energy, vitamin D and calcium intakes [26]. Four different variables were cre-ated by regressing the log-transformed variables sepa-rated on total energy intake: (1) vitamin D-dietary; (2) vitamin D-total (i.e. dietary and supplement); (3) calcium-dietary; and (4) calcium-total. The residuals Table 1 Distribution of serum vitamin D quartiles in relation to reproductive history, life-style factors and season
(Continued)
Born in Sweden
Yes 83.2 91.4 93.8 92.9 90.4
No 16.8 8.6 6.2 7.1 9.6
were saved for each variable, and individuals were cate-gorized into five categories (quintiles). The limits for the original variables were given for each quintile.
Alcohol consumption was divided into five categories: zero, low (<15 g alcohol/day), medium (15-30 g alcohol/ day), high (>30 g alcohol/day), and infrequent use. The amount per day was obtained from the menu book. Par-ticipants with zero consumption in the menu book and with no consumption during the previous thirty days or previous year according to the questionnaire were cate-gorized as zero consumers [27]. Participants with zero consumption in the menu book but reporting alcohol consumption during the previous thirty days or previous year were regarded as infrequent users. For example a glass of wine (12 centilitres) corresponds to 15 grams pure alcohol.
Study population
The present study is based on data from female controls from a previous nested case–control study within the MDCS [22]. In that study, cases were women with inci-dent breast cancer; controls were selected from MDCS subjects at risk at the time of disease occurrence of the case. Cases and controls were matched for age, calendar time of blood sampling, and menopausal [28] status. Out of 738 controls, 11 had no data on 25OHD3 con-centrations and were excluded. Thus, the present study is based on data from 727 women.
Blood samples and laboratory methods
Blood samples were drawn at baseline in non-fasting subjects by a trained nurse and plasma and serum sepa-rated within 1 hour. The samples were subsequently stored in a biological bank at−80°C before analysis [23]. Serum was retrieved from un-thawed samples in the MDCS bio-bank was analysed for 25OHD3, PTH, cal-cium, phosphate, creatinine and albumin. 25OHD3 was analysed with high pressure liquid chromatography (HPLC) and PTH with the Immulite® 2000 Intact PTH immunoassay (Diagnostic Products Corporation, Los Angeles, CA). Total calcium was analysed by neutral carrier ion-selective electrode [29], albumin by rate immunonephelometry [28], phosphate by a colorimetric method by complexing with ammoniummolybdate and creatinine by the Jaffé method. These analyses were car-ried out with the Synchron LX System (Beckman
Table 2 Mean serum vitamin D levels in relation to reproductive history, life–style factors and season
Factor No. Mean (95% CI) T–test
(p–value*)
ANOVA (p–value)
Age (years)
≤50 162 84.4 (80.3–88.6) Ref.
>50–≤55 164 88.6 (84.3–92.8) 0.10 >55–≤60 141 87.7 (83.0–92.5) 0.29 >60–≤65 146 88.5 (84.6–92.5) 0.13
>65 114 93.6 (88.3–98.9) 0.01 0.107
BMI (kg/m2)
<20 41 93.2 (83.6–102.8) 0.62
≥20–<25 336 91.0 (88.1–93.9) Ref.
≥25–<30 259 87.9 (84.6–91.1) 0.16
≥30 91 77.3 (71.7–82.9) <0.001 <0.001
Oral contraception
No 366 86.9 (84.2–89.5) Ref.
Yes 361 89.7 (86.8–92.6) 0.011 0.011
Menopausal status
Pre 187 85.0 (81.1–88.8) Ref.
Peri/Post 540 89.4 (87.1–91.7) 0.056 0.056
MHT** (n = 537)
No 422 89.2 (86.6–91.8) Ref.
Yes 115 90.8 (85.7–95.9) 0.57 0.27
Smoking status
Never 306 87.9 (85.0–90.8) Ref.
Current 201 87.3 (83.3–91.3) 0.813
Ex 220 89.7 (86.0–93.4) 0.443 0.635
Alcohol consumption
Zero 57 80.3 (72.8–87.8) Ref.
<15 g/day 457 88.9 (86.4–91.4) 0.025
15–30 g/day 100 89.5 (84.8–94.3) 0.032
>30 g/day 20 82.7 (66.3–99.1) 0.762
Infrequent 93 89.7 (83.9–95.5) 0.049 0.169
Baseline season
Spring 199 78.6 (74.8–82.4) Ref.
Summer 203 99.0 (95.2–102.7) <0.001
Autumn 149 89.6 (85.8–93.5) <0.001
Winter 176 85.7 (81.8–89.6) 0.011 <0.001
Education
O–level college 496 89.3 (86.9–91.7) Ref.
A–level college 57 83.4 (75.8–91.0) 0.128
University 174 87.0 (83.0–91.0) 0.324 0.236
Socio–economic index
Manual 274 89.0 (85.6–92.5) Ref.
Non–manual 396 88.5 (85.9–91.1) 0.796
Employer 56 83.9 (77.3–90.5) 0.221 0.158
Table 2 Mean serum vitamin D levels in relation to reproductive history, life–style factors and season
(Continued) Born in Sweden
Yes 657 89.3 (87.2–91.4) Ref.
No 70 78.6 (72.0–85.3) 0.002 0.00
Table 3 Crude and adjusted odds ratios (OR) for high (> 75 nmol/L)vs. low (≤75 nmol/L) vitamin D levels, and
regression coefficients (βi) from multiple regression analysis, in relation to reproductive history, life–styles factors and season
Factor Low (n) High (n) Crude OR (95% CI) Adjusted*OR (95% CI) βi (95% CI) Adjusted*βi (95% CI)
Age (years)
≤50 59 103 1.00 1.00 Baseline Baseline
>50–≤55 53 111 1.20 (0.76–1.90) 1.18 (0.73–1.92) 4.13 (–1.78 to 10.0) 4.10 (–1.73 to 9.94) >55–≤60 49 92 1.08 (0.67–1.72) 0.99 (0.60–1.64) 3.31 (–2.83 to 9.46) 2.25 (–3.84 to 8.33) >60–≤65 42 104 1.42 (0.88–2.29) 1.49 (0.89–2.49) 4.12 (–1.97 to 10.2) 5.05 (–1.02 to 11.1)
>65 31 83 1.53 (0.91–2.59) 1.44 (0.84–2.48) 9.14 (2.61 to 15.7) 8.03 (1.73 to 14.3)
BMI (kg/m2)
<20 12 29 0.80 (0.45–1.86) 0.97 (0.46–2.04) 1.12 (–3.25 to 5.50) 1.47 (–2.73 to 5.68)
≥20–<25 92 244 1.00 1.00 Baseline Baseline
≥25–<30 82 177 0.26 (0.57–1.16) 0.79 (0.55–1.14) −1.55 (–3.74 to 0.63) −1.73 (–3.84 to 0.39)
≥30 48 43 0.34 (0.21–0.54) 0.31 (0.19–0.52) −6.84 (–9.97 to–3.72) −6.98 (–10.0 to–3.94) Oral contraception
No 126 240 1.00 1.00 Baseline Baseline
Yes 108 253 1.23 (0.90–1.68) 1.49 (1.04–2.13) 2.84 (–1.13 to 6.80) 5.40 (1.17 to 9.62)
Menopausal status
Pre 67 120 1.00 1.00 Baseline Baseline
Peri/post 167 373 1.25 (0.88–1.77) 1.22 (0.70–2.12) 4.42 (–0.12 to 8.95) 3.62 (–3.10 to 10.3)
MHT** (n = 537)
No 135 287 1.00 1.00 Baseline Baseline
Yes 30 85 1.33 (0.84–2.12) 1.37 (0.85–2.23) −1.52 (–4.53 to 1.48) −1.55 (–4.50 to 1.40)
Smoking status
Never 97 209 1.00 1.00 Baseline Baseline
Ex 66 135 0.95 (0.65–1.39) 1.06 (0.71–1.58) −0.58 (–5.44 to 4.28) 0.85 (–3.91 to 5.62)
Current 71 149 0.97 (0.67–1.41) 1.03 (0.70–1.52) 1.81 (–2.93 to 6.54) 2.42 (–2.18 to 7.03)
Alcohol consumption
Zero 25 32 1.00 1.00 Baseline Baseline
<15 g/day 311 315 1.73 (0.99–3.03) 1.92 (1.07–3.45) 8.60 (1.10 to 16.1) 9.31 (2.05 to 16.6)
15–30 g/day 30 70 1.82 (0.93–3.58) 2.16 (1.06–4.41) 9.20 (0.34 to 18.1) 10.7 (2.03 to 19.3)
>30 g/day 8 12 1.17 (0.42–3.30) 1.44 (0.48–4.33) 2.38 (–11.5 to 16.3) 4.51 (–9.01 to 18.0)
Infrequent 29 64 1.72 (0.87–3.41) 2.01 (0.99–4.08) 9.41 (0.42 to 18.4) 10.9 (2.21 to 19.5)
Baseline season
Spring 95 104 1.00 1.00 Baseline Baseline
Summer 39 164 3.84 (2.46–6.00) 3.89 (2.48–6.12) 20.3 (15.2 to 25.5) 20.1 (14.9 to 25.2)
Autumn 39 110 2.58 (1.63–4.08) 2.52 (1.59–4.00) 11.0 (5.45 to 16.6) 10.5 (4.94 to 16.1)
Winter 61 115 1.72 (1.14–2.61) 1.71 (1.12–2.60) 7.04 (1.72 to 12.4) 6.80 (1.47 to 12.1)
Education
O–level college 158 338 1.00 1.00 Baseline Baseline
A–level college 23 34 0.69 (0.39–1.21) 0.70 (0.39–1.27) −5.87 (–13.3 to 1.61) −5.63 (–12.9 to 1.62) University 53 121 1.07 (0.73–1.55) 1.17 (0.78–1.74) −2.31 (–7.02 to 2.40) −1.10 (–5.77 to 3.57) Socio–economic index
Manual 93 181 1.00 1.00 Baseline Baseline
Coulter Inc., Brea, CA.). Inter-assay CVs were for 25OHD3 8.5% at 70 nmol/L and 7.1% at 210 nmol/L, for PTH 4% at 5.9 pmol/L and at 40.3 pmol/L, for calcium 2% at 2.00 mmol/L and at 3.10 mmol/L, for albumin 4% at 25 g/L and 2% at 48 g/L, for creatinine 12% at 34μmol/L and 4% at 129μmol/L, and for phosphate 3% at 0.66 mmol/L and 5% at 2.5 mmol/L. The Clinical Chemistry laboratory at Skåne University Hospital Malmö is accredited by Swedac (The Swedish Board for Accreditation and Conformity Assessment) and takes part in the external quality assurance program of Instand e.V., Düsseldorf, Germany.
Statistical methods
Serum levels of 25OHD3 were normally distributed. The cohort subjects were ranked into quartiles based on serum levels of 25OHD3. Different quartiles of serum 25OHD3 were compared with regard to age at baseline (continuous and as categories in five-year intervals), life-style, BMI (continuous and categorical), menopausal sta-tus, socio-demographic factors, season, biochemical vari-ables, and dietary intakes.
Means of serum 25OHD3 were calculated in different categories of all factors mentioned above. Confidence in-tervals were chosen as an estimation of the accuracy of the estimated means. In order to examine differences in mean vitamin D concentrations between different categories of the studied factors, ANOVA was used followed by a Bonferroni t-test, thus multiplying the obtained p-values with the number of comparisons. All tests were two-sided and a p-value of 0.05 was considered statistically signifi-cant. Missing values constituted less than 1% for all factors. Serum 25OHD3 levels were dichotomized into low (≤75 nmol/L) and high (>75 nmol/L), i.e., the cut-off in-dicating the minimum level previously estimated to be sufficient [30]. Odds ratios with 95% confidence intervals (CI) were estimated for high versus low concentrations, in relation to each of the studied factors, using a logistic regression analysis. In a second model, the odds ratios for high versus low concentrations were adjusted for age, season and storage time. Age has previously been related to vitamin D levels and there is a well-known seasonal variation in vitamin D levels [31]. The potential effect of biological degradation is not well known and this justified the inclusion of storage time in the final
model. In a sensitivity analysis, a third model included adjustment for total dietary vitamin D intake (entered as quintiles).
The relation between different factors and 25OHD3 was further investigated using multiple linear regression analysis. All categorical variables in the linear regression analysis were recorded and entered as multiple categor-ical variables with values as 0 or 1. Partial regression co-efficients (βi) with 95% confidence intervals, adjusted for age, season and storage time, were reported. All statis-tical analyses were performed using SPSS version 17.0.
Results
In this cross-sectional study on 727 women, mean age at blood sampling was 56.9 years (range: 41–73 years), 74% were postmenopausal, 91% were born in Sweden, mean BMI was 25.5 kg/m2 (SD: 16.61–50.19), and the mean level of 25OHD3 was 88.3 nmol/L (SD: 18–173).
Co-variates used in the multivariate analyses, (i.e., age at baseline, season and storage time), were all examined in relation to 25OHD3 concentrations and presented below. There was no significant association between storage time and 25OHD3 concentrations. The odds of high 25OHD3 concentration, adjusted for age and sea-son, were for storage time as a continuous variable: 0.98 (0.87-1.09). The linear regression analysis showed an ad-justed regression coefficient for storage time of −0.59 (−1.97 to 0.79). That is, there was no strong association between storage time and 25OHD3 levels.
Age, life-style, menopausal status, season, and socio-demographic factors
Vitamin D quartiles 3 and 4 were characterised by a relatively large proportion of women >65 years old Table 1. The positive association between age and high vitamin D levels was confirmed with a trend of increase in vitamin D levels observed in older women in the ana-lyses of mean 25OHD3 in different age categories, Table 2, and in the continuous linear regression analysis, Table 3. There was also a positive association between vitamin D levels and use of OC in all analyses, Tables 1, 2, and 3. Women with relatively high 25OHD3 levels were less often overweight or obese, and this negative association was also seen comparing mean levels in dif-ferent BMI categories, Table 2, in the dichotomised Table 3 Crude and adjusted odds ratios (OR) for high (> 75 nmol/L)vs. low (≤75 nmol/L) vitamin D levels, and
regression coefficients (βi) from multiple regression analysis, in relation to reproductive history, life–styles factors and season(Continued)
Born in Sweden
Yes 200 457 1.00 1.00 Baseline Baseline
No 34 36 0.46 (0.28–0.76) 0.44 (0.26–0.74) −10.6 (–17.3 to–3.96) −10.5 (–16.9 to–4.08)
Table 4 Serum vitamin D quartiles in relation to biochemical parameters and dietary intake
Serum vitamin D quartile [nmol/L]
1 [18–69] n = 179 2 [70–86] n = 187 3 [87–104] n = 177 4 [105–173] n = 184 All n = 727 Column percent*
Albumin
1 (30.0–39.0) 30.2 25.7 26.0 23.4 26.3
2 (39.1–40.9) 21.2 24.6 20.3 23.9 22.6
3 (41.0–42.2) 22.9 26.7 31.6 20.1 25.3
4 (42.3–50.3) 22.9 22.5 21.5 32.1 24.8
Creatinine
1 (42–58) 30.2 27.8 26.0 20.1 26.0
2 (59–64) 22.3 24.6 24.3 21.2 23.1
3 (65–71) 28.5 24.6 23.2 24.5 25.2
4 (72–130) 16.2 22.5 26.0 33.7 24.6
Phosphate
1 (0.66–1.07) 29.6 21.4 24.9 23.9 24.9
2 (1.08–1.19) 29.6 26.7 24.9 19.0 25.0
3 (1.20–1.32) 23.5 20.3 28.8 24.5 24.2
4 (1.33–2.00) 14.5 31.0 20.9 32.1 24.8
PTH
1 (0.38–2.63) 22.3 17.6 26.0 33.7 24.9
2 (2.64–3.55) 18.4 27.3 29.9 22.3 24.5
3 (3.56–4.89) 23.5 28.3 21.5 25.0 24.6
4 (4.90–30.60) 34.1 25.1 22.6 18.5 25.0
Calcium
1 (2.18–2.34) 35.8 26.2 22.6 24.5 27.2
2 (2.35–2.38) 19.6 24.6 23.2 17.4 21.2
3 (2.39–2.44) 26.8 23.5 27.7 26.1 26.0
4 (2.45–2.77) 15.1 24.6 26.0 32.1 24.5
Vitamin D–dietary
1 (0.83–7.19) 30.2 16.6 15.8 17.4 19.9
2 (2.67–10.17) 21.8 21.4 16.9 20.1 20.1
3 (2.66–11.86) 15.6 25.1 21.5 17.4 19.9
4 (3.54–12.57) 19.0 17.1 21.5 22.8 20.1
5 (5.14–22.83) 13.4 19.8 24.3 22.3 19.9
Calcium–dietary
1 (275.8–1203.8) 21.8 19.3 16.9 21.7 19.9
2 (435.5–1712.1) 19.0 23.0 19.2 19.0 20.1
3 (460.7–1669.4) 17.3 18.7 23.7 20.1 19.9
4 (636.6–2399.4) 21.2 16.6 22.6 20.1 20.1
5 (779.5–2791.5) 20.7 22.5 17.5 19.0 19.9
Vitamin D–total**
1 (0.83–9.31) 31.8 16.0 16.9 15.2 19.9
2 (2.66–11.86) 20.7 25.7 12.4 21.2 20.1
3 (3.97–12.57) 18.4 18.2 23.2 20.1 19.9
4 (4.84–16.55) 12.8 20.9 24.3 22.3 20.1
logistic regression analysis, and in the linear regression analysis, Table 3.
The association between 25OHD3 and alcohol showed a bimodal pattern where 25OHD3 quartiles 1 and 4 had the highest percentage of high consumers (>30 g/day), Table 1. Correspondingly, women who reported no alcohol con-sumption or were high consumers had low 25OHD3 levels, Table 2, and this pattern was confirmed in the dichotomised analysis and in the continuous analysis, Table 3.
The highest concentration of 25OHD3 was seen during the summer and in the autumn, Table 1. This was con-firmed in both the logistic regression analysis and in the lin-ear regression analysis, Table 3. Women with relatively low vitamin D levels were more often born abroad, Table 1. This association was confirmed in the dichotomised analysis and in the continuous analysis, Table 3. Vitamin D was not as-sociated with menopausal status, use of MHT, smoking sta-tus, education and socio-economic index in this study.
Most results were similar following inclusion of dietary intake of total vitamin D in the logistic regression ana-lysis, but the OR s for oral contraception changed from 1.49 (1.04-2.13) to 1.40 (0.97-2.02), for Born in Sweden from 0.44 (0.26-0.74) to 0.51 (0.30-0.89 and for meno-pausal status from 1.22 (0.70-2.12) to 1.28 (0.72-2.25).
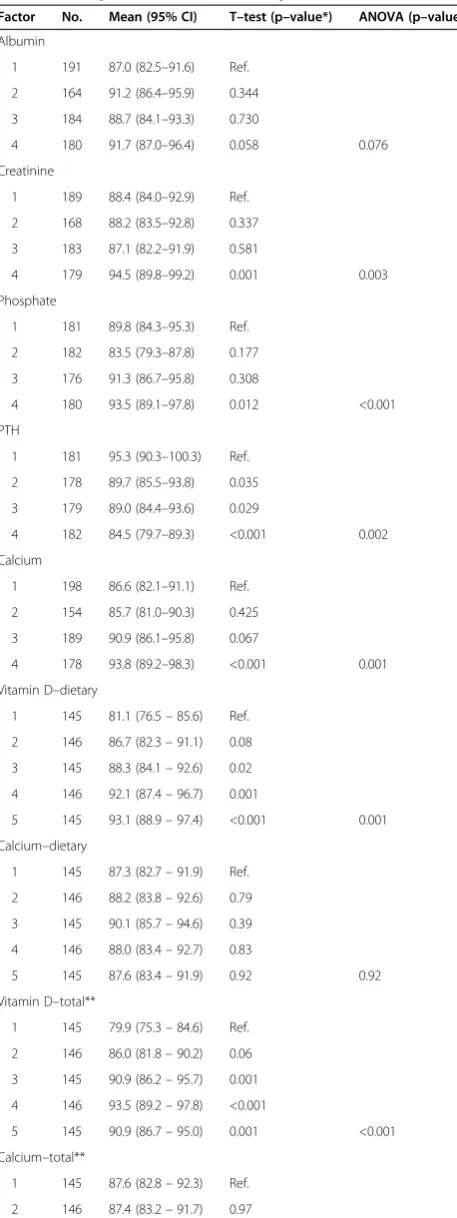
Biochemical variables
Women with relatively high 25OHD3 levels had more often high albumin levels, Table 4, but the association did not reach statistical significance when 25OHD3 levels were compared in different albumin quartiles, Table 5, or in the dichotomised analysis, Table 6. How-ever, there was a statistically significant positive associ-ation in the linear regression analysis, Table 6. 25OHD3 was also positively associated with creatinine, phosphate and calcium in all analyses, Tables 4, 5, and 6; although the association was borderline significant concerning phosphate in the adjusted dichotomised analysis, Table 6. In all analyses, there was an inverse association between 25OHD3 and PTH concentrations, Tables 4, 5, and 6. All crude and adjusted analyses were similar.
Dietary intake
High serum concentrations of 25OHD3 were associated with a high intake of vitamin D, Table 4. This finding
was confirmed comparing 25OHD3 levels in different categories of vitamin D intake, Table 5, and in both the dichotomised and continuous analysis, Table 6. The use of dietary intake of vitamin D from the diet alone, or from diet and supplements, showed similar results. Con-trary to this, there was no statistically significant associ-ation between intake of Calcium and 25OHD3 levels, Tables 4, 5, and 6.
Discussion
This cross-sectional study including 727 females found that serum levels of 25OHD3 are positively associated with age, oral contraceptive use, moderate alcohol con-sumption, and blood collection during summer / autumn, a high dietary intake of vitamin D and serum concentra-tions of creatinine, phosphate and calcium. Serum levels of 25OHD3 were inversely associated with obesity, being born outside Sweden and with serum levels of PTH.
A positive association between serum levels of 25OHD3 and advanced age has previously also been reported by Moan et al. [32]. However, others have found vitamin D deficiency to be more prevalent among elderly people [33], which could be caused by poor production in the skin [34], decreased intestinal absorption [35], and/or im-paired renal function [36]. A reason for the difference be-tween our and most previous studies may be that the current study only included females up until the age of 72 years, and deficiency related to high age may not be ap-parent until later. Another possible reason to the results seen in the present study may be that older women in this cohort consume relatively more vitamin D. We found no association between menopausal status and serum levels of 25OHD3, although postmenopausal women had slightly higher levels.
A positive association between the use of OC and serum level of 25OHD3 was found in the present study and there was also a tendency for a positive association between MHT and high serum levels of 25OHD3. This is in line with several previous studies on 25OHD3 in re-lation to OC and other exogenous oestrogens [37-41]. A potential explanation may be that oestrogen increases the levels of 25OHD3-binding proteins [42].
We found no strong association between socioeco-nomic status and serum levels of 25OHD3, although Table 4 Serum vitamin D quartiles in relation to biochemical parameters and dietary intake(Continued)
Calcium–total**
1 (275.8–1203.8) 22.9 18.7 15.8 22.3 19.9
2 (435.5–1712.1) 17.9 23.0 23.2 16.3 20.1
3 (532.6–2089.9) 18.4 19.8 20.9 20.7 19.9
4 (723.5–2399.4) 22.3 17.1 19.8 21.2 20.1
5 (782.7–2986.8) 18.4 21.4 20.3 19.6 19.9
serum levels of 25OHD3 were slightly higher in women with a non-manual vs. a manual employment.
The present study shows a positive association between high serum levels of 25OHD3 and moderate alcohol con-sumption, as opposed to high alcohol consumption and zero consumption. This observation is in accordance with a recent study finding that moderate alcohol consumers have a relatively high intake of vitamin D as compared to zero-consumers [43]. Differences with regard to dietary intake may be an explanation behind the low vitamin D levels in zero-consumers, for example vegetarians may have a rela-tively low intake of vitamin D [44] and it is possible to hypothesize that they consume less alcohol as compared to other groups. In general, the concentration of vitamin D has shown to be reduced among high consumers of alco-hol. This could be due to a variation in the dietary intake of vitamin D during different drinking periods with marked reduction during hard-drinking weeks [45].
Another factor closely related to alcohol consumption is smoking, but in the present study there was no associ-ation between smoking habits and serum levels of 25OHD3, and smoking is not likely to explain the asso-ciation seen in the present analysis.
We found that obesity was associated with relatively low serum levels of 25OHD3 and this is similar with several other studies [46-49]. A potential explanation is that poor dietary habits are related to increased BMI [50], and this may also lead to a lower intake of vitamin D in obese women as shown by Tidwell et al. [51]. Adipose tissue contains vitamin D receptors which hypothetically could lead to a sequestration of serum levels of 25OHD3 in obese individuals [52]. Moreover, obesity is more prevalent among people with lower education level [53], and this may be an indirect explanation for the results in this study as women with a manual vs. non-manual work had slightly lower serum levels of 25OHD3. However, educa-tional levels per se as measured in the current study were not associated with serum levels of 25OHD3.
Women born abroad had lower serum levels of 25OHD3 in our report. Different geographical locations [54] and ethnic backgrounds [55,56] have, indeed, been correlated to the vitamin D level. Possible explanations could be re-lated to cultural tradition with traditional dress style other than western dress [57], colour of the skin because darker skin has less capacity to make vitamin D from sunlight [58,59], or a genetic impact on serum vitamin D status probably through the skin synthesis of vitamin D [60].
Table 5 Mean serum vitamin D levels in relation to biochemical parameters and dietary intake
Factor No. Mean (95% CI) T–test (p–value*) ANOVA (p–value)
Albumin
1 191 87.0 (82.5–91.6) Ref.
2 164 91.2 (86.4–95.9) 0.344
3 184 88.7 (84.1–93.3) 0.730
4 180 91.7 (87.0–96.4) 0.058 0.076
Creatinine
1 189 88.4 (84.0–92.9) Ref.
2 168 88.2 (83.5–92.8) 0.337
3 183 87.1 (82.2–91.9) 0.581
4 179 94.5 (89.8–99.2) 0.001 0.003
Phosphate
1 181 89.8 (84.3–95.3) Ref.
2 182 83.5 (79.3–87.8) 0.177
3 176 91.3 (86.7–95.8) 0.308
4 180 93.5 (89.1–97.8) 0.012 <0.001
PTH
1 181 95.3 (90.3–100.3) Ref.
2 178 89.7 (85.5–93.8) 0.035
3 179 89.0 (84.4–93.6) 0.029
4 182 84.5 (79.7–89.3) <0.001 0.002
Calcium
1 198 86.6 (82.1–91.1) Ref.
2 154 85.7 (81.0–90.3) 0.425
3 189 90.9 (86.1–95.8) 0.067
4 178 93.8 (89.2–98.3) <0.001 0.001
Vitamin D–dietary
1 145 81.1 (76.5–85.6) Ref.
2 146 86.7 (82.3–91.1) 0.08
3 145 88.3 (84.1–92.6) 0.02
4 146 92.1 (87.4–96.7) 0.001
5 145 93.1 (88.9–97.4) <0.001 0.001
Calcium–dietary
1 145 87.3 (82.7–91.9) Ref.
2 146 88.2 (83.8–92.6) 0.79
3 145 90.1 (85.7–94.6) 0.39
4 146 88.0 (83.4–92.7) 0.83
5 145 87.6 (83.4–91.9) 0.92 0.92
Vitamin D–total**
1 145 79.9 (75.3–84.6) Ref.
2 146 86.0 (81.8–90.2) 0.06
3 145 90.9 (86.2–95.7) 0.001
4 146 93.5 (89.2–97.8) <0.001
5 145 90.9 (86.7–95.0) 0.001 <0.001
Calcium–total**
1 145 87.6 (82.8–92.3) Ref.
2 146 87.4 (83.2–91.7) 0.97
Table 5 Mean serum vitamin D levels in relation to biochemical parameters and dietary intake(Continued)
3 145 89.4 (84.8–94.0) 0.59
4 146 88.2 (83.6–92.8) 0.85
5 145 88.8 (84.7–92.9) 0.70 0.97
Table 6 Crude and adjusted odds ratios (OR) for high (> 75 nmol/L)vs. low (≤75 nmol/L) vitamin D levels, and regression coefficients (βi) from multiple regression analysis, in relation to biochemical parameters and dietary intake Factor Low (n) High (n) Crude OR (95% CI) Adjusted*OR (95% CI) βi (95% CI) Adjusted*βi \(95% CI)
Albumin
1 68 123 1.00 1.00 Baseline Baseline
2 50 114 1.26 (0.81–1.97) 1.15 (0.72–1.83) 2.66 (–3.02 to 8.34) 1.55 (–3.92 to 7.02)
3 55 129 1.30 (0.84–2.00) 1.22 (0.78–1.92) 0.94 (–4.57 to 6.45) 0.18 (–5.13 to 5.48)
4 56 124 1.22 (0.79–1.89) 1.27 (0.81–2.00) 5.59 (0.05 to 11.13) 6.73 (1.39 to 12.1)
Creatinine
1 66 123 1.00 1.00 Baseline Baseline
2 55 113 1.10 (0.71–1.71) 1.07 (0.68–1.68) 2.40 (–3.23 to 8.02) 2.47 (–2.93 to 7.86)
3 69 114 0.89 (0.58–1.35) 0.84 (0.54–1.30) 1.61 (–3.89 to 7.11) 1.38 (–3.90 to 6.66)
4 39 140 1.93 (1.21–3.06) 1.70 (1.05–2.76) 9.11 (3.58 to 14.6) 6.97 (1.57 to 12.4)
Phosphate
1 62 119 1.00 1.00 Baseline Baseline
2 69 113 0.85 (0.56–1.31) 0.75 (0.48–1.18) −3.79 (–9.34 to 1.76) −4.71 (–10.0 to 0.58)
3 54 122 1.18 (0.76–1.83) 1.12 (0.71–1.78) 3.04 (–2.56 to 8.64) 2.81 (–2.54 to 8.16)
4 44 136 1.61 (1.02–2.55) 1.54 (0.96–2.48) 7.33 (1.77 to 12.9) 6.93 (1.63 to 12.2)
PTH
1 51 130 1.00 1.00 Baseline Baseline
2 45 133 1.16 (0.73–1.85) 1.26 (0.77–2.05) −5.83 (–11.4 to–0.23) −4.76 (–10.1 to 0.62)
3 56 123 0.86 (0.55–1.36) 0.83 (0.52–1.32) −6.28 (–11.9 to–0.70) −6.71 (–12.1 to–1.34)
4 77 105 0.54 (0.35–0.83) 0.59 (0.37–0.93) −11.8 (–17.3 to–6.22) −9.96 (–15.3 to–4.61)
Calcium
1 80 118 1.00 1.00 Baseline Baseline
2 47 107 1.55 (0.99–2.41) 1.66 (1.04–2.64) 2.19 (–3.50 to 7.88) 2.80 (–2.63 to 8.24)
3 57 132 1.57 (1.03–2.39) 1.64 (1.05–2.54) 5.10 (–0.29 to 10.5) 5.79 (0.63 to 11.0)
4 45 133 2.00 (1.29–3.12) 2.18 (1.37–3.47) 10.2 (4.78 to 15.7) 11.1 (5.79 to 16.3)
Vitamin D–dietary
1 68 77 1.00 1.00 Baseline Baseline
2 51 95 1.65 (1.03–2.64) 1.70 (1.04–2.78) 5.64 (–0.57 to 11.9) 5.35 (–0.64 to 11.3)
3 36 109 2.67 (1.63–4.40) 2.92 (1.74–4.91) 7.29 (1.07 to 13.5) 7.50 (1.50 to 13.5)
4 41 105 2.26 (1.39–3.68) 2.52 (1.51–4.19) 11.0 (4.82 to 17.2) 11.5 (5.47 to 17.5)
5 38 107 2.28 (1.52–.07) 2.68 (1.58–4.57) 12.1 (5.86 to 18.3) 11.8 (5.58 to 17.9)
Calcium–dietary
1 53 92 1.00 1.00 Baseline Baseline
2 48 98 1.18 (0.73–1.91) 1.20 (0.73–1.99) 0.87 (–5.41 to 7.16) 0.90 (–5.16 to 6.95)
3 39 106 1.57 (0.95–2.58) 1.63 (0.97–2.73) 2.79 (–3.51 to 9.08) 3.08 (–2.98 to 9.13)
4 46 100 1.25 (0.77–2.04) 1.36 (0.82–2.27) 0.71 (–5.58 to 7.00) 1.26 (–4.81 to 7.34)
5 48 97 1.16 (0.72–1.89) 1.23 (0.74–2.03) 0.30 (–6.00 to 6.60) 0.67 (–5.40 to 6.74)
Vitamin D–total**
1 70 75 1.00 1.00 Baseline Baseline
2 46 100 2.03 (1.26–3.27) 2.05 (1.25–3.38) 6.08 (–0.12 to 12.3) 5.63 (–0.31 to 11.6)
3 39 106 2.54 (1.55–4.14) 3.01 (1.79–5.05) 11.0 (4.80 to 17.2) 12.1 (6.09 to 18.0)
4 40 106 2.47 (1.52–4.03) 2.96 (1.76–4.99) 13.5 (7.36 to 19.7) 14.8 (8.81 to 20.8)
5 39 106 2.54 (1.55–4.14) 2.84 (1.69–4.78) 10.9 (4.72 to 17.1) 11.5 (5.50 to 17.5)
Calcium–total**
1 55 90 1.00 1.00 Baseline Baseline
Another explaining factor is variation in vitamin D intake between different ethnic groups as vitamin D intake is comparatively high in Scandinavian countries [61]. In this group ultraviolet light may not be the only key in the pre-vention of different condition but the role of dietary vita-min D intake, supplement vitavita-min D and calcium come into play [62-64]. In our study, the highest levels of serum 25OHD3 were seen during the summer and in the autumn and these are in agreement with previous studies [65-69]. This is also to be expected as during this season the solar UV radiation reaches adequate levels to have a sufficient vitamin D production (ibid).
We found a positive association between serum levels of 25OHD3, creatinine, phosphate and calcium, and an inverse association with PTH. This has also been seen in other studies [70], and follows the à priori hypothesis given the physiology for vitamin D metabolism. A suffi-cient concentration of vitamin D [71], is essential for bone mineralization and bone turnover [72] and to maintain an optimal vitamin D level requires a close physiological cooperation between vitamin D, calcium and PTH levels [73,74].
The positive association between intake of vitamin D and levels of 25OHD3 in this study was expected and has also been reported by others [75,76]. There was no strong association between calcium intake and levels of 25OHD3 and this has been reported by others [77].
Our study has several methodological strengths. Serum samples were collected in a standardized way and stored at−80°C, laboratory methods had low CVs, and there were a relatively large number of subjects, i.e., good statistical power. The inclusion of both life-style factors and bio-chemical parameters are additional strengths. However, some methodological questions need to be discussed. It may be questioned whether it is appropriate to use a single determination for levels of vitamin D. However, it is re-assuring that a recent cohort study that measured 25OHD3 at 2 times, 3 years apart, found a high correl-ation between levels. Informcorrel-ation on life-style and diet was collected using various questionnaires and this may lead to misclassification. However, validity and reproduci-bility is high for both the socioeconomic questionnaire and the dietary assessment method [23,25].
The results were adjusted for age, season and storage time, and these factors ought not to have confounded the results. It was considered appropriate to adjust only
for these factors, as we wanted to identify groups with low vs. high vitamin D levels, rather than to determine what factors that affected vitamin D levels the most. Concer-ning dietary factors, the residual method was used, which takes into account differences with regard to total energy intake, i.e. the amount of the total dietary intake.
A valid question is whether the associations observed in this cohort can be representative of the whole popula-tion. Although in this study only 40% of the populations have participated and as we have no information about exposure to the studied risk factors in women outside this cohort, observed means and the prevalence for stud-ied factors may not be applicable to all age groups or to the general population. However, as there was a wide distribution of 25OHD3 and other determinants, it was possible to make internal comparisons between subjects. We consider that our estimations of odds ratios were less sensitive to a potential selection bias.
Conclusions
The present population-based cohort study including 727 females found a positive association between serum levels of 25OHD3 and age, oral contraceptive use, moderate al-cohol consumption, blood collection during summer/ au-tumn, creatinine, phosphate, calcium, and a high intake of vitamin D. Low vitamin D levels were associated with obesity, being born outside Sweden and high PTH levels. The study may have implications e. g. for dietary recom-mendations. However, the analysis is a cross-sectional study and it is difficult to suggest lifestyle recommenda-tions as cause- effect relarecommenda-tionships are not clear.
Competing interests
The authors declare that they have no competing interests.
Authors’contributions
Planning and design: MA, JMal, JMan, EW, LZ. Supervision of laboratory analyses: JMal. Statistical analysis: JMan, LZ. Interpretation of results: MA, JMal, JMan, EW, LZ. Draft of paper: LZ. Revision of paper: MA, JMal, JMan, EW, LZ. Final approval of paper: MA, JMal, JMan, EW, LZ. All authors read and approved final manuscript.
Acknowledgement
Financial support was received from The Swedish Research Council (K2007-69X- 20487-01-3), The Gunnar Nilsson Cancer Foundation, The Ernhold Lundström Foundation, The Einar and Inga Nilsson Foundation, The Malmö University Hospital Cancer Research Fund, The Malmö University Hospital Funds and Donations, The Crafoord Foundation, The Region of Skåne, and The Mossfelt Foundation. Ethical approval was given for all projects included in the article (LU 51–90, LU 639–03, Dnr 652/2005 and Dnr 23/2007).
Table 6 Crude and adjusted odds ratios (OR) for high (> 75 nmol/L)vs. low (≤75 nmol/L) vitamin D levels, and regression coefficients (βi) from multiple regression analysis, in relation to biochemical parameters and dietary intake
(Continued)
3 41 104 1.55 (0.95–2.54) 1.63 (0.97–2.71) 1.82 (–4.48 to 8.12) 2.46 (–3.61 to 8.53)
4 49 97 1.21 (0.75–1.96) 1.34 (0.81–2.22) 0.63 (–5.65 to 6.92) 1.68 (–4.39 to 7.75)
5 43 102 1.45 (0.89–2.37) 1.52 (0.91–2.52) 1.22 (–5.07 to 7.52) 1.43 (–4.63 to 7.50)
Author details 1
Department of Surgery, Ystad Hospital, Ystad, Sweden.2Department of Clinical Sciences Malmö Surgery, Lund University, Malmö, Sweden. 3
Department of Surgery, Skåne University Hospital, Malmö/Lund, Sweden. 4Department of Laboratory Medicine, Section for clinical chemistry, Lund
University, Malmö, Sweden.5Department of Clinical Sciences Malmö Nutritional Epidemiology, Lund University, Malmö, Sweden.6Department of Plastic Surgery, Skåne University Hospital, Malmö, Sweden.
Received: 16 January 2013 Accepted: 26 June 2013 Published: 15 August 2013
References
1. Forman JP, Curhan GC, Taylor EN:Plasma 25-hydroxyvitamin D levels and risk of incident hypertension among young women.Hypertension2008, 52(5):828–832.
2. Lee JH, Gadi R, Spertus JA, Tang F, O'Keefe JH:Prevalence of vitamin D deficiency in patients with acute myocardial infarction.Am J Cardiol2011, 107(11):1636–1638.
3. Pilz S, Marz W, Wellnitz B, Seelhorst U, Fahrleitner-Pammer A, Dimai HP, Boehm BO, Dobnig H:Association of vitamin D deficiency with heart failure and sudden cardiac death in a large cross-sectional study of patients referred for coronary angiography.J Clin Endocrinol Metab2008, 93(10):3927–3935.
4. Jorde R, Sneve M, Figenschau Y, Svartberg J, Waterloo K:Effects of vitamin D supplementation on symptoms of depression in overweight and obese subjects: randomized double blind trial.J Intern Med2008, 264(6):599–609.
5. Pittas AG, Dawson-Hughes B:Vitamin D and diabetes.J Steroid Biochem Mol Biol2010,121(1–2):425–429.
6. Foss YJ:Vitamin D deficiency is the cause of common obesity.Med Hypotheses2009,72(3):314–321.
7. Bahlous A, Farjallah N, Bouzid K, Klouz A, Mohsni A, Sahli H, Lakhal M, Sallami S, Abdelmoula J:Hypovitaminosis D in Tunisian osteoporotic postmenopausal women and the relationship with bone fractures.Tunis Med2009,87(3):188–190.
8. Chen P, Hu P, Xie D, Qin Y, Wang F, Wang H:Meta-analysis of vitamin D, calcium and the prevention of breast cancer.Breast Cancer Res Treat2010, 121(2):469–477.
9. Yin L, Grandi N, Raum E, Haug U, Arndt V, Brenner H:Meta-analysis: longitudinal studies of serum vitamin D and colorectal cancer risk. Aliment Pharmacol Ther2009,30(2):113–125.
10. Burgaz A, Akesson A, Michaelsson K, Wolk A:25-hydroxyvitamin D accumulation during summer in elderly women at latitude 60 degrees N.J Intern Med2009,266(5):476–483.
11. Lips P:Worldwide status of vitamin D nutrition.J Steroid Biochem Mol Biol 2010,121(1–2):297–300.
12. Mygind A, Traulsen JM, Norgaard LS, Bissell P:The ambiguity of ethnicity as risk factor of vitamin D deficiency–a case study of Danish vitamin D policy documents.Health Policy2011,102(1):56–63.
13. Benitez-Aguirre PZ, Wood NJ, Biesheuvel C, Moreira C, Munns CF:The natural history of vitamin D deficiency in African refugees living in Sydney.Med J Aust2009,190(8):426–428.
14. Greene-Finestone LS, Berger C, de Groh M, Hanley DA, Hidiroglou N, Sarafin K, Poliquin S, Krieger J, Richards JB, Goltzman D:25-Hydroxyvitamin D in Canadian adults: biological, environmental, and behavioral correlates. Osteoporosis international: a journal established as result of cooperation between the European Foundation for Osteoporosis and the National Osteoporosis Foundation of the USA2011,22(5):1389–1399.
15. Holick MF:Vitamin D: importance in the prevention of cancers, type 1 diabetes, heart disease, and osteoporosis.Am J Clin Nutr2004,79(3):362–371. 16. Daly RM, Gagnon C, Lu ZX, Magliano DJ, Dunstan DW, Sikaris KA, Zimmet
PZ, Ebeling PR, Shaw JE:Prevalence of vitamin D deficiency and its determinants in Australian adults aged 25 years and older: A national, population-based study.Clin Endocrinol (Oxf )2012,77(1):26–35. 17. Jaaskelainen T, Knekt P, Marniemi J, Sares-Jaske L, Mannisto S, Heliovaara M,
Jarvinen R:Vitamin D status is associated with sociodemographic factors, lifestyle and metabolic health.Eur J Nutr2013,52(2):513–25.
18. Weaver SP, Passmore C, Collins B, Fung E:Vitamin D, sunlight exposure, and bone density in elderly African American females of low socioeconomic status.Fam Med2010,42(1):47–51.
19. Bjorneboe GA, Johnsen J, Bjorneboe A, Morland J, Drevon CA:Effect of heavy alcohol consumption on serum concentrations of fat-soluble vitamins and selenium.Alcohol Alcohol Suppl1987,1:533–537. 20. Sutton AL, MacDonald PN:Vitamin D: more than a "bone-a-fide"
hormone.Mol Endocrinol2003,17(5):777–791.
21. Berglund G, Elmstahl S, Janzon L, Larsson SA:The Malmo diet and cancer study, design and feasibility.J Intern Med1993,233(1):45–51.
22. Almquist M, Bondeson AG, Bondeson L, Malm J, Manjer J:Serum levels of vitamin D, PTH and calcium and breast cancer risk-a prospective nested case–control study.International journal of cancer Journal international du cancer2010,127(9):2159–2168.
23. Manjer J, Elmstahl S, Janzon L, Berglund G:Invitation to a population-based cohort study: differences between subjects recruited using various strategies.Scand J Public Health2002,30(2):103–112. 24. Almquist M, Manjer J, Bondeson L, Bondeson AG:Serum calcium and
breast cancer risk: results from a prospective cohort study of 7,847 women.Cancer Causes Control2007,18(6):595–602.
25. Riboli E, Elmstahl S, Saracci R, Gullberg B, Lindgarde F:The Malmo Food Study: validity of two dietary assessment methods for measuring nutrient intake.Int J Epidemiol1997,26(Suppl 1):S161–S173. 26. Mattisson I, Wirfalt E, Gullberg B, Berglund G:Fat intake is more strongly
associated with lifestyle factors than with socio-economic characteristics, regardless of energy adjustment approach.Eur J Clin Nutr2001,55(6):452–461. 27. Wallström P:Diet, lifestyle, antioxidants, and biomarkers of cancer risk. An
epidemiological report from the Malmö Diet and Cancer cohort. Thesis. Malmö: Lund University; 2002.
28. Pinnell AE, Northam BE:New automated dye-binding method for serum albumin determination with bromcresol purple.Clin Chem1978,24(1):80–86. 29. Anker P, Wieland E, Ammann D, Dohner RE, Asper R, Simon W:Neutral
carrier based ion-selective electrode for the determination of total calcium in blood serum.Anal Chem1981,53(13):1970–1974. 30. Vieth R, Bischoff-Ferrari H, Boucher BJ, Dawson-Hughes B, Garland CF,
Heaney RP, Holick MF, Hollis BW, Lamberg-Allardt C, McGrath JJ,et al:The urgent need to recommend an intake of vitamin D that is effective.Am J Clin Nutr2007,85(3):649–650.
31. Chesney RW, Rosen JF, Hamstra AJ, Smith C, Mahaffey K, DeLuca HF: Absence of seasonal variation in serum concentrations of 1,25-dihydroxyvitamin D despite a rise in 25-hydroxyvitamin D in summer.J Clin Endocrinol Metab1981,53(1):139–142.
32. Moan J, Lagunova Z, Lindberg FA, Porojnicu AC:Seasonal variation of 1,25-dihydroxyvitamin D and its association with body mass index and age.J Steroid Biochem Mol Biol2009,113(3–5):217–221.
33. Nakamura K, Nashimoto M, Hori Y, Yamamoto M:Serum
25-hydroxyvitamin D concentrations and related dietary factors in peri- and postmenopausal Japanese women.Am J Clin Nutr2000,71(5):1161–1165. 34. Tsiaras WG, Weinstock MA:Factors influencing vitamin D status.Acta
Derm Venereol2011,91(2):115–124.
35. Bhutto A, Morley JE:The clinical significance of gastrointestinal changes with aging.Curr Opin Clin Nutr Metab Care2008,11(5):651–660. 36. Vieth R, Ladak Y, Walfish PG:Age-related changes in the
25-hydroxyvitamin D versus parathyroid hormone relationship suggest a different reason why older adults require more vitamin D.J Clin Endocrinol Metab2003,88(1):185–191.
37. Sowers MR, Wallace RB, Hollis BW, Lemke JH:Parameters related to 25-OH-D levels in a population-based study of women.Am J Clin Nutr1986,43(4):621–628. 38. van Hoof HJ, van der Mooren MJ, Swinkels LM, Rolland R, Benraad TJ:
Hormone replacement therapy increases serum 1,25-dihydroxyvitamin D: A 2-year prospective study.Calcif Tissue Int1994,55(6):417–419. 39. Thane CW, Bates CJ, Prentice A:Oral contraceptives and nutritional status
in adolescent British girls.Nutr Res2002,22(4):449–462.
40. Nesby-O'Dell S, Scanlon KS, Cogswell ME, Gillespie C, Hollis BW, Looker AC, Allen C, Doughertly C, Gunter EW, Bowman BA: Hypovitaminosis D prevalence and determinants among African American and white women of reproductive age: third National Health and Nutrition Examination Survey, 1988–1994.Am J Clin Nutr2002,76(1):187–192.
41. Gagnon C, Baillargeon JP, Desmarais G, Fink GD:Prevalence and predictors of vitamin D insufficiency in women of reproductive age living in northern latitude.Eur J Endocrinol2010,163(5):819–824.
in peri- and postmenopausal women with and without hormone replacement therapy.Scand J Clin Lab Invest2006,66(3):227–238. 43. Fawehinmi TO, Ilomaki J, Voutilainen S, Kauhanen J:Alcohol consumption
and dietary patterns: the FinDrink study.PLoS One2012,7(6):e38607. 44. Crowe FL, Steur M, Allen NE, Appleby PN, Travis RC, Key TJ:Plasma
concentrations of 25-hydroxyvitamin D in meat eaters, fish eaters, vegetarians and vegans: results from the EPIC-Oxford study.Public Health Nutr2011,14(2):340–346.
45. Bjorneboe GE, Johnsen J, Bjorneboe A, Rousseau B, Pedersen JI, Norum KR, Morland J, Drevon CA:Effect of alcohol consumption on serum concentration of 25-hydroxyvitamin D3, retinol, and retinol-binding protein.Am J Clin Nutr1986,44(5):678–682.
46. Wortsman J, Matsuoka LY, Chen TC, Lu Z, Holick MF:Decreased bioavailability of vitamin D in obesity.Am J Clin Nutr2000,72(3):690–693. 47. Pasco JA, Henry MJ, Nicholson GC, Brennan SL, Kotowicz MA:Behavioural
and physical characteristics associated with vitamin D status in women. Bone2009,44(6):1085–1091.
48. Lagunova Z, Porojnicu AC, Lindberg F, Hexeberg S, Moan J:The dependency of vitamin D status on body mass index, gender, age and season.Anticancer Res2009,29(9):3713–3720.
49. Thuesen B, Husemoen L, Fenger M, Jakobsen J, Schwarz P, Toft U, Ovesen L, Jorgensen T, Linneberg A:Determinants of vitamin D status in a general population of Danish adults.Bone2012,50(3):605–610.
50. Sonestedt E, Wirfalt E, Gullberg B, Berglund G:Past food habit change is related to obesity, lifestyle and socio-economic factors in the Malmo Diet and Cancer Cohort.Public Health Nutr2005,8(7):876–885. 51. Tidwell DK, Valliant MW:Higher amounts of body fat are associated with
inadequate intakes of calcium and vitamin D in African American women.Nutr Res2011,31(7):527–536.
52. Earthman CP, Beckman LM, Masodkar K, Sibley SD:The link between obesity and low circulating 25-hydroxyvitamin D concentrations: considerations and implications.Int J Obes (Lond)2012,36(3):387–96. 53. Hermann S, Rohrmann S, Linseisen J, May AM, Kunst A, Besson H,
Romaguera D, Travier N, Tormo MJ, Molina E,et al:The association of education with body mass index and waist circumference in the EPIC-PANACEA study.BMC Publ Health2011,11:169.
54. Macdonald HM, Mavroeidi A, Fraser WD, Darling AL, Black AJ, Aucott L, O'Neill F, Hart K, Berry JL, Lanham-New SA,et al:Sunlight and dietary contributions to the seasonal vitamin D status of cohorts of healthy postmenopausal women living at northerly latitudes: a major cause for concern?Osteoporosis international: a journal established as result of cooperation between the European Foundation for Osteoporosis and the National Osteoporosis Foundation of the USA2011,22(9):2461–2472. 55. Kaykhaei MA, Hashemi M, Narouie B, Shikhzadeh A, Rashidi H, Moulaei N,
Ghavami S:High prevalence of vitamin D deficiency in Zahedan, southeast Iran.Ann Nutr Metab2011,58(1):37–41.
56. Hagenau T, Vest R, Gissel TN, Poulsen CS, Erlandsen M, Mosekilde L, Vestergaard P:Global vitamin D levels in relation to age, gender, skin pigmentation and latitude: an ecologic meta-regression analysis. Osteoporosis international: a journal established as result of cooperation between the European Foundation for Osteoporosis and the National Osteoporosis Foundation of the USA2009,20(1):133–140.
57. Batieha A, Khader Y, Jaddou H, Hyassat D, Batieha Z, Khateeb M, Belbisi A, Ajlouni K:Vitamin D status in Jordan: dress style and gender discrepancies.Ann Nutr Metab2011,58(1):10–18.
58. Johnson MA, Davey A, Park S, Hausman DB, Poon LW:Age, race and season predict vitamin D status in African American and white octogenarians and centenarians.J Nutr Health Aging2008,12(10):690–695. 59. Jacobs ET, Alberts DS, Foote JA, Green SB, Hollis BW, Yu Z, Martinez ME:
Vitamin D insufficiency in southern Arizona.Am J Clin Nutr2008, 87(3):608–613.
60. Snellman G, Melhus H, Gedeborg R, Olofsson S, Wolk A, Pedersen NL, Michaelsson K:Seasonal genetic influence on serum 25-hydroxyvitamin D levels: a twin study.PLoS One2009,4(11):e7747.
61. Lips P:Vitamin D status and nutrition in Europe and Asia.J Steroid Biochem Mol Biol2007,103(3–5):620–625.
62. Brock K, Huang WY, Fraser DR, Ke L, Tseng M, Stolzenberg-Solomon R, Peters U, Ahn J, Purdue M, Mason RS,et al:Low vitamin D status is associated with physical inactivity, obesity and low vitamin D intake in a large US sample of healthy middle-aged men and women.J Steroid Biochem Mol Biol2010,121(1–2):462–466.
63. Alissa EM, Qadi SG, Alhujaili NA, Alshehri AM, Ferns GA:Effect of diet and lifestyle factors on bone health in postmenopausal women.J Bone Miner Metab2011,29(6):725–735.
64. Dawodu A, Kochiyil J, Altaye N:Pilot study of sunlight exposure and vitamin D status in Arab women of childbearing age.East Mediterr Health J2011,17(7):570–574.
65. Nanri A, Foo LH, Nakamura K, Hori A, Poudel-Tandukar K, Matsushita Y, Mizoue T:Serum 25-hydroxyvitamin d concentrations and season-specific correlates in Japanese adults.J Epidemiol2011,21(5):346–353. 66. Kashi Z, Saeedian F, Akha O, Gorgi MH, Emadi S, Zakeri H:Vitamin D
deficiency prevalence in summer compared to winter in a city with high humidity and a sultry climate.Endokrynol Pol2011,62(3):249–251. 67. Brustad M, Edvardsen K, Wilsgaard T, Engelsen O, Aksnes L, Lund E:
Seasonality of UV-radiation and vitamin D status at 69 degrees north. Photochem Photobiol Sci2007,6(8):903–908.
68. Sambrook PN, Cameron ID, Chen JS, Cumming RG, Durvasula S, Herrmann M, Kok C, Lord SR, Macara M, March LM, Mason RS, Seibel MJ, Wilson N, Simpson JM:Does increased sunlight exposure work as a strategy to improve vitamin D status in the elderly: a cluster randomised controlled trial.Osteoporosis international: a journal established as result of cooperation between the European Foundation for Osteoporosis and the National Osteoporosis Foundation of the USA2012 Feb,23(2):615–24.
69. Webb AR, Kift R, Durkin MT, O'Brien SJ, Vail A, Berry JL, Rhodes LE:The role of sunlight exposure in determining the vitamin D status of the U.K. white adult population.Br J Dermatol2010,163(5):1050–1055. 70. Bates CJ, Carter GD, Mishra GD, O'Shea D, Jones J, Prentice A:In a
population study, can parathyroid hormone aid the definition of adequate vitamin D status? A study of people aged 65 years and over from the British National Diet and Nutrition Survey.Osteoporosis international: a journal established as result of cooperation between the European Foundation for Osteoporosis and the National Osteoporosis Foundation of the USA2003,14(2):152–159.
71. Holick MF:Vitamin D: evolutionary, physiological and health perspectives.Curr Drug Targets2011,12(1):4–18.
72. Rejnmark L, Vestergaard P, Brot C, Mosekilde L:Increased fracture risk in normocalcemic postmenopausal women with high parathyroid hormone levels: a 16-year follow-up study.Calcif Tissue Int2011,88(3):238–245. 73. Steingrimsdottir L, Gunnarsson O, Indridason OS, Franzson L, Sigurdsson G:
Relationship between serum parathyroid hormone levels, vitamin D sufficiency, and calcium intake.JAMA2005,294(18):2336–2341. 74. Saliba W, Barnett O, Rennert HS, Lavi I, Rennert G:The relationship
between serum 25(OH)D and parathyroid hormone levels.Am J Med 2011,124(12):1165–1170.
75. Kruger MC, Schollum LM, Kuhn-Sherlock B, Hestiantoro A, Wijanto P, Li-Yu J, Agdeppa I, Todd JM, Eastell R:The effect of a fortified milk drink on vitamin D status and bone turnover in post-menopausal women from South East Asia.Bone2010,46(3):759–767.
76. Dinizulu T, Griffin D, Carey J, Mulkerrin E:Vitamin D supplementation versus combined calcium and vitamin D in older female patients - an observational study.J Nutr Health Aging2011,15(8):605–608. 77. Lowe NM, Ellahi B, Bano Q, Bangash SA, Mitra SR, Zaman M:Dietary
calcium intake, vitamin D status, and bone health in postmenopausal women in rural Pakistan.J Health Popul Nutr2011,29(5):465–470.
doi:10.1186/1472-6874-13-33
Cite this article as:Shiraziet al.:Determinants of serum levels of vitamin D: a study of life-style, menopausal status, dietary intake, serum calcium,