R E S E A R C H A R T I C L E
Open Access
Analysis of sex differences in open-water
ultra-distance swimming performances in the
FINA World Cup races in 5 km, 10 km and 25 km
from 2000 to 2012
Matthias Alexander Zingg
1, Christoph Alexander Rüst
1, Thomas Rosemann
1, Romuald Lepers
2and Beat Knechtle
1,3*Abstract
Background:The present study investigated the changes in swimming speeds and sex differences for elite male and female swimmers competing in 5 km, 10 km and 25 km open-water FINA World Cup races held between 2000 and 2012.
Methods:The changes in swimming speeds and sex differences across years were analysed using linear, non-linear, and multi-level regression analyses for the annual fastest and the annual ten fastest competitors.
Results:For the annual fastest, swimming speed remained stable for men and women in 5 km (5.50 ± 0.21 and 5.08 ± 0.19 km/h, respectively), in 10 km (5.38 ± 0.21 and 5.05 ± 0.26 km/h, respectively) and in 25 km (5.03 ± 0.32 and 4.58 ± 0.27 km/h, respectively). In the annual ten fastest, swimming speed remained constant in 5 km in women (5.02 ± 0.19 km/h) but decreased significantly and linearly in men from 5.42 ± 0.03 km/h to 5.39 ± 0.02 km/h. In 10 km, swimming speed increased significantly and linearly in women from 4.75 ± 0.01 km/h to 5.74 ± 0.01 km/h but remained stable in men at 5.36 ± 0.21 km/h. In 25 km, swimming speed decreased significantly and linearly in women from 4.60 ± 0.06 km/h to 4.44 ± 0.08 km/h but remained unchanged at 4.93 ± 0.34 km/h in men. For the annual fastest, the sex difference in swimming speed remained unchanged in 5 km (7.6 ± 3.0%), 10 km (6.1 ± 2.5%) and 25 km (9.0 ± 3.7%). For the annual ten fastest, the sex difference remained stable in 5 km at 7.6 ± 0.6%, decreased significantly and linearly in 10 km from 7.7 ± 0.7% to 1.2 ± 0.3% and increased significantly and linearly from 4.7 ± 1.4% to 9.6 ± 1.5% in 25 km.
Conclusions:To summarize, elite female open-water ultra-distance swimmers improved in 10 km but impaired in 25 km leading to a linear decrease in sex difference in 10 km and a linear increase in sex difference in 25 km. The linear changes in sex differences suggest that women will improve in the near future in 10 km, but not in 25 km.
Keywords:Woman, Man, Athlete, Endurance, Performance, Water sport
* Correspondence:beat.knechtle@hispeed.ch
1Institute of General Practice and for Health Services Research, University of Zurich, Zurich, Switzerland
3Gesundheitszentrum St. Gallen, Vadianstrasse 26, 9001 St. Gallen, Switzerland Full list of author information is available at the end of the article
Background
Performance trends in ultra-endurance sports disciplines have been investigated in running [1], cycling [2], triathlon [3,4] and more recently also in long-distance swimming [5-9]. Besides investigating general trends of performance, a widely discussed topic was the specific sex difference in ultra-endurance performance [1,10,11]. Open-water long-distance swimming is a relatively young sports discipline [12] compared to running where marathons exist for more than a century [13]. The first open-water long-distance swimmers were single athletes. On August 24, 1875, Captain Matthew Webb of Great Britain became the first
man to successfully swim the ‘English Channel’ without
assistance [14]. Not until 1986, open-water long-distance swimming was established as a World Cup discipline [15]. Later, open-water long-distance swimming was introduced in the 2008 Olympic Games in Beijing with a 10 km open-water competition which was again held in the 2012 Olympic Games in London [16]. Generally, long-distance swimming is defined as freestyle swimming for distances of longer than 400 m. The International Federation of Natation (FINA) furthermore differentiates between long-distance swimming in competitions of more than 400 m in freestyle and more than 200 m in other swimming disciplines and open-water swimming [15]. On a profes-sional level, FINA lists 5 km, 10 km and 25 km as regular race distances [15]. However, any freestyle open-water swimming competition of more than 400 m would meet the required criteria [15].
The sex difference in open-water long-distance swimming has been investigated in a few studies [5-7,9], whereas more studies concentrated on classical pool swimming distances of 50 m to 1,500 m [17-21]. For example, in the 2000 Olympic Games, women were on average ~11% slower than men in different types of strokes and distances ranging from 50 m to 1,500 m [18]. Thibault et al. [19] reported a mean sex difference in performance of ~8.9% in swimming races in the 2008 Olympic Games in Beijing. Tanaka and Seals [20] reported a decrease in the sex difference in free-style swimming performance with increasing race distance ranging from 50 m to 1,500 m whereas Eichenberger et al. [5-7] found larger sex differences in freestyle swimming performance in race distances longer than the 1,500 m freestyle. To date, the largest values for sex differences in swimming were reported for the split times in swimming in a Deca Iron ultra-triathlon where women were ~45% slower in 38 km freestyle swimming compared to men [22]. However, it might be argued that results in split times never reflect the reality of a single discipline, since swimming split times in a triathlon might be influenced by either cycling or running as subsequent disciplines.
Concerning the sex difference in open-water ultra-distance swimming, recent studies investigated the performances in the 26.4 km‘Lake Zürich Swim’[7], the 34 km‘English
Channel Swim’[5,8] and the’12 h Swim of Zürich’[6]. In both the‘Lake Zürich Swim’[7] and the‘English Channel
Swim’[8] men were faster than women. Depending from
which side of the‘English Channel’the swim was
accom-plished the sex difference in swimming time differed from 6.7% for England-to-France to 8.9% for France-to-England [5]. Eichenberger et al. [5,7] stated that it would be unlikely that women would outperform men in ultra-distance swim-ming in the future. In the’12 h Swim of Zürich’, however, women were able to accomplish similar distances as their male counterparts [6]. The comparison of different
events is even more complicated as for example ‘the
English Channel Swim’is not a race but has to be
com-pleted by each athlete individually with a supporting
crew [14]. Furthermore, in the ’12 h Swim of Zürich’
[6] and the‘Lake Zürich Swim’[7], mainly recreational
athletes compete.
Single human accomplishments recently called the attention of the long-distance swimming community. In the summer of 2013, Diana Nyad [23] crossed the sea between Havana, Cuba, and Key West, Florida, as the first person ever without a shark cage. She accomplished the 177 km swim within 53 hours [23]. Another milestone in long-distance swimming history was set in 2013 when Christoph Wandratsch crossed the length of Lake Constance (66.7 km) in 20 h and 41 min [24]. As Diana Nyad covered a considerably longer distance at the nearly the same swimming speed (3.3 km/h) like Christoph Wandratsch (3.2 km/h), it could be argued that the world’s best long-distance swimmers would be women rather than men. However, the achievements of Christoph Wandratsch and Diana Nyad are not directly comparable due to different water temperatures. Therefore, real open-water ultra-distance swim competitions such as the‘Lake Zürich Swim’[25] are more suitable to investigate the sex difference in ultra-swimming performance than sin-gle achievements. However, the above mentioned competi-tions [5-7] investigated recreational swimmers and never included the entire world elite and more men than women competed in these events. The reported sex differences in ultra-swimming performance may therefore be biased by the number of finishers and the participation of non-professional athletes. Official events held in 5 km, 10 km and 25 km in the World Cup [15] would therefore be a better option to bypass these factors.
These recent controversial findings allow interpretations of both an increase in the sex difference in
perform-ance with increasing race distperform-ance or vice versa.
How-ever, to date, mainly recreational swimmers have been
investigated in in the 26.4 km ‘Lake Zürich Swim’ [7],
the 34 km ‘English Channel Swim’ [5,8] and the ’12 h
generalization for the sex differences in ultra-distance swimming performance.
Since professionalism of athletes might influence the sex difference in performance [9], we intended to in-vestigate the sex differences in swimming performance in 5 km, 10 km and 25 km open-water ultra-distance swimming races in professional athletes. Additionally, in a high-level swimming race, the fastest women may have the possibility to draft behind the fastest men. This might enable the fastest women to reduce the sex difference. The aims of the present study were therefore to investigate the changes in sex differences across years with increasing race distances from 5 km to 25 km. Based upon existing findings for recreational swimmers, we
hypothesized for elite swimmers (i) that men would be
faster than women from 5 km to 25 km, and (ii) the
sex differences in performance would decrease with in-creasing race distance.
Methods
Ethics
All procedures used in the study met the ethical standards of the Swiss Academy of Medical Sciences [26] and were approved by the Institutional Review Board of Kanton St. Gallen, Switzerland, with a waiver of the requirement for informed consent of the participants given the fact that the study involved the analysis of publicly available data.
Data sampling and data analysis
The data set for this study was obtained from the website of the FINA [15]. All athletes who ever finished a 5 km, 10 km and 25 km FINA World Cup open-water swim race between 2000 and 2012 were included. To determine the changes over time in peak swimming speed and in the sex
difference in swimming speed, race times of the annual top and the annual top ten women and men were analysed. To increase the comparability between different race distances, all race times were converted to swimming speed (km/h) using the equation [swimming speed (km/h)] = [race distance (km)]/[race time (h)]. When less than the needed amount of athletes was available in a certain year for a certain distance, that year was excluded from analysis. To estimate the power density of the swimmers, the time differences between the last and the first finisher as well as between tenth and the first finisher were analysed and expressed as a percentage of the winner performance for both women and men.
Statistical analysis
In order to increase the reliability of the data analyses, each set of data was tested for normal distribution and for homogeneity of variances prior to statistical analyses. Normal distribution was tested using a D’Agostino and Pearson omnibus normality test and homogeneity of variances was tested using a Levene’s test. Trends in participation were analysed using regression analysis with ’straight line‘ and ’exponential growth equation‘
model where for each set of data (e.g. each sex) both
models where compared using Akaike’s Information Criteria (AICc) to decide which model showed the highest probability of correctness. Single and multi-level regression analyses were used to investigate changes across years in swimming speed and age of the athletes. A hierarchical regression model was used to avoid the impact of a cluster-effect on results in case one athlete finished more than once in the annual top or the annual top ten. Furthermore, regression analyses of swimming speed were corrected for age of the athletes to prevent
Table 1 Number of finishes and finishers in open-water swim races from 2000 to 2012
5 km 10 km 25 km
Women Men Overall Women Men Overall Women Men Overall
1 Finish 118 155 273 89 127 215 53 78 130
2 Finishes 54 54 108 36 47 83 10 21 31
3 Finishes 17 22 39 24 27 51 6 8 14
4 Finishes 12 10 22 15 16 31 6 8 13
5 Finishes 5 5 10 13 10 23 5 5 11
6 Finishes 3 6 9 7 5 11 3 6 9
7 Finishes 2 3 5 6 6 13 3 1 4
8 Finishes 2 3 5 3 7 10 1 1
9 Finishes 2 1 3 1 1 2 2 1 3
10 Finishes 1 1 3 1 4 1 1
> 10 Finishes 3 2 5 3 6 9 2 3 5
Finishes 454 521 975 545 643 1,188 229 298 527
A
B
C
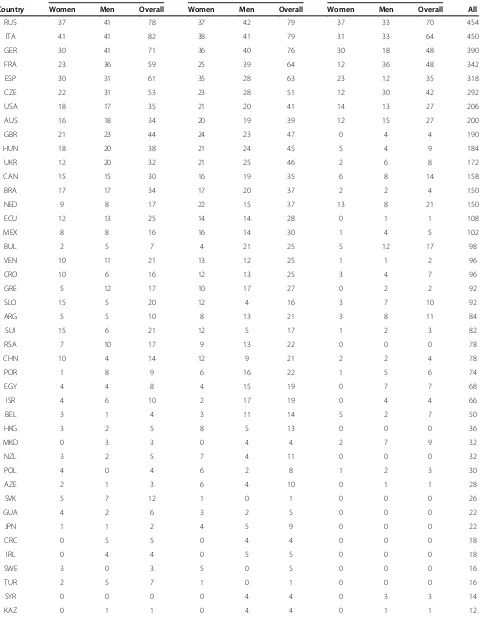
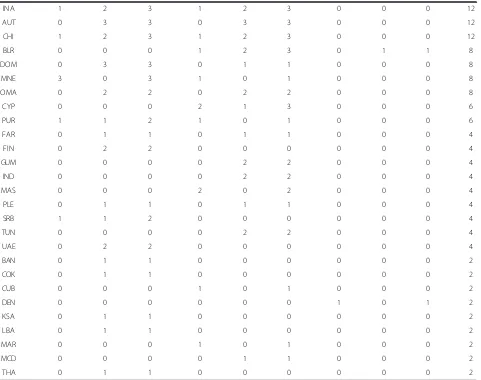
Table 2 Number of finishes regarding the origin of the athletes
5 km 10 km 20 km
Country Women Men Overall Women Men Overall Women Men Overall All
RUS 37 41 78 37 42 79 37 33 70 454
ITA 41 41 82 38 41 79 31 33 64 450
GER 30 41 71 36 40 76 30 18 48 390
FRA 23 36 59 25 39 64 12 36 48 342
ESP 30 31 61 35 28 63 23 12 35 318
CZE 22 31 53 23 28 51 12 30 42 292
USA 18 17 35 21 20 41 14 13 27 206
AUS 16 18 34 20 19 39 12 15 27 200
GBR 21 23 44 24 23 47 0 4 4 190
HUN 18 20 38 21 24 45 5 4 9 184
UKR 12 20 32 21 25 46 2 6 8 172
CAN 15 15 30 16 19 35 6 8 14 158
BRA 17 17 34 17 20 37 2 2 4 150
NED 9 8 17 22 15 37 13 8 21 150
ECU 12 13 25 14 14 28 0 1 1 108
MEX 8 8 16 16 14 30 1 4 5 102
BUL 2 5 7 4 21 25 5 12 17 98
VEN 10 11 21 13 12 25 1 1 2 96
CRO 10 6 16 12 13 25 3 4 7 96
GRE 5 12 17 10 17 27 0 2 2 92
SLO 15 5 20 12 4 16 3 7 10 92
ARG 5 5 10 8 13 21 3 8 11 84
SUI 15 6 21 12 5 17 1 2 3 82
RSA 7 10 17 9 13 22 0 0 0 78
CHN 10 4 14 12 9 21 2 2 4 78
POR 1 8 9 6 16 22 1 5 6 74
EGY 4 4 8 4 15 19 0 7 7 68
ISR 4 6 10 2 17 19 0 4 4 66
BEL 3 1 4 3 11 14 5 2 7 50
HKG 3 2 5 8 5 13 0 0 0 36
MKD 0 3 3 0 4 4 2 7 9 32
NZL 3 2 5 7 4 11 0 0 0 32
POL 4 0 4 6 2 8 1 2 3 30
AZE 2 1 3 6 4 10 0 1 1 28
SVK 5 7 12 1 0 1 0 0 0 26
GUA 4 2 6 3 2 5 0 0 0 22
JPN 1 1 2 4 5 9 0 0 0 22
CRC 0 5 5 0 4 4 0 0 0 18
IRL 0 4 4 0 5 5 0 0 0 18
SWE 3 0 3 5 0 5 0 0 0 16
TUR 2 5 7 1 0 1 0 0 0 16
SYR 0 0 0 0 4 4 0 3 3 14
a misinterpretation of an ‘age-effect’as a ‘time-effect’. Since it is assumed that the change in sex difference in endurance performance is non-linear [27], we additionally calculated the non-linear regression model fitting the data best. We compared the best-fit non-linear models to the linear models using AIC and F-test in order to show which model would be the most appropriate to explain the trend of the data. Statistical analyses were performed using IBM SPSS Statistics (Version 21, IBM SPSS, Chicago, IL, USA), CurveExpert Professional (Version 2.0.3, Hyams D.G.) and GraphPad Prism (Version 6.01, GraphPad Software, La Jolla, CA, USA). Significance was accepted at p< 0.05 (two-sided fort-tests). Data in the text and figures are given as mean ± standard deviation (SD).
Results
Participation trends
Table 1 presents the numbers of both finishes and finishers. Most swimmers competed in 5 km, followed by 10 km and 25 km. Between 2000 and 2012, on average 38 ± 16 women and 43 ± 17 men competed in a 5 km, 45 ± 29 women and 57 ± 35 men in a 10 km, and 19 ± 7 women and 25 ± 9 men in a 25 km FINA World Cup event. The number of finishers in 5 km increased significantly for men (r2= 0.36, p< 0.05) but not for women and overall finishers (p> 0.05) (Figure 1A). In 10 km, the number of finishers increased significantly for both women (r2= 65,p= 0.0014) and men (r2= 0.72, p= 0.0004) (Figure 1B). In 25 km, the overall number of finisher was unchanged (p> 0.05) (Figure 1C).
Table 2 Number of finishes regarding the origin of the athletes(Continued)
INA 1 2 3 1 2 3 0 0 0 12
AUT 0 3 3 0 3 3 0 0 0 12
CHI 1 2 3 1 2 3 0 0 0 12
BLR 0 0 0 1 2 3 0 1 1 8
DOM 0 3 3 0 1 1 0 0 0 8
MNE 3 0 3 1 0 1 0 0 0 8
OMA 0 2 2 0 2 2 0 0 0 8
CYP 0 0 0 2 1 3 0 0 0 6
PUR 1 1 2 1 0 1 0 0 0 6
FAR 0 1 1 0 1 1 0 0 0 4
FIN 0 2 2 0 0 0 0 0 0 4
GUM 0 0 0 0 2 2 0 0 0 4
IND 0 0 0 0 2 2 0 0 0 4
MAS 0 0 0 2 0 2 0 0 0 4
PLE 0 1 1 0 1 1 0 0 0 4
SRB 1 1 2 0 0 0 0 0 0 4
TUN 0 0 0 0 2 2 0 0 0 4
UAE 0 2 2 0 0 0 0 0 0 4
BAN 0 1 1 0 0 0 0 0 0 2
COK 0 1 1 0 0 0 0 0 0 2
CUB 0 0 0 1 0 1 0 0 0 2
DEN 0 0 0 0 0 0 1 0 1 2
KSA 0 1 1 0 0 0 0 0 0 2
LBA 0 1 1 0 0 0 0 0 0 2
MAR 0 0 0 1 0 1 0 0 0 2
MCD 0 0 0 0 1 1 0 0 0 2
THA 0 1 1 0 0 0 0 0 0 2
Table 2 presents the numbers of finishes regarding the origin of the competitors. When all three race distances were considered, most of the finishes were achieved by competitors originating from Russia, followed by swimmers originating from Italy and Germany.
Change in swimming speed across the years
For the annual fastest, swimming speed remained stable across years in 5 km (5.50 ± 0.21 km/h for men and 5.08 ± 0.19 km/h for women) (Figure 2A), in 10 km (5.38 ± 0.21 km/h for men and 5.05 ± 0.26 km/h for
A
B
C
D
E
F
women) (Figure 2B) and in 25 km (5.03 ± 0.32 km/h for men and 4.58 ± 0.27 km/h for women) (Figure 2C) also when corrected for multiple finishes and age of the athletes with multiple finishes (Table 3). Considering the annual ten fastest, swimming speed remained constant in 5 km in women (5.02 ± 0.19 km/h) but decreased signifi-cantly and linearly (Table 4) in men from 5.42 ± 0.03 km/h to 5.39 ± 0.02 km/h (Figure 2D) also when controlled for multiple finishes and age of the athletes with mul-tiple finishes (Table 3). In 10 km, swimming speed in-creased significantly and linearly (Table 4) in women from 4.75 ± 0.01 km/h (2002) to 5.74 ± 0.01 km/h (2012) but remained stable in men at 5.36 ± 0.21 km/h (Figure 2E) also when controlled for multiple finishes and age of the athletes with multiple finishes (Table 3). In 25 km, swimming speed decreased significantly and linearly (Table 4) in women from 4.60 ± 0.06 km/h to 4.44 ± 0.08 km/h but remained unchanged at 4.93 ± 0.34 km/h in men (Figure 2F) also when controlled for multiple finishes and age of the athletes with multiple finishes (Table 3).
Changes in sex differences in swimming performance across the years
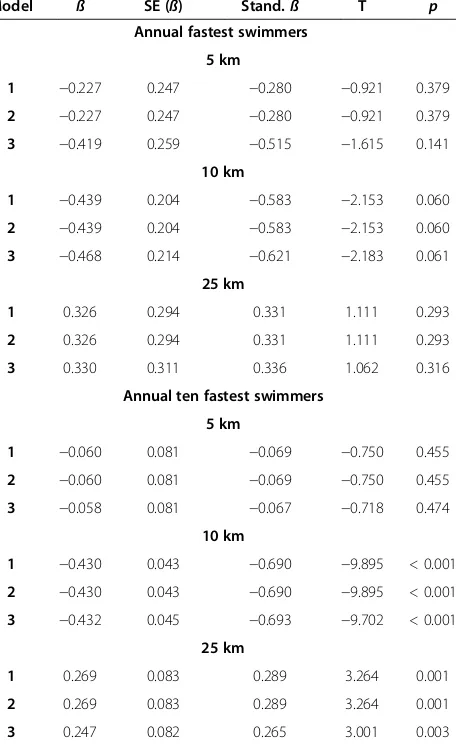
For the annual fastest, the sex difference in swimming speed remained unchanged in 5 km (7.6 ± 3.0%) (Figure 3A), in 10 km (6.1 ± 2.5%) (Figure 3B) and in 25 km (9.0 ± 3.7%) (Figure 3C) also when controlled for multiple finishes (Table 5). For the annual ten fastest, the sex difference remained stable in 5 km at 7.65 ± 0.59% (Figure 3D), decreased significantly and linearly (Table 6) in 10 km from 7.7 ± 0.7% (2002) to 1.2 ± 0.3% (2012) (Figure 3E) and increased significantly and linearly (Table 6) from 4.7 ± 1.4% to 9.6 ± 1.5% in 25 km (Figure 3F) also when corrected for multiple finishes (Table 5). For the annual ten fastest, the sex difference was stable at 7.6 ± 0.6% in 5 km, decreased significantly and linearly (Table 6) from 7.7 ± 0.7% (2002) to 1.2 ± 0.3% (2012) in 10 km and increased significantly and linearly from 4.7 ± 1.4% to 9.6 ± 1.5% in 25 km.
Table 3 Multi-level regression analyses for swimming speed of the annual fastest and the annual ten fastest swimmers (Model 1) with correction for multiple finishes (Model 2) and age of athletes with multiple finishes (Model 3)
Model ß SE (ß) Stand.ß T p
Annual fastest swimmers
5 km women
1 0.002 0.017 0.031 0.097 0.924
2 0.002 0.017 0.031 0.097 0.924
3 0.002 0.024 0.037 0.081 0.937
5 km men
1 −0.012 0.017 −0.210 −0.678 0.513
2 −0.012 0.017 −0.210 −0.678 0.513
3 −0.008 0.019 −0.142 −0.413 0.689
10 km women
1 0.033 0.024 0.409 1.346 0.211
2 0.033 0.024 0.409 1.346 0.211
3 0.048 0.038 0.591 1.250 0.247
10 km men
1 0.004 0.021 0.061 0.183 0.859
2 0.004 0.021 0.061 0.183 0.859
3 0.082 0.031 1.278 2.622 0.031
25 km women
1 −0.026 0.022 −0.352 −1.190 0.262
2 −0.026 0.022 −0.352 −1.190 0.262
3 −0.041 0.021 −0.560 −1.926 0.086
25 km men
1 −0.009 0.027 −0.110 −0.349 0.734
2 −0.009 0.027 −0.110 −0.349 0.734
3 0.014 0.032 0.159 0.433 0.676
Annual ten fastest swimmers
5 km women
1 −0.007 0.005 −0.142 −1.559 0.122
2 −0.007 0.005 −0.142 −1.559 0.122
3 −0.006 0.005 −0.113 −1.236 0.219
5 km men
1 −0.012 0.005 −0.214 −2.377 0.019
2 −0.012 0.005 −0.214 −2.377 0.019
3 −0.012 0.005 −0.218 −2.424 0.017
10 km women
1 0.036 0.007 0.421 4.820 < 0.001
2 0.036 0.007 0.421 4.820 < 0.001
3 0.035 0.007 0.419 4.796 < 0.001
10 km men
1 0.006 0.006 0.089 0.929 0.355
2 0.006 0.006 0.089 0.929 0.355
3 0.005 0.006 0.073 0.727 0.469
Table 3 Multi-level regression analyses for swimming speed of the annual fastest and the annual ten fastest swimmers (Model 1) with correction for multiple finishes (Model 2) and age of athletes with multiple finishes (Model 3)(Continued)
25 km women
1 −0.023 0.007 −0.312 −3.548 0.001
2 −0.023 0.007 −0.312 −3.548 0.001
3 −0.023 0.007 −0.310 −3.498 0.001
25 km men
1 −0.011 0.009 −0.114 −1.250 0.214
2 −0.011 0.009 −0.114 −1.250 0.214
Power density in swimming performance in finishers The power density in swimming speed of the 1st to the 10th finisher showed no changes in 5 km (Figure 4A), 10 km (Figure 4B), and 25 km (Figure 4C), also when corrected for multiple finishes and age of the athletes with multiple finishes (Table 7). Also for the 1st to the last finisher, no changes in power density were found in 5 km (Figure 4D), 10 km (Figure 4E), and 25 km (Figure 4F), also when corrected for multiple finishes and age of the athletes with multiple finishes (Table 7). The power dens-ity from the 1st to the 10th finisher was similar in 5 km
(−1.95 ± 2.10% for women and−1.83 ± 1.44% for men),
10 km (−0.83 ± 1.52% for women and−0.55 ± 0.62% for men)
and 25 km (−3.31 ± 3.27% for women and−3.76 ± 2.97%
for men). For the 1st to the last finisher, the power density
was lower in women (−18.13 ± 6.54%) compared to men
(−24.21 ± 12.0%) in 5 km, higher in women (−22.21 ± 8.12%) compared to men (−17.51 ± 4.60%) in 10 km and lower in women (−13.77 ± 6.01%) compared to men (−16.22 ± 6.51%) in 25 km.
Change in the age of peak swimming speed
For the annual fastest in 5 km, the age of the peak swimming speed decreased in women (Figure 5A) from 28 years to 22 years whereas it remained unchanged in men at 26.7 ± 3.6 years (Table 8). In 10 km (Figure 5B), the age of the fastest women decreased from 29 years (2002) to 19 years (Table 8). For the fastest men, how-ever, it increased from 20 years (2002) to 28 years. In 25 km, the age of the fastest women and men (Figure 5C) remained unchanged at 26.7 ± 4.0 and 27.9 ± 3.8 years, respectively (Table 8). For the annual ten fastest, the age of peak swimming speed remained unchanged for women and men in 5 km (Figure 5D) at 22.4 ± 1.2 and 24.8 ± 0.9 years (Table 8). In 10 km, the age of the fastest women remained unchanged at 23.4 ± 0.9 years (Figure 5E) but increased in men from 24.2 ± 2.6 to 28.4 ± 4.8 years (Table 8). In 25 km (Figure 5F), the age of the fastest women and men remained unchanged at 23.7 ± 0.9 and 27.2 ± 1.1 years, respectively (Table 8).
Table 4 Comparison of linear and non-linear regression analysis of changes in swimming speed across years to determine which model is the best
Swimming speed Kind of regression
Sum of squares
DOF AICc Best regression AIC-Test
Best regression F-Test
Delta Probability Likelihood
Annual fastest men 5 km Polynomial 0.26 5 −16.81 Linear Linear 20.03 4.4 e−05 99.9%
Linear 0.45 10 −36.85
Annual fastest women 5 km Polynomial 0.33 0 −21.12 Linear Undetermined 16.50 0.00026 99.9%
Linear 0.42 10 −37.63
Annual fastest men 10 km Polynomial 0.21 5 −21.46 Linear Linear 11.26 0.0035 99.6%
Linear 0.44 9 −32.72
Annual fastest women 10 km Polynomial 0.064 0 −36.51 Polynomial Undetermined 6.81 0.032 96.7%
Linear 0.59 9 −29.70
Annual fastest men 25 km Polynomial 0.98 0 −7.99 Linear Undetermined 17.78 0.00013 99.9%
Linear 1.14 10 −25.77
Annual fastest women 25 km Polynomial 0.49 0 −16.20 Linear Undetermined 15.16 0.00050 99.9%
Linear 0.71 10 −31.37
Annual 10 fastest men 5 km Polynomial 0.31 0 −21.52 Linear Undetermined 11.17 0.0037 99.6%
Linear 0.64 10 −32.69
Annual 10 fastest women 5 km Polynomial 0.26 5 −16.95 Linear Linear 22.44 1.33 e−05 99.9%
Linear 0.36 10 −39.39
Annual 10 fastest men 10 km Polynomial 0.15 0 −26.60 Linear Undetermined 6.11 0.044 95.5%
Linear 0.44 9 −32.71
Annual 10 fastest women 10 km Polynomial 0.12 4 −16.10 Linear Linear 12.82 0.0016 99.8%
Linear 0.63 9 −28.93
Annual 10 fastest men 25 km Polynomial 1.80 0 −0.72 Linear Undetermined 16.52 0.00025 99.9%
Linear 2.33 10 −17.24
Annual 10 fastest women 25 km Polynomial 0.78 0 −10.66 Linear Linear 20.74 3.12 e−05 99.9%
Discussion
This study investigated the changes in sex differences in ultra-swimming performance across years with in-creasing race distance from 5 km to 25 km and it was hypothesized that men would be faster than women from 5 km to 25 km and the sex difference in perform-ance would be lowest in the longest race distperform-ances. As
hypothesized, men were always faster than women for all distances. Women improved in 10 km but impaired in 25 km leading to a linear decrease in sex difference in 10 km and a linear increase in sex difference in 25 km. The linear changes in sex differences suggest that women will improve in the near future in 10 km, but not in 25 km.
A
B
C
D
E
F
Participation in 5 km, 10 km and 25 km FINA World Cup races
The numbers of participants increased for men in 5 km and for both sexes in 10 km whereas the numbers of participants were constant in all other distances. Most swimmers competed and finished in 5 km, followed by 10 km and 25 km. As FINA World Cup races are orga-nized on a professional base,i.e.allowing only a reserved number of participants [15] and a great increase in the numbers of participants were not to be expected. From each sex, the five fastest finishers of last year’s World Cup races and the five fastest Olympians can enter each year a series of races. Nevertheless, an increasing number of races each year provides for more possible participants. Furthermore, the number of open-water ultra-distance swimming events is small compared to indoor pool swimming [15].
Changes in swimming speeds across years
An interesting finding was that swimming speeds remained stable across years for the annual fastest swimmers in 5 km, 10 km and 25 km. As the sex difference in swimming speed was constant in the annual fastest finishers, neither a trend of increase nor decrease in swimming speed was found nor it seems as performance in the best long-distance swimmers competing from 5 km to 25 km has plateaued. A possible explanation may by the short period of time investigated of 13 years, as other authors found an increase in swimming speed in long-distance swimming over longer periods [5-7,28]. For example, Nevill et al. reported an in-crease for swimming speeds in pool swimmers competing across all distances during the 60’s and 70’s when investi-gating data from 1956–2006, while swimming speeds plat-eaued in the last thirty years [28]. Therefore, swimming speed in long-distance may level off as short- and middle-distance swimming did 35 years ago.
Sex differences in swimming speeds of the annual fastest swimmers
The best models to describe the changes in sex differences in swimming speed were linear in both the annual fastest and the annual ten fastest competitors. It has been stated that linear models cannot keep up with the gender gap in sport and non-linear models would be better [27]. Our findings, however, cannot support this theory. For the annual fastest swimmers, the sex differences remained unchanged in 5 km, in 10 km and in 25 km.
Performance in all endurance sports depends on the athlete’s ability to produce a high energy output constantly on an economical level. Both physiological and anthropo-metric differences between sexes seem to influence the sex difference in performance. Maximum oxygen uptake (VO2max) was reported as the most significant predictor variable for endurance performance [29]. While elite male athletes reach a VO2max of up to 85 ml · min−1· kg−1
[30], women’s VO2max is lower with a maximum of
70 ml · min−1· kg−1[31]. VO2max is mainly dependent from the heart’s performance and the lung capacity [32]. The maximal cardiac output in elite male athletes is higher than in elite female athletes [33]. The same
was reported for lung capacity [34]. VO2max directly
depends from both maximal cardiac output and lung capacity and is therefore larger in men than in women [32]. Therefore, men have generally more physiological potential to perform at a higher level than women.
The sex difference in performance was often discussed in other sports disciplines such as running [35,36], cycling [37], swimming [5-7], or the combination of the three in triathlon [4,38]. The probably most controversial discussed publication dates back to 1992, when Whipp and Ward [35] used linear statistical models to prove their point of women outrunning men in marathon running. A series
Table 5 Multi-level regression analyses for sex difference in swimming speed of the annual fastest and the annual ten fastest swimmers (Model 1) with correction for multiple finishes (Model 2) and age of the athletes with multiple finishes (Model 3)
Model ß SE (ß) Stand.ß T p
Annual fastest swimmers
5 km
1 −0.227 0.247 −0.280 −0.921 0.379
2 −0.227 0.247 −0.280 −0.921 0.379
3 −0.419 0.259 −0.515 −1.615 0.141
10 km
1 −0.439 0.204 −0.583 −2.153 0.060
2 −0.439 0.204 −0.583 −2.153 0.060
3 −0.468 0.214 −0.621 −2.183 0.061
25 km
1 0.326 0.294 0.331 1.111 0.293
2 0.326 0.294 0.331 1.111 0.293
3 0.330 0.311 0.336 1.062 0.316
Annual ten fastest swimmers
5 km
1 −0.060 0.081 −0.069 −0.750 0.455
2 −0.060 0.081 −0.069 −0.750 0.455
3 −0.058 0.081 −0.067 −0.718 0.474
10 km
1 −0.430 0.043 −0.690 −9.895 < 0.001
2 −0.430 0.043 −0.690 −9.895 < 0.001
3 −0.432 0.045 −0.693 −9.702 < 0.001
25 km
1 0.269 0.083 0.289 3.264 0.001
2 0.269 0.083 0.289 3.264 0.001
of publications followed, discussing the subject intensely [27,36,39,40]. So far, in neither of the mentioned sports, women were ever able to outperform men with very rare single exceptions such as the initially mentioned Diana Nyad swimming from Cuba to Florida [23]. In triathlons from the classical Olympic distance (i.e.1.5 km swimming, 40 km cycling and 10 km running) [41] to Deca Iron ultra-triathlons (i.e.38 km swimming, 1,800 km cycling, 422 km running) [22], the authors found sex differences of perform-ance that seemed to increase with increasing duration or distance of the triathlon event.
Swimming speed results in single open-water long-distance performances of Diana Nyad and Christoph Wandratsch are hard to compare as water temperatures and weather cannot be influenced but have an influence on performance [7,42]. Effects of water temperature and differ-ent means to avoid undercooling or overheating have been discussed differently [43]. Both undercooling [43] and overheating [44] threaten performance after prolonged exposure. However, specific anthropometric characteris-tics such as body fat seemed to influence performance in long-distance swimming. A high body fat percentage was favourable of withstanding the cold of the water [45,46]. To avoid large differences between different races, the highest as well as the lowest temperature in long-distance swimming are defined by FINA. Above 31°C and below 16°C there are no races at all, between 16°C and 26°C swimmers may use wetsuits [15].
Differences in performance and sex differences in performance for the annual ten fastest swimmers
In the annual ten fastest, women became faster in 10 km but slower in 25 km whereas men showed no changes in performance. These changes in female performances led to a linear decrease in sex difference in 10 km and a
linear increase in sex difference in 25 km. In the annual fastest, however, no changes occurred in both swimming speeds and sex differences in swimming speeds. There-fore, women could not generally reduce the gender gap in ultra-distance swimming performance, especially in the longer race distances.
In contrast to the annual fastest swimmers, the annual ten fastest women became faster in 10 km between 2000 and 2012. Maybe the 10 km race is an ideal race for women. A recent study investigating the performance in 10 km open-water swimming including World Cup races, European Championships, World Championships and Olympic Games from 2008 to 2012 showed an unchanged swimming speed for women but perform-ance impaired in men [9]. A possible explanation may be drafting as the 10 km could be the optimal distance (i.e.swimming speed and duration of the race) to draft a whole race. In 5 km, the sex difference in muscle strength may allow men to outpace women whereas 25 km may be too long to simply rely on drafting for women. However, other unknown factors may be present in 10 km. As our results are in line with findings for recreational athletes [5-7] it seems rather unlikely that women will outperform men in the future in longer swim distances. This assumption will be supported by the unchanged power density in swimming speed for both women and men.
The sex difference in performance between female and male endurance and ultra-endurance athletes might be partially explained by differences in anthropometric characteristics between women and men such as differ-ences in skeletal muscle mass and body fat. Knechtle et al. [22] argued that the increase in sex difference with increasing race distance in ultra-races such as an ultra-triathlon was most probably due to the lower
Table 6 Comparison of linear and non-linear regression analysis of changes in sex difference across years to determine which model is the best
Sex difference Kind of regression
Sum of squares
DOF AICc Best regression AIC-Test
Best regression F-Test
Delta Probability Likelihood
Annual fastest 5 km Polynomial 58.22 0 40.95 Linear Undetermined 13.80 0.0010 99.8%
Linear 94.36 10 27.14
Annual fastest 10 km Polynomial 21.10 0 27.16 Linear Undetermined 10.19 0.0060 99.3%
Linear 41.18 9 16.96
Annual fastest 25 km Polynomial 80.84 0 44.89 Linear Undetermined 13.58 0.0011 99.8%
Linear 133.50 10 31.31
Annual 10 fastest 5 km Polynomial 81.01 0 44.91 Linear Undetermined 14.82 0.00060 99.9%
Linear 120.58 10 30.08
Annual 10 fastest 10 km Polynomial 8.39 0 17.02 Linear Undetermined 2.93 0.18 81.2%
Linear 31.70 9 14.08
Annual 10 fastest 25 km Polynomial 119.43 0 49.57 Linear Linear 20.29 3.9 e−05 99.9%
skeletal muscle mass in women. It has been shown that male ultra-endurance athletes had a higher skeletal muscle mass than female ultra-endurance athletes [47-51]. For example, male Ironman triathletes with 41 kg skeletal muscle mass had a 46% higher skeletal muscle mass compared to female Ironman triathletes with 28 kg skel-etal muscle mass [48]. Considering ultra-runners, male
ultra-runners with 38 kg skeletal muscle mass [49] had a 38% higher muscle mass compared to female ultra-runners with 27.4 kg [50]. For ultra-swimmers [51], the sex difference in skeletal muscle mass was considerably higher compared to runners [49,50]. Male open-water ultra-swimmers with 42 kg of skeletal muscle mass had 45% more skeletal muscle mass compared to female
A
B
C
D
E
F
open-water ultra-swimmers with 29 kg of skeletal muscle mass [51]. These differences in skeletal muscle mass between female and male ultra-endurance athletes might explain the increase in sex difference with increasing race length in open-water ultra-distance swimmers.
The age of peak performance in elite long-distance swimmers
The age of peak swimming speed in these elite open-water ultra-swimmers was at ~22-28 years depending upon the race distance. These swimmers were therefore con-siderably younger compared to recreational swimmers investigated by Eichenberger et al. [6,7] where the age of peak swimming speed was at ~30-39 years in recreational 12-hour pool swimmers [6] and recreational 26.4 km open-water swimmers [7]. In pool swimming, elite athletes were younger than open-water ultra-swimmers as reported by Berthelot et al. [52] with ~21 years for elite pool-swimmers competing in 50 m to 1,500 m freestyle. However, Berthelot et al. [52] reported differences in the age of peak swimming speed regarding the length of a race. The peak perform-ance in 1,500 m freestyle was achieved at a younger age of ~18 years compared to the 50 m freestyle at ~23 years, respectively [52]. In elite freestyle swimmers competing at national level, the age of peak swimming speed was at ~19-25 years when all distances were considered [21]. In 50 m freestyle, women were fastest at the age of ~20 years and men at the age of ~23 years. Considering the longest pool distance, women were fastest in 1,500 m freestyle at the age of ~18 years and men at the age of ~20 years [21].
Considering the results of the present study it seems likely that the age of peak swimming speed decreased from ~20-23 years in of 50 m to ~18-20 years in 1,500 m to increase again to ~23-27 years in 25 km events. Recent investigations [53,54] addressed a potential association of the age of peak performance with the length of an event.
Table 7 Multi-level regression analyses for power density from the first to the tenth finisher and from the first to the last finisher (Model 1) with correction for multiple finishes (Model 2) and age of the athletes with multiple finishes (Model 3)
Model ß SE (ß) Stand.ß T p
Power density from the first to tenth finisher
5 km women
1 −0.251 0.156 −0.454 −1.610 0.139
2 −0.251 0.156 −0.454 −1.610 0.139
3 −0.231 0.208 −0.418 −1.113 0.295
5 km men
1 0.027 0.122 0.070 0.222 0.829
2 0.027 0.122 0.070 0.222 0.829
3 0.045 0.135 0.117 0.336 0.745
10 km women
1 0.097 0.150 0.212 0.650 0.532
2 0.097 0.150 0.212 0.650 0.532
3 0.160 0.164 0.348 0.974 0.359
10 km men
1 0.069 0.058 0.365 1.176 0.270
2 0.069 0.058 0.365 1.176 0.270
3 0.027 0.087 0.143 0.308 0.766
25 km women
1 0.023 0.276 0.026 0.082 0.936
2 0.023 0.276 0.026 0.082 0.936
3 0.057 0.290 0.066 0.197 0.848
25 km men
1 0.184 0.244 0.232 0.755 0.468
2 0.184 0.244 0.232 0.755 0.468
3 0.199 0.287 0.251 .0695 0.505
Power density from the first to last finisher
5 km women
1 −0.576 0.520 −0.330 −1.107 0.294
2 −0.576 0.520 −0.330 −1.107 0.294
3 −0.442 0.536 −0.254 −0.825 0.431
5 km men
1 −0.079 1.010 −0.025 −0.078 0.940
2 −0.079 1.010 −0.025 −0.078 0.940
3 −0.005 1.118 −0.002 −0.005 0.996
10 km women
1 −0.683 0.785 −0.279 −0.871 0.407
2 −0.683 0.785 −0.279 −0.871 0.407
3 −0.915 10.056 −0.373 −0.867 0.411
10 km men
1 −0.893 0.354 −0.644 −2.523 0.033
2 −0.893 0.354 −0.644 −2.523 0.033
Table 7 Multi-level regression analyses for power density from the first to the tenth finisher and from the first to the last finisher (Model 1) with correction for multiple finishes (Model 2) and age of the athletes with multiple finishes (Model 3)(Continued)
3 −10.069 0.881 −0.770 −1.214 0.260
25 km women
1 0.860 0.428 0.537 20.013 0.072
2 0.860 0.428 0.537 20.013 0.072
3 0.861 0.453 0.537 1.901 0.090
25 km men
1 0.243 0.544 0.140 0.447 0.664
2 0.243 0.544 0.140 0.447 0.664
In ultra-marathon running, Rüst et al. [54] mentioned the possibility that older runners rather compete in ultra-marathons due to a deficit in physiological factors such as VO2max compared to young athletes in their best age. It
could be argued that the world’s elite swimmers at the age of ~20 years rather compete in short- and middle distance than in long-distance events. They may change to the ultra-distances after their career in the short ultra-distances.
A
B
C
D
E
F
Physiological and anthropometric differences might explain the differences in the age of peak performance between short- to middle-distance and long-distance swimming. Peak swimming speed in sprint swimming
was highly associated to strength, power [55] and anaerobic capacity [56]. In longer race distances such as the 1,500 m freestyle, peak swimming speed was rather associated with VO2max [56], anaerobic threshold [57] and anthropometric characteristics such as body fat [58-60].
Strength, limitations and implications for future research The study is the first to analyse the sex difference of performance in professional open-water long-distance swimmers competing in the FINA World Cup races in 5 km, 10 km and 25 km. The strength of the study is that the statistical analysis excluded the influence of multiple finishes of the same athlete and bypassed a therefore a possible bias of results. Furthermore, both linear and non-linear analyses were performed to find the best model for each point of interest. The study is limited since variables such as physiological parameters [61], anthropometric characteristics [62], training data [62], previous experience [63], nutrition [64,65] and motivational [66] factors were not considered but may have influ-enced the results. Further studies need to investigate why swimming speeds in elite long-distance swimming plateaued from 2000–2012 and why the sex difference of performance in long-distance swimming was smaller than expected. Moreover, a systemic analysis of the sex difference of swimming speed across distances from 50 m to 25 km and more would give further insights in the sex difference for different race distances. Future studies might investigate from which country the fastest swimmers in 5 km, 10 km and 25 km originate.
Practical applications
For athletes and coaches, women showed no changes in swimming speed in the 5 km FINA races, increased swimming speed in the 10 km FINA races but de-creased swimming speed in the 25 km FINA races. The fastest swimming speeds were attained at the age of ~22-28 years considering all distances from 5 km to 25 km. Elite women intending to improve in 25 km and to lower the gender gap in 25 km would most probably need to increase skeletal muscle mass and muscular strength to follow the fastest men.
Conclusions
To summarize, elite female swimmers showed a linear improvement in swimming speed in 10 km but a linear impairment in swimming speed in 25 km leading to a linear decrease in sex difference in 10 km and a linear increase in sex difference in 25 km. The linear changes in sex difference in swimming speed suggest that women will improve in the near future in 10 km, but not in 25 km. It is very likely that the gender gap to men will be further reduced in 10 km but it is very unlikely that the gender gap will be reduced in 25 km.
Table 8 Multi-level regression analyses for change of the age of the annual fastest and the annual ten fastest swimmers (Model 1) with correction for multiple finishes (Model 2)
Model ß SE (ß) Stand.ß T p
Annual fastest swimmers
5 km women
1 −0.833 0.289 −0.674 −2.884 0.016
2 −0.833 0.289 −0.674 −2.884 0.016
5 km men
1 0.346 0.288 0.356 1.205 0.256
2 0.346 0.288 0.356 1.205 0.256
10 km women
1 −1.036 0.313 −0.741 −3.315 0.009
2 −1.036 0.313 −0.741 −3.315 0.009
10 km men
1 1.227 0.240 0.862 5.113 0.001
2 1.227 0.240 0.862 5.113 0.001
25 km women
1 −0.424 0.312 −0.396 −1.362 0.203
2 −0.424 0.312 −0.396 −1.362 0.203
25 km men
1 0.577 0.268 0.563 2.153 0.057
2 0.577 0.268 0.563 2.153 0.057
Annual ten fastest swimmers
5 km women
1 −0.194 0.102 −0.172 −1.901 0.060
2 −0.194 0.102 −0.172 −1.901 0.060
5 km men
1 0.054 0.098 0.051 0.552 0.582
2 0.054 0.098 0.051 0.552 0.582
10 km women
1 −0.032 0.129 −0.024 −0.247 0.805
2 −0.032 0.129 −0.024 −0.247 0.805
10 km men
1 0.365 0.109 0.306 3.344 0.001
2 0.365 0.109 0.306 3.344 0.001
25 km women
1 0.097 0.106 0.084 0.913 0.363
2 0.097 0.106 0.084 0.913 0.363
25 km men
1 0.122 0.103 0.109 1.188 0.237
Competing interests
The authors report no conflicts of interest.
Authors’contributions
MZ drafted the manuscript, CR performed the statistical analyses, TR and RL participated in the design of the study and helped drafting the manuscript, BK collected the data, helped in interpretation of the results and drafting the manuscript. All authors read and approved the final manuscript.
Author details 1
Institute of General Practice and for Health Services Research, University of Zurich, Zurich, Switzerland.2INSERM U1093, Faculty of Sport Sciences, University of Burgundy, Dijon, France.3Gesundheitszentrum St. Gallen, Vadianstrasse 26, 9001 St. Gallen, Switzerland.
Received: 23 December 2013 Accepted: 18 February 2014 Published: 22 February 2014
References
1. Hoffman MD:Performance trends in 161-km ultramarathons.Int J Sports Med2010,31:31–37.
2. Zingg M, Knechtle B, Rüst CA, Rosemann T, Lepers R:Age and gender difference in non-drafting ultra-endurance cycling performance - the 'Swiss cycling marathon'.Extrem Physiol Med2013,2:18.
3. Meili D, Knechtle B, Rüst CA, Rosemann T, Lepers R:Participation and performance trends in 'Ultraman Hawaii' from 1983 to 2012. Extrem Physiol Med2013,2:25.
4. Rüst CA, Knechtle B, Knechtle P, Rosemann T, Lepers R:Participation and performance trends in Triple Iron ultra-triathlon - a cross-sectional and longitudinal data analysis.Asian J Sports Med2012,3:145–152. 5. Eichenberger E, Knechtle B, Knechtle P, Rüst CA, Rosemann T, Lepers R:
Best performances by men and women open-water swimmers during the 'English Channel Swim' from 1900 to 2010.J Sports Sci2012,30:1295–1301. 6. Eichenberger E, Knechtle B, Rüst CA, Knechtle P, Lepers R, Rosemann T:
No gender difference in peak performance in ultra-endurance swimming performance - analysis of the 'Zurich 12-h Swim' from 1996 to 2010. Chin J Physiol2012,55:346–351.
7. Eichenberger E, Knechtle B, Knechtle P, Rüst CA, Rosemann T, Lepers R, Senn O:Sex difference in open-water ultra-swim performance in the longest freshwater lake swim in Europe.J Strength Cond Res2013,27:1362–1369. 8. Fischer G, Knechtle B, Rüst CA, Rosemann T:Male swimmers cross the
English Channel faster than female swimmers.Scand J Med Sci Sports 2013,23:48–55.
9. Vogt P, Rüst CA, Rosemann T, Lepers R, Knechtle B:Analysis of 10 km swimming performance of elite male and female open-water swimmers. Springerplus2013,2:603.
10. Zingg MA, Knechtle B, Rüst CA, Rosemann T, Lepers R:Reduced performance difference between sexes in master mountain and city marathon running.Int J Gen Med2013,6:267–275.
11. Rüst CA, Knechtle B, Knechtle P, Rosemann T, Lepers R:Sex differences in ultra-triathlon performance at increasing race distance.Percept Mot Skills 2013,116:690–706.
12. Zingg MA, Rüst CA, Rosemann T, Lepers R, Knechtle B:Analysis of swimming performance in FINA World Cup long-distance open water races.Extrem Physiol Med2014,3:2.
13. Hugh J:The Expert's Guide to Marathon Training.InCarlton Books.Red Lion, PA, U.S.A: Winter Ventures; 2004.
14. The English Channel Association.website http://www.channelswimming association.com/.
15. Fédération Internationale de Natation.website http://www.fina.org/. 16. Olympic Games.website http://www.olympic.org/.
17. Wainer H, Njue C, Palmer S:Assessing time trends in sex differences in swimming and running.Chance2000,13:10–15.
18. Trewin CB, Hopkins WG, Pyne DB:Relationship between world-ranking and Olympic performance of swimmers.J Sports Sci2004,22:339–345. 19. Thibault V, Guillaume M, Berthelot G, Helou NE, Schaal K, Quinquis L, Nassif
H, Tafflet M, Escolano S, Hermine O, Toussaint JF:Women and men in sport performance: the gender gap has not evolved since 1983.J Sports Sci Med2010,9:214–223.
20. Tanaka H, Seals DR:Age and gender interactions in physiological functional capacity: insight from swimming performance.J Appl Physiol 1997,82:846–851.
21. Rüst CA, Knechtle B, Rosemann T, Lepers R:The changes in age of peak swim speed for elite male and female Swiss freestyle swimmers between 1994 and 2012.J Sports Sci2013b. Epub ahead of print. 22. Knechtle B, Knechtle P, Lepers R:Participation and performance trends in
ultra-triathlons from 1985 to 2009.Scand J Med Sci Sports2011,21:82–90. 23. Diana Wyad.website http://www.diananyad.com/.
24. Christopf Wandratsch.website http://www.wandratsch.de/. 25. The Zürich Lake Swim.website http://www.ch.srichinmoyraces.org/. 26. Swiss Academy of Medical Sciences.website http://www.samw.ch/en/Ethics/
Guidelines/Currently-valid-guidelines.html/.
27. Reinboud W:Linear models can't keep up with sport gender gap.Nature 2004,432:147.
28. Nevill AM, Whyte GP, Holder RL, Peyrebrune M:Are there limits to swimming world records?Int J Sports Med2007,28:1012–1017. 29. Bassett DR Jr, Howley ET:Limiting factors for maximum oxygen uptake
and determinants of endurance performance.Med Sci Sports Exerc2000, 32:70–84.
30. Saltin B, Astrand PO:Maximal oxygen uptake in athletes.J Appl Physiol 1967,23:353–358.
31. Ridout SJ, Parker BA, Smithmyer SL, Gonzales JU, Beck KC, Proctor DN: Age and sex influence the balance between maximal cardiac output and peripheral vascular reserve.J Appl Physiol2010,108:483–489.
32. Steding K, Engblom H, Buhre T, Carlsson M, Mosén H, Wohlfart B, Arheden HJ:Relation between cardiac dimensions and peak oxygen uptake. Cardiovasc Magn Reson2010,12:8.
33. Fomin Å, Ahlstrand M, Schill HG, Lund LH, Ståhlberg M, Manouras A, Gabrielsen A:Sex differences in response to maximal exercise stress test in trained adolescents.BMC Pediatr2012,12:127.
34. Guenette JA, Witt JD, McKenzie DC, Road JD, Sheel AW:Respiratory mechanics during exercise in endurance-trained men and women. J Physiol2007,581:1309–1322.
35. Whipp BJ, Ward SA:Will women soon outrun men?Nature1992,355(6355):25. 36. Hoffman MD, Wegelin JA:The Western States 100-Mile Endurance Run:
participation and performance trends.Med Sci Sports Exerc2009, 41:2191–2198.
37. Abou Shoak M, Knechtle B, Knechtle P, Rüst CA, Rosemann T, Lepers R: Participation and performance trends in ultracycling.Open Access J Sports Med2013,4:41–51.
38. Rüst CA, Knechtle B, Rosemann T, Lepers R:Sex difference in race performance and age of peak performance in the Ironman Triathlon World Championship from 1983 to 2012.Extrem Physiol Med2012,1:15. 39. Tatem AJ, Guerra CA, Atkinson PM, Hay SI:Athletics: momentous sprint at
the 2156 Olympics?Nature2004,431:525.
40. Bam J, Noakes TD, Juritz J, Dennis SC:Could women outrun men in ultramarathon races?Med Sci Sports Exerc1997,29:244–247.
41. Stevenson JL, Song H, Cooper JA:Age and sex differences pertaining to modes of locomotion in triathlon.J Med Sci Sports Exerc2013,45:976–984. 42. Tipton M, Eglin C, Gennser M, Golden F:Immersion deaths and
deterioration in swimming performance in cold water.Lancet1999, 354:626–629.
43. Lounsbury DS, Ducharme MB:Arm insulation and swimming in cold water.Eur J Appl Physiol2008,104:159–174.
44. Parouty J, Al Haddad H, Quod M, Leprêtre PM, Ahmaidi S, Buchheit M: Effect of cold water immersion on 100-m sprint performance in well-trained swimmers.Eur J Appl Physiol2010,109:483–490.
45. Rüst CA, Knechtle B, Rosemann T:Changes in body core and body surface temperatures during prolonged swimming in water of 10°C-a case report.Extrem Physiol Med2012,1:8.
46. Knechtle B, Christinger N, Kohler G, Knechtle P, Rosemann T:Swimming in ice cold water.Ir J Med Sci2009,178:507–511.
47. Knechtle B, Wirth A, Baumann B, Knechtle P, Rosemann T:Personal best time, percent body fat, and training are differently associated with race time for male and female ironman triathletes.Res Q Exerc Sport2010, 81:62–68.
49. Knechtle B, Senn O, Imoberdorf R, Joleska I, Wirth A, Knechtle P, Rosemann T:No fluid overload in male ultra-runners during a 100 km ultra-run.Res Sports Med2011,19:14–27.
50. Knechtle B, Senn O, Imoberdorf R, Joleska I, Wirth A, Knechtle P, Rosemann T:Maintained total body water content and serum sodium
concentrations despite body mass loss in female ultra-runners drinking ad libitum during a 100 km race.Asia Pac J Clin Nutr2010,19:83–90. 51. Weitkunat T, Knechtle B, Knechtle P, Rüst CA, Rosemann T:Body composition
and hydration status changes in male and female open-water swimmers during an ultra-endurance event.J Sports Sci2012,30:1003–1013. 52. Berthelot G, Len S, Hellard P, Tafflet M, Guillaume M, Vollmer JC, Gager B,
Quinquis L, Marc A, Toussaint JF:Exponential growth combined with exponential decline explains lifetime performance evolution in individual and human species.Age (Dordr)2012,34:1001–1009. 53. Gallmann D, Knechtle B, Rüst CA, Rosemann T, Lepers R:Elite triathletes in
'Ironman Hawaii' get older but faster.Age (Dordr)2014,36:407–416. 54. Rüst CA, Rüst CA, Knechtle B, Rosemann T, Lepers R:Analysis of performance
and age of the fastest 100-mile ultra-marathoners worldwide.Clinics (Sao Paulo)2013,68:605–611.
55. West DJ, Owen NJ, Cunningham DJ, Cook CJ, Kilduff LP:Strength and power predictors of swimming starts in international sprint swimmers.J Strength Cond Res2011,25:950–955.
56. Unnithan V, Holohan J, Fernhall B, Wylegala J, Rowland T, Pendergast DR: Aerobic cost in elite female adolescent swimmers.Int J Sports Med2009, 30:194–199.
57. VanHeest JL, Mahoney CE, Herr L:Characteristics of elite open-water swimmers.J Strength Cond Res2004,18:302–305.
58. Siders WA, Lukaski HC, Bolonchuk WW:Relationships among swimming performance, body composition and somatotype in competitive collegiate swimmers.J Sports Med Phys Fitness1993,33:166–171. 59. Tuuri G, Loftin M, Oescher J:Association of swim distance and age with
body composition in adult female swimmers.Med Sci Sports Exerc2002, 34:2110–2114.
60. Zuniga JM, Berg K, Noble J, Harder J, Chaffin ME, Hanumanthu VS: Physiological responses during interval training with different intensities and duration of exercise.J Strength Cond Res2011,25:1279–1284. 61. Reis JF, Alves FB, Bruno PM, Vleck V, Millet GP:Oxygen uptake kinetics and
middle distance swimming performance.J Sci Med Sport2012,15:58–63. 62. Knechtle B, Baumann B, Knechtle P, Rosemann T:Speed during training
and anthropometric measures in relation to race performance by male and female open-water ultra-endurance swimmers.Percept Mot Skills 2010,111:463–474.
63. Rüst CA, Knechtle B, Knechtle P, Rosemann T, Lepers R:Personal best times in an Olympic distance triathlon and in a marathon predict Ironman race time in recreational male triathletes.Open Access J Sports Med2011, 2:121–129.
64. Rodriguez NR, Di Marco NM, Langley S:American college of sports medicine position stand. Nutrition and athletic performance.Med Sci Sports Exerc2009,41:709–731.
65. Maughan RJ, Shirreffs SM:Nutrition for sports performance: Issues and opportunities.Proc Nutr Soc2011,17:1–8.
66. Simões P, Vasconcelos-Raposo J, Silva A, Fernandes HM:Effects of a process-oriented goal setting model on swimmer's performance.J Hum Kinet2012,32:65–76.
doi:10.1186/2052-1847-6-7
Cite this article as:Zingget al.:Analysis of sex differences in open-water ultra-distance swimming performances in the FINA World Cup races in 5 km, 10 km and 25 km from 2000 to 2012.BMC Sports Science, Medicine, and Rehabilitation20146:7.
Submit your next manuscript to BioMed Central and take full advantage of:
• Convenient online submission
• Thorough peer review
• No space constraints or color figure charges
• Immediate publication on acceptance
• Inclusion in PubMed, CAS, Scopus and Google Scholar
• Research which is freely available for redistribution