*For correspondence.
© 2002 Caister Academic Press
Analysis of Specific Bacteria from
Environmental Samples using a Quantitative
Polymerase Chain Reaction
Clifford F. Brunk*1,2, Jinliang Li2 and Erik Avaniss-Aghajani2
1Biology Department, University of California,
621 Charles E. Young Dr. So, Los Angeles, CA 90095-1606, USA
2Laragen Inc., 10755 Venice Ave., Los Angeles, CA
90034, USA
Abstract
This article describes the use of quantitative PCR for measuring bacterial abundance in environmental samples. The two approaches discussed are: 1) The use of an internal PCR standard constructed to be the same size and have the same sequence as the primary amplification target, but differing from the primary target by 2-3 bases, corresponding to a unique restriction site. This allows the amount of target amplicon to be compared with the internal standard and circumvents the problem of differential amplification efficiencies when using dissimilar targets and standard amplicons. 2) The use of Taqman technology (Applied Biosystems, Foster City, California) with a dual labeled oligonucleotide probe which binds internal to the PCR primers. The detection of Bacteroides is used as an example for both approaches.
Introduction
In the past decade molecular techniques have provided a means for detecting the presence of virtually any type of bacteria in environmental samples, independent of the ability to culture them in the laboratory (1-6). Bacterial DNA can be isolated from the sample and the small subunit ribosomal RNA (SSU rRNA) genes can be amplified using the polymerase chain reaction (PCR). The sequences of the SSU rRNA genes uniquely identify the bacteria in the sample (4, 5). PCR typically results in a 105 to 106-fold
amplification of target DNA for 20 to 30 cycles, thus the sensitivity of this approach is very high. The choice of PCR primers allows a wide spectrum of specificity (7). If general primers are used, almost all SSU rRNA sequences can be amplified. If unique PCR primers are chosen, only a single species or small group of bacterial SSU rRNA sequences in the sample will be amplified.
The high sensitivity of PCR is a mixed blessing; it is valuable for detecting low numbers of bacteria, but makes the determination of the abundance of different bacterial types difficult. Although PCR is very sensitive and is theoretically capable of detecting a single target molecule in a sample, amplification usually saturates during the later cyclesand the amount of a specific sequence in the final amplification product is not always proportional to the amount of that sequence in the original sample. Also on occasions different sequences will be amplified to different extents, in which case their abundance in the final PCR product does not reflect their abundance in the original sample (8). Thus, quantitative PCR (QPCR) techniques are required to determine the abundance of specific SSU rDNA sequences in environmental samples.
Quantitative PCR
sequence in the original sample can be readily calculated. Using this type of QPCR analysis the abundance of the target SSU rRNA sequence in the original environmental sample can be readily quantitated.
By knowing the number of SSU rRNA genes in the target species and the average genome size of the bacteria in the sample, the abundance of target bacteria can be calculated. Recently, we completed a survey of SSU rRNA gene copy number and genome size for virtually all of the prokaryotes in the available literature (9). The average genome size of the bacteria in the sample allows the abundance of genomic DNA in the sample to be converted into the number of bacteria present in the sample. The SSU rRNA gene copy number of the target bacteria can be used to convert the abundance of SSU rRNA sequences into abundance of target bacteria in the sample. Thus, QPCR analysis can be used to provide an accurate measure of the abundance of a target bacterium in an environmental sample.
Recently, a real-time analytical technique for QPCR analysis, Taqman (Applied Biosystems, Foster City, California), has become available which provides remarkably rapid and accurate determination of target sequences in a sample (10-12). A PCR machine such as the ABI 7700 Sequence Detector that is capable of recording the fluorescence activity of individual PCR tubes during the PCR amplification is employed. In essence, Taqman analysis measures the increase in PCR product for each cycle of the PCR amplification. During the early cycles the amount of PCR product is below the detection limit of the machine, but by cycle number 12 to 15, the PCR product can usually be detected. When the PCR product is first detectable, the PCR is still in the linear range and the amount of PCR product is proportional to the amount of target sequence in the original sample. During the late PCR cycles the reaction saturates and amplicons may no longer be proportional to the amount of target sequence in the original sample.
The amount of PCR product produced is monitored by the release of fluorescence from a target specific probe during the PCR process. The probe hybridizes specifically
with the target sequence at a position between the PCR primers. There are two kinds of probe for the Taqman assay. The standard probe contains a fluorescent reporter dye and a non-fluorescent a quencher dye, in close proximity. The minor grove binder (MGB) probe contains a fluoresenct reporter, a non-fluorescent quencher and a minor grove binder, which significantly increases the binding of the probe to the target sequence (12a). The MGB probe is usually shorter (13-18 bp) than the standard probe (15-40 bp) and produces increased sequence specificity. The interaction between the reporter dye and quencher prevents the fluorescence of the reporter dye. The interaction between the two dyes prevents the fluorescence of the reporter dye. During PCR amplification the exonuclease activity of the polymerase degrades the probe and separates the reporter dye and the quencher dye, which allows fluorescence of the reporter dye. A standard curve is produced with known amounts of target DNA in separate reactions.
Although this QPCR analysis requires sophisticated and expensive instrumentation, it is a very rapid and accurate means of determining the amount of target DNA in a sample. This approach requires no post PCR analysis. The ABI 7700 Sequence Detector performs 96 parallel wells of Taqman analyses. Generally, 12 wells are used for controls and standards leaving 84 wells for sample analysis. The machine determines a standard curve and calculates the amount of target DNA in each of the sample wells. Thus the output is a direct measure of the abundance of target sequence in the sample. Extensive documentation on the principles, techniques, and applications of Taqman assays is provided on the Applied Biosystems website (www.appliedbiosystems.com/molecularbiology/about/ pcr/ sds/).
We have found that environmental samples often contain inhibitors of PCR amplification and it is difficult to ensure that all samples are free of PCR inhibitors. The Taqman analysis is vulnerable to such inhibitors because these inhibitors may vary from sample to sample and are not present in the reactions used to determine the standard curve. The ABI 7700 Sequence Detector is capable of Protocol 1. DNA extraction from environmental samples
Protocol 1. DNA extraction from environmental samples Protocol 1. DNA extraction from environmental samples Protocol 1. DNA extraction from environmental samples Protocol 1. DNA extraction from environmental samples
1. Resuspend cells in approximately 1 ml of NET buffer (0.5 M NaCl, 0.05 M EDTA, 0.05 M Tris, pH 8.5). NET buffer effectively prevents degradation of the DNA by nucleases and has been used in this role in our laboratory and many others with a wide variety of organisms for a number of years.
2. Add 0.5 g of 3MM “super bright” glass beads.
3. Incubate alternately in a dry ice/ethanol bath and a 65oC water bath 5 times with 1 min of vigorous vortex mixing following incubation at 65oC.
4. Add lysozyme (5µg/ml) and proteinase K (5µg/ml) and incubate at 37oC for 30 min. 5. Add SDS (sodium dodecyl sulfate) to a final concentration of 1%.
6. Proteins and lipids are removed by phenol/chloroform/isoamyl alcohol (25:25:1) ex-traction.
7. Precipitate nucleic acids with one volume of isopropanol and recover the DNA by cen-trifugation (10,000×g for 30 min).
8. Remove RNA by digestion with RNase (DNase-free) and re-extract with chloroform/ isoamyl alcohol (25:1).
monitoring several fluorescent probes simultaneously. This allows the amplification of a second DNA target in each well as an internal normalization standard to monitor the efficiency of PCR amplification in each individual wells. A target DNA sequence that is not present in the environmental samples is the internal normalization standard. We use a synthetic histone H4-like sequence as such an internal normalization standard. A primer/probe set specific to this internal normalization standard is included in each Taqman assay. The amplification of the internal normalization standard is monitored independently of the assay for the target sequence and the fluorescent signal from the target probe is normalized to the signal from the internal normalization standard, compensating for any PCR inhibitors in the individual samples.
Isolation of Total DNA from Environmental Samples
Each QPCR assay requires about 10 to 50 ng of genomic DNA, thus 1 µg of genomic DNA from the sample is adequate for repeated analysis. Assuming an average bacterial genome size of 2 x 10⁶ bp, about 5 x 10⁸ bacteria
will yield 1 µg of genomic DNA. The size of the sample required to yield 5 x 10⁸ bacteria varies depending on the
source. Less than 100 ml of sewage treatment effluent is required, while 10 liters or more of marine or fresh water sample is usually required. The bacterial content of an environmental sample can be readily estimated by staining the cells with DAPI (0.4 µg/ml in phosphate buffered saline for 1 – 5 min) and measuring the bacterial cell density by fluorescence microscopy.
Aquatic samples are pre-filtered through lens paper to remove any macro debris (no bacteria are lost in this process). The bacteria are then collected by filtration using a Millipore 25 PA (5 µm pore size, 49 mm diam.) pre-filter followed by a GS (0.22 µm pore size, 249 mm diam.) filter. The pre-filter is necessary to prevent clogging of the main
filter. The sample is passed though the filter from a simple pressure container with a pressure of slightly over one atmosphere. Bacteria are eluted from both the pre-filter and the main filter. Care in removing the bacteria from the main filter is required as many bacteria are found in the retained liquid immediately above the filter. Alternatively, the cells can be harvested by centrifugation, which works well for small samples such as sewage treatment effluent, but is awkward for larger samples.
Most bacteria in environmental samples are relatively easy to lyse and are generally susceptible to lysozyme, however a rigorous lysis procedure is used to ensure maximum lysis (13, 14). It is important to achieve as complete a lysis of the cells in the sample as possible in order to get an accurate representation of all of DNA in the sample. Therefore, we have added disruption of the cells with glass beads to further ensure complete lysis (Protocol 1).
Construction of a QPCR Internal Standard
In order to construct an internal standard for QPCR analysis, the SSU rRNA sequences for the target bacteria and a general knowledge of the SSU rRNA sequences of the other bacteria in the sample is required. This can be obtained by producing a library of SSU rRNA sequences from the sample or this information can often be obtained from the Ribosomal Database Project (RDP; 15, www.cme.msu.edu/RDP/html/index.html).
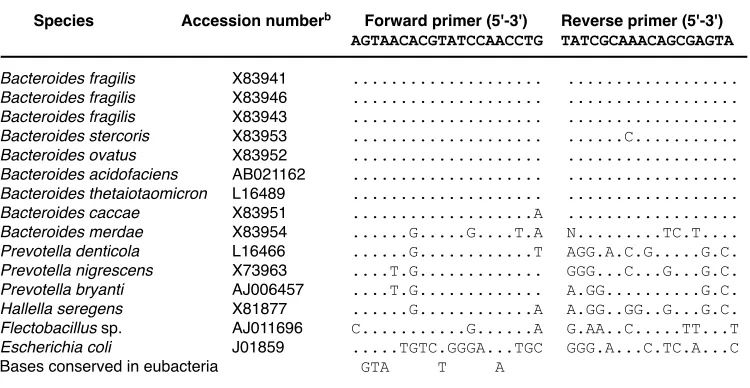
As an example, the construction of a QPCR internal standard for Bacteroides is outlined. SSU rRNA sequences for several Bacteroides species were obtained from the sequence database and a consensus sequence was formed. Two PCR primers were chosen that amplify human-specific Bacteroides spp. DNA and yield a PCR product that is 725 base pairs (bp) in length (Table 1). Within this PCR product there is a unique BspEI restriction site, which Table 1. Alignment of primers used for internal standard QPCR with Bacteroides spp. and related organismsa
Species Accession numberb Forward primer (5'-3') Reverse primer (5'-3')
AGTAACACGTATCCAACCTG TATCGCAAACAGCGAGTA
Bacteroides fragilis X83941 ... ...
Bacteroides fragilis X83946 ... ...
Bacteroides fragilis X83943 ... ...
Bacteroides stercoris X83953 ... ...C...
Bacteroides ovatus X83952 ... ...
Bacteroides acidofaciens AB021162 ... ...
Bacteroides thetaiotaomicron L16489 ... ...
Bacteroides caccae X83951 ...A ...
Bacteroides merdae X83954 ...G...G....T.A N...TC.T....
Prevotella denticola L16466 ...G...T AGG.A.C.G...G.C.
Prevotella nigrescens X73963 ....T.G... GGG...C...G...G.C.
Prevotella bryanti AJ006457 ....T.G... A.GG...G.C.
Hallella seregens X81877 ...G...A A.GG..GG..G...G.C.
Flectobacillus sp. AJ011696 C...G...A G.AA..C...TT...T
Escherichia coli J01859 ...TGTC.GGGA...TGC GGG.A...C.TC.A...C
Bases conserved in eubacteria GTA T A a Matching nucleotides are indicated with a dot (.).
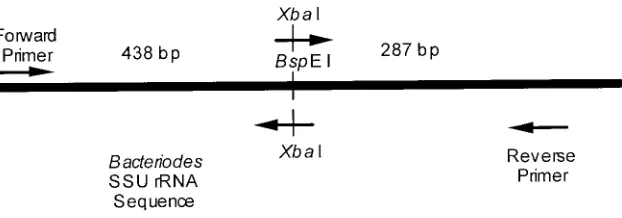
when cleaved gives two fragments, one 438 bp in length and the other 287 bp. The appropriateness of these primers and unique restriction site was confirmed by PCR amplifying several samples and cleaving the product with BspEI. All PCRs yielded a 725 bp product that was cleaved by BspE I into two fragments, 438 bp and 287 bp respectively. In constructing the internal standard this BspEI site will be converted to a different restriction site. Virtually any enzyme recognition sequence can be used as the new restriction site, however it must not occur in the fragment amplified by the specific primers. In this example XbaI was chosen as the new restriction site. The PCR products from several samples were digested with XbaI and no cleavage occurred indicating that there were no XbaI sites within this region.
The internal standard is constructed from a cloned Bacteroides fragilis SSU rRNA sequences. Forward and reverse primers that span the BspEI site are synthesized. Each primer has a two base pair modification that converts the Bacteroides BspEI site to a XbaI site. Two PCR products are produced using the forward primer and the modified reverse primer or the reverse primer and the modified forward primer (see Figure 1). These PCR products are cleaved with XbaI and ligated together (16). This new molecule is PCR amplified using the forward and reverse primers. The resulting PCR product is the Bacteroides SSU rRNA sequence with the BspEI site replaced by a Xba I site. Finally, this sequence is cloned and used as a QPCR internal standard for Bacteroides.
QPCR Assay Using an Internal Standard
1. A master PCR mixture is prepared according to the manufacturer’s protocol, including Taq polymerase, buffer, MgCl2, dNTPs, species specific forward and
reverse primers for the rDNA region at 300 nM concentration, and 20 pg of internal standard DNA (for each assay). This master mixture is prepared in roughly half the final volume (which is usually 50 µl). 2. The master mixture is divided into equal aliquots and
10 ng of sample DNA is added to each aliquot. Distilled water is added to each aliquot to bring each PCR to its final volume (which is usually 50 µl).
3. A standard PCR amplification is performed with a thermocycler (e.g. PE2400, Perkin-Elmer, Norwalk, Connecticut) on each sample:
90 sec at 96oC
10 cycles of 30 sec at 96oC, 30 sec at 60oC, 60 sec
at 72oC
25 cycles of 20 sec at 94oC, 30 sec at 60oC, 60 sec
(increased by 2 sec each cycle) at 72oC
10 min at 72oC,
4. A 5 µl aliquot of each the PCR products is digested with the restriction enzyme specific to the native rDNA sequence and a second 5 µl aliquot is digested with the restriction enzyme specific to the internal standard (according to the directions of the manufacturer of the restriction enzyme).
5. These digests are analyzed on a 3% agarose gel with electrophoresis voltage of 8 V/cm for 60 min using TBE buffer (16). The gel is stained with ethidium bromide (0.5 µg/ml) and the gel image is electronically documented. The amount of DNA in each band is determined with NIH Image 1.62b7 software. 6. The ratio of the amount of DNA in the full-length (uncut)
band to the total amount of DNA in two cleaved bands is calculated for the two images. If the ratio is less than 1/10 or greater than 10, the assay is repeated with the amount of sample DNA adjusted to yield a ratio in this range.
7. The rDNA target usually makes up about 1/4 of the internal standard DNA, thus there is about 5 pg of internal standard in each PCR. The exact portion of rDNA target in the internal standard DNA depends on the distance between the specific forward and reverse primers and the total size of the cloned internal standard DNA (vector plus insert).
8. The amount of target DNA in the sample is estimated as 5 pg multiplied by the ratio (full length to cleaved bands) for the PCR products digested with the restriction enzyme specific for the internal standard DNA. Similarly, the amount of target DNA in the sample is estimated as 5 pg divided by the ratio (full length to cleaved bands) for the PCR products digested with the restriction enzyme specific for the specific DNA in the sample. Dividing these two estimates by the amount of sample DNA (10 ng) added to the amplification reaction yields the amount of specific rDNA/ng in the sample.
the sample knowing the proportion of the bacterial genome that is rDNA (this proportion is usually close to 1/1000).
Different internal standard rDNA sequences will need to be constructed for estimating the amount of different bacteria in samples. For Bacteriodes we constructed the internal standard as described above, using the primers given in Table 1.
Construction of a QPCR Taqman Primer/Probe Set
The Taqman probe and primers are selected to hybridize to a region unique to the target DNA with the probe having a Tm that is 10oC higher than the primers, with the
assistance of the Primer Express program (Applied Biosystems, Foster City, California). As an example, the construction of a QPCR Taqman probe and primers for Bacteroides is outlined.
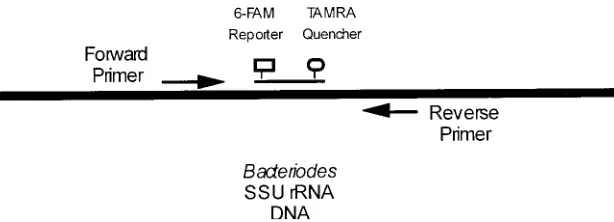
The probe sequence specific for Bacteroides is 29 bp in length and has a Tm of 70oC. The probe is labeled with
6-carboxyfluorescein (6-FAM) as the reporter dye at the 5' end and carboxytetramethylrhodamine (TAMRA) as the quencher dye at the 3' end. The set of primers are designed to flank the probe. The forward primer is 25 bp in length and has a Tm of 60oC, while the reverse primer is 23 bp in
length and has a Tm of 59oC. The primer/probe set spans
94 bp, as shown in Figure 2. The following probe/primer combination is used for Taqman QPCR analysis of Bacteriodes DNA:
Forward primer: 5'-TGGTAGTCCACACAGTAAACGATGA-3' Reverse primer: 5'-CGTACTCCCCAGGTGGAATACTT-3'
Probe (6-FAM labeled): 5'-GTTTGCGATATACAGTAAGCGGCCAAGCG-3' Each Taqman assay has a normalization standard included to correct for any inhibitors introduced with the sample DNA. A synthetic sequence 213 bp in length, cloned into pUC19 plasmid vector and coding for a histone-like H4 protein, is used as a normalization standard for Taqman QPCR. Any sequence that is not found in the sample under investigation can be used as a normalization standard. A primer/probe set for this sequence is constructed in the manner described above, with the alternative fluorochrome VIC as the reporter dye. Primers for this normalization standard do not amplify sequences from any of the environmental
sample tested. When test samples composed of mixtures of the internal standard and Bacteriodes DNA are amplified in a Taqman QPCR assay with both the target primer/probe set and the normalization primer/probe set, the results are consistent with the composition of the samples tested.
QPCR Analysis Using the Taqman Assay
1. Each reaction contains 25 ng of sample DNA, 20 pg of the normalization standard, 12.5 µl Taqman Universal PCR Master Mix (Applied Biosystems), 300 nM of each set of forward and reverse primers, and 100 nM of each probe. After the addition of target DNA, distilled water is added to a final volume of 25 µl. All reactions are performed in triplicate to assure the accuracy of the assay.
2. Four reactions are performed to produce a standard curve. These reactions contain 1, 10, 100 or 1000 pg of cloned Bacteroides fragilis SSU rDNA sequence and 1, 10, 100 or 1000 pg of cloned normalization standard DNA, respectively. Two ‘no template’ control amplifications (5 µl of ddH2O) are used for each
Taqman run.
3. The PCR amplification is performed under standard Taqman conditions: 50oC for 2 min, 95oC for 10 min,
then 40 cycles of 94oC for 20 sec and 60oC for 1 min.
Amplification is performed in MicroAmp Optical tubes (Applied Biosystems).
4. Following PCR amplification, the standard Taqman software is used to calculate the amount of Bacteriodes rDNA and the amount of normalization standard DNA present in sample. The software does this on the basis of the standard curves using the Cto (the number of cycles required for the PCR product to reach a detectable amount). The amount of normalization DNA in each reaction is 20 pg, thus the amount of Bacteriodes rDNA in each sample is corrected based on the amount of normalization DNA detected in the sample. If the corrected amount of Bacteriodes DNA in the sample is less than 2 pg or more than 200 pg the assay is repeated with the sample DNA adjusted to this range.
number of specific bacteria in the sample knowing the proportion of the Bacteriodes genome that codes for rRNA (this proportion is close to 1/1000).
Concluding Remarks
This article describes two QPCR assays. The internal standard QPCR produces accurate estimates of the amount of specific DNA sequences in the sample. It does not require sophisticated equipment but it does, however, require substantial post-amplification analysis, including restriction digestion and electrophoresis gel analysis, in addition to an internal standard unique to each bacterial sequence measured. For all Taqman QPCR assays a single normalization standard can be used. However, the Taqman QPCR analysis requires PCR equipment capable of real-time analysis. Both of the assays involve the construction of internal standardization sequences and the Taqman QPCR assay utilizes two fluorescent probes/ primer sets. Each Taqman analysis is significantly more expensive than an internal standard assay, but the Taqman assays are more amenable to automation. Each assay has its unique strengths and one or the other is capable of providing accurate estimates of the amount of specific DNA sequences in complex environmental samples.
Acknowledgements
We wish to thank Warren Chuang and Christopher Collins for assistance with this manuscript. This paper was funded in part by a grant from the National Sea Grant College Program, National Oceanic and Atmospheric Administration, U.S. Department of Commerce, under grant number NA66RG0477, project number R/CZ-153 through the California Sea Grant College System. The views expressed herein are those of the authors and do not necessarily reflect the views of NOAA or any of its sub-agencies. The U.S. Government is authorized to reproduce and distribute for governmental purposes.
References
1. Amann, R. I., Ludwig, W., and Schleifer, K.-H. 1995. Phylogenetic identification and in situ detection of individual microbial cells without cultivation. Microbiol. Reviews. 59: 143-169.
2. Barns, S. M., Fundyga, R. E., Jeffries, M. W. and Pace, N. R. 1994. Remarkable archaeal diversity detected in a Yellowstone National Park hot spring environment. Proc. Natl. Acad. Science. 91: 1609-1613.
3. Barns, S. M., Delwiche, C. F., Palmer, J. D., and Pace, N. R. 1996. Perspectives on archaeal diversity, thermophily and monophyly from environmental rRNA sequences. Proc. Natl. Acad. Science. 93: 9188-9193.
4. Olsen, G. J., Lane, D. J., Giovannoni, S. J., Pace, N. R., and Stahl, D. A. 1986. Microbial ecology and evolution: a ribosomal approach. Ann. Rev. Microbiol. 40: 337-365.
5. Pace, N. R., Stahl, D. A., Lane, D. J., and Olsen, G.
J. 1986. The analysis of natural microbial populations by ribosomal RNA sequences. Adv. Microbiol. Ecol. 9: 1-55.
6. Ward, D. M., Weller, R., and Bateson, M. M. 1990. 16S rRNA sequences reveal numerous uncultured microorganisms in a natural community. Nature. 345: 63-65.
7. Brunk, C. F., Avaniss-Aghajani, E., and Brunk, C. A. 1996. A computer analysis of primer and probe hybridization potential with bacterial small-subunit rRNA sequences. Appl. Environ. Microbiol. 62: 872-879.
8. Brunk, C. F.,and Eis, N. 1998. Quantitative measure of small-subunit rRNA gene sequences of the kingdom Korarchaeota. Appl. Environ. Microbiol. 64: 5064-5066.
9. Fogel, G. B., Collins, C. R., Li, J., and Brunk, C. F. 1999. Prokaryotic genome size and SSU rDNA copy number: Estimation of microbial relative abundance from a mixed population. Microbial Ecology, 38: 93-113.
10. Holland, P. M, Abramson, R. D., Watson, R., and Gelfand, D. H. 1991. Detection of specific polymerase chain reaction product by utilizing the 5'-3' exonuclease activity of Themus aquaticus DNA polymerase. Proc. Natl. Acad. Science. 88: 7276-7280.
11. Livak, K. J., Flood, S. J. A., Marmaro, J. Giusti, W., and Deetz, K. 1995. Oligonucleotides with fluorescent dyes at opposite ends provide a quenched probe system useful for detecting PCR product and nucleic acid hybridization. PCR Methods Appl., 4:357-362. 12. Lee, L. G., Connell, C. R., and Bloch, W. 1993. Kinetic
PCR: Real-time monitoring of DNA amplification reactions. Nucl. Acids Res. 21:3761-3766.
12a. Kutyavin, I. V., Afonina, I. A., Mills, A. M., Gorn, V. V., Lukhtanov, E. A, Belousov, E. S., Singer, M. J., Walburger, D. K. Lokhov, S. G., Gall, A. A., Dempcy, R., Reed, M. W., Meyer, R. B. and Hedgpeth, J. 2000. 3’-Minor groove binder-DNA probes increase sequence specificity at PCR extension temperature. Nuc. Acids Res., 28: 655-661.
13. Tsai, Y.-L., M. J. Park, and B. H. Olson. 1991. Rapid method for direct extraction of mRNA from seeded soils. Appl. Environ. Microbiol. 57: 765-768. 14. Fuhrman, J. A., Comeau, D. E., Hayström, Å., and
Chan, A. M. 1988. Extraction of DNA suitable for molecular biological studies from natural planktonic microorganisms. Appl. Environ. Microbiol. 54: 1426-1429.
15. Maidak, B. L., Cole, J. R., Lilburn, T. G., Parker Jr., C. T., Saxman, P. R., Stredwick, J. M., Garrity, G. M., Li, B., Olsen, G. J., Pramanik, S., Schmidt, T. M., and Tiedje, J. M. 2000. The RDP (Ribosomal Database Project) continues. Nucleic Acids Res. 28:173-174.
• MALDI-TOF Mass Spectrometry in Microbiology
Edited by: M Kostrzewa, S Schubert (2016)
www.caister.com/malditof
• Aspergillus and Penicillium in the Post-genomic Era
Edited by: RP Vries, IB Gelber, MR Andersen (2016)
www.caister.com/aspergillus2
• The Bacteriocins: Current Knowledge and Future Prospects
Edited by: RL Dorit, SM Roy, MA Riley (2016)
www.caister.com/bacteriocins
• Omics in Plant Disease Resistance
Edited by: V Bhadauria (2016)
www.caister.com/opdr
• Acidophiles: Life in Extremely Acidic Environments
Edited by: R Quatrini, DB Johnson (2016)
www.caister.com/acidophiles
• Climate Change and Microbial Ecology: Current Research and Future Trends
Edited by: J Marxsen (2016)
www.caister.com/climate
• Biofilms in Bioremediation: Current Research and Emerging Technologies
Edited by: G Lear (2016)
www.caister.com/biorem
• Microalgae: Current Research and Applications
Edited by: MN Tsaloglou (2016)
www.caister.com/microalgae
• Gas Plasma Sterilization in Microbiology: Theory, Applications, Pitfalls and New Perspectives
Edited by: H Shintani, A Sakudo (2016)
www.caister.com/gasplasma
• Virus Evolution: Current Research and Future Directions
Edited by: SC Weaver, M Denison, M Roossinck, et al. (2016)
www.caister.com/virusevol
• Arboviruses: Molecular Biology, Evolution and Control
Edited by: N Vasilakis, DJ Gubler (2016)
www.caister.com/arbo
• Shigella: Molecular and Cellular Biology
Edited by: WD Picking, WL Picking (2016)
www.caister.com/shigella
• Aquatic Biofilms: Ecology, Water Quality and Wastewater Treatment
Edited by: AM Romaní, H Guasch, MD Balaguer (2016)
www.caister.com/aquaticbiofilms
• Alphaviruses: Current Biology
Edited by: S Mahalingam, L Herrero, B Herring (2016)
www.caister.com/alpha
• Thermophilic Microorganisms
Edited by: F Li (2015)
www.caister.com/thermophile
• Flow Cytometry in Microbiology: Technology and Applications
Edited by: MG Wilkinson (2015)
www.caister.com/flow
• Probiotics and Prebiotics: Current Research and Future Trends
Edited by: K Venema, AP Carmo (2015)
www.caister.com/probiotics
• Epigenetics: Current Research and Emerging Trends
Edited by: BP Chadwick (2015)
www.caister.com/epigenetics2015
• Corynebacterium glutamicum: From Systems Biology to Biotechnological Applications
Edited by: A Burkovski (2015)
www.caister.com/cory2
• Advanced Vaccine Research Methods for the Decade of Vaccines
Edited by: F Bagnoli, R Rappuoli (2015)
www.caister.com/vaccines
• Antifungals: From Genomics to Resistance and the Development of Novel Agents
Edited by: AT Coste, P Vandeputte (2015)
www.caister.com/antifungals
• Bacteria-Plant Interactions: Advanced Research and Future Trends
Edited by: J Murillo, BA Vinatzer, RW Jackson, et al. (2015)
www.caister.com/bacteria-plant
• Aeromonas
Edited by: J Graf (2015)
www.caister.com/aeromonas
• Antibiotics: Current Innovations and Future Trends
Edited by: S Sánchez, AL Demain (2015)
www.caister.com/antibiotics
• Leishmania: Current Biology and Control
Edited by: S Adak, R Datta (2015)
www.caister.com/leish2
• Acanthamoeba: Biology and Pathogenesis (2nd edition)
Author: NA Khan (2015)
www.caister.com/acanthamoeba2
• Microarrays: Current Technology, Innovations and Applications
Edited by: Z He (2014)
www.caister.com/microarrays2
• Metagenomics of the Microbial Nitrogen Cycle: Theory, Methods and Applications
Edited by: D Marco (2014)
www.caister.com/n2
Caister Academic Press is a leading academic publisher of advanced texts in microbiology, molecular biology and medical research. Full details of all our publications at caister.com