Available online on 20.06.2019 at http://jddtonline.info
Journal of Drug Delivery and Therapeutics
Open Access to Pharmaceutical and Medical Research© 2011-18, publisher and licensee JDDT, This is an Open Access article which permits unrestricted non-commercial use, provided the original work is properly cited
Open Access
Research Article
Formulation and Optimization of Omeprazole Floating Tablet by Wet
Granulation Technique
Kaushal Sahil*
1, Dev Dhruv
1, Prasad D.N
2, Sharma Rajni
1 1 Department of Pharmaceutics, Shivalik College of Pharmacy, Nangal, Punjab, India2 Department of Pharmaceutical Chemistry, Shivalik College of Pharmacy, Nangal, Punjab, India
ABSTRACT
Omeprazole is a proton pump inhibitor, antacid drug. It is categorized as class II in BCS system of classification of drugs. Omeprazole inhibits the H(+)-K(-) ATPase in the proton pump of gastric parietal cells and highly effective inhibitor of gastric acid secretion. Floating tablet is nowadays considered as one of the best method to enhance the retention time of tablet in stomach. To get a better dissolution rate, the retention time of Omeprazole is enhanced by the floating technique. The aim of the work is to formulate the floating tablet of Omeprazole and evaluation of tablets invitro performance. The floating tablets are prepared by using two different polymers; HPMC K15, HPMC K100. Wet granulation method was used to prepare tablet. The polymers added in different ratios. The increasing concentration of polymers is responsible for enhancement of drug content and percent yield due to increase in the swallability of polymer.Invitro drug release study was performed using United State Pharmacopoeia (USP) type II dissolution test apparatus employing paddle stirrer at 50 rpm using 900ml of 0.1 N HCL buffer maintained at 37⁰C±0.5⁰C as the dissolution medium. The FTIR, DSC studies of Omeprazole floating tablet indicated the phase inversion of Omeprazole from crystalline to amorphous form. The F3 formulation show increased drug release as compare to pure drug in 24 hrs. It can be concluded that the floating tablet of Omeprazole prepared with mixture of HPMC K15 and HPMC K100 has greater retention time than pure drug and marketed formulation.
Keywords- Omeprazole, Gastroretentive floating tablet, HPMC K15, HPMC K100
Article Info:Received 02 May 2019; Review Completed 06 June 2019; Accepted 10 June 2019; Available online 20 June 2019 Cite this article as:
Kaushal S, Dev D, Prasad DN, Sharma R,Formulation and Optimization of Omeprazole Floating Tablet by Wet Granulation
Technique, Journal of Drug Delivery and Therapeutics. 2019; 9(3-s):679-687 http://dx.doi.org/10.22270/jddt.v9i3-s.2956
*Address for Correspondence:
Kaushal Sahil, Department of Pharmaceutics, Shivalik College of Pharmacy, Nangal, Punjab, India
INTRODUCTION
The main aim of drug therapy is to provide therapeutic amount of drug to desired site in body, and to quickly achieve and maintain desired drug concentration. The most important two aspects of drug delivery are called spatial placement and temporal delivery of drug. Spatial placement is related to targeting a drug to particular organ or tissue while temporal delivery refers to controlled rate of drug
delivery to that specific organ or tissue.(1)
Omeprazole
Omeprazole is in a class of drugs called proton pump inhibitors (PPIs) which block the production of acid by the stomach. Other drugs in the same class include lansoprazole (Prevacid), rabeprazole (Aciphex) and pantoprazole (Protonix). Chemically, Omeprazole is very similar to these drugs. Proton pump inhibitors are used for the treatment of conditions such as stomach and duodenal ulcers,
gastroesophageal reflux disease (GERD) and the Zollinger-Ellison syndrome which all are caused by stomach acid. Omeprazole, like other proton-pump inhibitors, blocks the enzyme in the wall of the stomach that produces acid. By
blocking the enzyme, the production of acid is decreased.2
Granulation
techniques and technologies have improved over the years.3
Optimization
Optimization of a pharmaceutical process using design of experiments is traditional approach that involves changing one variable at a time. Optimization means determining best course of action among various alternatives available in decision making problem. Optimization is defined as the implementation of systemic approaches to achieve best combination of process or product characteristics under a given set of condition. Optimization approaches employing design of experiments have advantages like require fewer experiments to achieve an optimum formulation rectification quite easier, make problem tracing, reveal drug/ polymer interaction and comprehend the process to assist best formulation development and subsequent scale up .Optimization is a decision-making process in which decisions have to be taken which optimize one or more
specified objectives under prescribed set of circumstances.4
EXPERMENTAL WORK
Material:
Omeprazole was obtained as gift sample from Alwell Pharmaceuticals (Chandigarh, India). HPMC K15M and HPMC K100M were obtained as gift sample from USB Pharmaceuticals (Baddi). All other chemicals are provided by the institution.
Preformulation Studies
Preformulation testing is the first step in rational development of both active pharmaceutical
Ingredient (API) and drug product. They influence:
• Drug performance and development of an efficacious,
stable and safe dosage form Drug candidate selection
• Formulation components selection
• The physicochemical parameters of new drug
substance
• Development of analytical method and
• Drug and excipient compatibility.
Drug characterization:
Omeprazole was characterized by various tests of identification
Determination of melting point
Melting point of Omeprazole was determined by Capillary fusion method using Remi's melting point apparatus and DSC method was used to determine the melting point of Omeprazole as shown in fig 5.8-5.10. The point at which Omeprazole melts was recorded from the thermometer and
compared with the literature value. 4
λmax selection
The stock solution (stock I) of Omeprazole (100 ug/ml) in 0.1N HCI was prepared by dissolving Omeprazole (10 mg) in 10 ml methanol and then final volume was made up to 100 ml with 0.IN HCl, 1 ml of stock solution of Omeprazole was taken and diluted with 9 ml of 0.IN HCl to obtain concentration of 10μg/ml . Ten tablets (LOSEC 40) were weighed and powdered. Amount of powder equivalent to one tablet was weighed and transferred to 50 ml volumetric flask. 5 ml of methanol was added and the powder was dissolved by vigorous shaking. Final volume was made up to 50 ml by adding 0.1N HCI to obtain a concentration of 200 μg/ml. The solution was centrifuged and 5ml of the
supernatant was taken and diluted with 5 ml of 0.IN HCI to obtain concentration of 100 μg/ml. 1 ml of this solution was further taken and final volume was made up to 10 ml using 0.IN HCl to obtain 10μ/ml. Overlay spectrum of both the solutions (stock I and tablet test solution) were taken using UV spectrophotometer. The spectrum is presented in Fig
5.2.5
Drug excipient interaction studies:
Omeprazole, HPMC K15M , and HPMC K100M were physically mixed in ratio 1:1(100 mg each) by geometric mixing, filled in vial and kept at accelerated conditions, (40°C+2°C/75%RH±5%RH). The samples were taken out at predetermined time point (0, 1, 2, 3, 4 weeks) and then examined visually for any change in physical appearance. The data is shown in Table 5.1. The drug alone, excipient alone and physical mixture were taken and subjected to
FTIR and DSCstudies.6
Fourier transform infrared spectroscopy
IR spectroscopy is most powerful technique for fualitative compound identification. It gives information about the group present in the particular compound. FTIR transmission spectra of pure drug (Omeprazole), HPMC K15M, HPMC K100M, their physical mixture and optimized batch of floating tablet were recorded using a Perkin Elmer 1600 FTIR spectrophotometer by Potassium Bromide (KBr) disc. Samples (0.5mg) were mixed with dry KBr and compressed into discs by applying a pressure of 7-10 Newton's. IR spectrum of each sample was recorded in the scan range of 4000-400 cm. FTIR spectra of drug and
polymer are shown in fig.5.3 - 5.5.7
Differential scanning calorimetry
Differential Scanning Calorimetry study of pure drug (Omeprazole), HPMC K15M, HPMC K100M, their physical mixture and optimized batch of Omeprazole were performed
using METTLER differential scanning calorimeter.
Accurately weighed Samples (2mg) were heated on aluminum pan and heated at a constant rate of 10°C/min under a nitrogen gas with flow of 40ml/min. Thermogram were recorded over the temperature range of 25 - 400°C,
DSC of drug and polymers are shown in fig 5.8 to 5.10 8
Preparation of calibration curve:
For the estimation of Omeprazole in bulk drug and
formulations. Among the various methods UV
spectrophotometry is suitable for routine and quick estimation of Omeprazole in preformulation studies, formulation and dissolution samples Calibration curves for Omeprazole were using UV spectrophotometric method in
various solvents.9
Calibration curve of Omeprazole in 0.1N HCI
Primary stock solution of Omeprazole (100ug/ml) in 0.1N HCI was prepared by dissolving Omeprazole (10 mg) in 10ml of methanol and then final volume was made upto 100 ml with 0.1N HCl. From this stock solution, the aliquots of 0.2 ml, 0.4ml, 0.6 ml upto 1.2 ml were transferred to 10 ml volumetric flask and volume was made upto 10ml with 0.1N HCl. The dilutions were scanned in the wavelength range of 200-400 nm to obtain λmax of Omeprazole in 0.1N HCl. The spectrum is present in Fig 5.13. All the samples were then analyzed at chosen λmax for their respective absorbance using UV spectrophotometer and the data is reported in Table 5.7 and calibration curve is also constructed as shown
Formulation and Evaluation Studies Preliminary studies:
A preliminary assessment was conducted to properly develop wet granulation method for production of floating tablet. Various batches of floating tablets were prepared by varying the drug/polymer (D/P) ratio and the amount of magnesium stearate, amount of glidant are accurate. The
composition of floating tablet is given in Table 5.9.11
Preparation of floating tablet:
Omeprazole (500mg) was mixed with required quantity of mixture of polyıner (HPMC KI5M, HPMC K100M), sodium bicarbonate and lactose in mortar for 5 min using spatula.Iso- propyl alcohol was added drop wise till suitable mass of granulation was obtained. The wet mass was granulated through sieve 40#.The granules were dried at room temperature 350 for 1 hr, and then blended with talc and magnesium stearate in the weight proportion as mention in table and compressed on 10-station rotary tablet compression machine using a 8 mm standard flat- face die
punch set.12
Evaluation Parameters:
Preformulation studies:
Preformulation study is defined as an investigation of the physical and chemical properties of drug substance alone and when combined with the excipients. The overall objective of preformulation testing is to generate information useful to the formulator in developing a stable and bioavailable dosage form that can be mass produced. The investigated preformulation parameters include angle of repose, bulk density/tapped density, pour density, Carr's
compressibility index and Hausner ratio.13
• Angle of repose:
It is determined by allowing a powder (1.25 gm) to flow through a funnel and fall freely on to a surface. Further addition of powder is stopped as soon as the pile touches the tip of the funnel. A circle is drawn around the pile without disturbing it. The height and diameter of the resulting cone are measured as shown in fig 5.12. The same procedure is repeated three times and the average value is taken. Angle of
repose is calculated by using the following equation: 13
Tan θ = h/r
Where, h = height of the powder cone; r=radius of the powder
Table 1: Relationship between angles of reposes and flow property:
Angle of Repose (Degrees) Flow
<25 Excellent
25-30 Good
30-40 Passable
>40 Very poor
Bulk Density :
Method I, pass a quantity of material (1.25gm)sufficient to complete the test through a 1.00-mm (no. 18) screen to break up agglomerates that may have formed during storage into a dry 250-ml cylinder introduce, without compacting, approximately 100g of the test sample (M) weighed with 0.1% accuracy. Method II, Select a sample mass having an untapped apparent volume of 150–250 ml. A 100-ml cylinder is used for apparent volumes between 50 and 100 ml. Fill the cylinder carefully. Carefully level the powder
without compacting, if necessary, and read the unsettled apparent volume (Vo) as shown in fig 5.12 Calculate the bulk
density, in g/ml, using the formula, 14
Bulk density (P) = M/V.
Tapped Density :
Accurately weighed quantity of powder (1.25gm) was introduced into a measuring cylinder. Mechanically tap the cylinder containing the sample by raising the cylinder and allowing it to drop under its own weight using a suitable mechanical tapped density tester at a nominal rate of 300 drops/min. Tap the cylinder 500 times and measure the tapped volume (Va). Repeat the operation for an additional 750 tapping sand again measure the tapped volume as (Vb).as shown in fig. 5.12
Since the difference between Vaand Vb was higher, repeat the tapings for an additional 1,250 times, and then the
tapped density was calculated using the following formula15
Tapped density = M/Vf
Where, M = weight of the sample taken; Vf= final tapped
volume.(93)
• Carr's index :
The compressibility index of granules can be determined using Carr's compressibility index, as shown in fig. 5.12 and
was determined by the following formula:15
Carr's index (%) = (Tapped density –Pour density)Tapped density * 100
4.4.2: Post compression parameters:
The prepared tablets were evaluated for quality control tests like weight variation, hardness, thickness, friability and content uniformity. Table 5.13, 5.14
• Weight variation: Ten tablets were selected randomly
of 500 mg from each batch and weighed individually, calculating the average weight and comparing the individual tablet weight to the average. From this, percentage weight difference was calculated and then checked for USP specifications as shown in fig 5.13.
Table 2 Percentage deviation in weight variation.17
Average weight of the tablet Percentage Deviation
130 mg or less More than 130 or less than
324mg More than 324
10 7.5 5
• Hardness and friability: Hardness of tablet was
determined by Monsanto Hardness Tester. Ten tablets were randomly picked from each batch and analyzed for hardness. The mean and standard deviation were also calculated. Friability test was done by Roche Friabilator. Ten tablets were weighed and were subjected to the combined effect of attrition and shock by utilizing a plastic chamber that revolve at 25 rpm dropping the tablets at distance of 6 in. with each revolution. Operated for 100 revolutions, the tablets were de-dusted and reweighed. The percentage
friability was calculated as shown in fig. 5.13. 16
• Tablet Dimensions: Thickness and diameter of tablets
tablets were removed from beaker and the excess surface liquid was removed carefully using the tissue paper. The swollen floating tablets were then re-weighed (Wt), and% swelling index (SI) was
calculated.17
• Content uniformity test: The Omeprazole floating
tablets were tested for their drug content. Five tablets were finely powdered; quantities of the powder equivalent to 15 mg of Omeprazole were accurately weighed and transferred to a 100 ml of volumetric flask. The flask was filled with 0.1N HCL (pH 1.2 buffer) solution and mixed thoroughly. The solution was made up to volume and filtered. 10 ml of the resulting solution was diluted to 100 ml with 0.1N HCL and the absorbance of the resulting solution at 300 nm using a
Shimadzu UV-visible spectrophotometer was
measured. The linearity equation obtained from calibration curve was used for estimation of
Omeprazole in the tablet formulations. 14
• In vitro buoyancy studies (23). The in vitro buoyancy
was determined by floating lag time. The tablets were placed in a 250 ml beaker, containing 200 ml of 0.1 N HCI. The time required for the tablet to rise to the surface and float was determined as Floating Lag Time (FLT) and the time period up to which the tablet remained buoyant is determined as Total Floating
Time (TFT) as shown in Table 5.1418
In Vitro Dissolution Study19
In vitro drug release study of floating tablet was carried out using USP type I dissolution apparatus. The baskets were covered by a piece of muslin cloth to prevent escape of the tablet to the release media. Tablet equivalent to 10 mg of Omeprazole was used in the dissolution study. The test were carried out in 0.1N HCI (900 ml) maintained at 37+0.5°C and stirring at 50 rpm. 10ml sample was withdrawn at regular time interval, and the same amount of fresh dissolution medium was replaced into dissolution vessel. The collected aliquots were analyzed spectrophotometrically at 300 nm respectively for their absorbance. Using calibration curves developed in respective media concentrations were calculated. To take into account the loss of drug in aliquot replaced the correction factor was used as shown in Equation given below.
∑
(
)
Where, Ci = corrected absorbance, Vs = sample of dissolution media withdrawn, Vt = Total volume of dissolution media. Dissolution release profiles were plotted with percentage drug released at different time intervals as shown in Fig.5.14 and the data is shown in Table 5.11.
Kinetics Modeling of Drug Dissolution Profiles20
To analysis the in vitro release data various kinetic models were used to describe the release kinetic. The dissolution profile of the all formulations was fitted to higuchi and Korsmeyer – Peppa’s model to ascertain the kinetic modeling of the drug release and mechanism of drug release.
Zero Oder kinetics (Constant rate process)
Drug dissolution from pharmaceutical dosage forms that do not disaggregate and release the drug slowly can be represented by following equation.
Ft= Kot
Where ft is the fraction of drug dissolved in time t and Ko is zero order release constant.
Pharmaceutical dosage form following this profile release the same amount of drug by unit of time and this is ideal method of drug release in order to achieve a pharmacological prolonged action. The following relation can in a simple way express this model.
Qt= Qo + Kot
Where, Qt is the amount o drug dissolved in time t, Qo is
initial amount of drug in solution and Ko is zero order
release rate constant. Most of the time Qo = 0.
Application: This relationship can be used to describe the
drug dissolution of several types of modified release pharmaceutical dosage forms, as in the case of some transdermal systems, as well as matrix tablets with low soluble drugs in coated forms, osmotic systems, etc.
First order kinetics (Linear kinetics):
Rate is directly proportional to the concentration, of drug undergoing reaction i.e. greater the concentration, faster the reaction. The drug dissolution study was first proposed by Gibaldi and Feldman in 1967. The following relation in a simple way can be expressed as
In (Qt/Qo) = K1t
or in decimal logarithm.
Log Qt= log Qo- K1t/2.303
Where, Q1 is amount of drug dissolved in the time t, Qo is initial amount of drug in solution and K1 is first order release rate constant. In this way a graphic of decimal logarithm of the release amount of drug versus time will be linear.
Application: This relationship can be used to describe the
drug dissolution in pharmaceutical
dosage forms such as those containing water-soluble drugs in porous matrices.
Higuchi model:
Higuchi described the release of drug insoluble matrix as a square root of time dependent processes based on Fickian diffusion. A large number of modified release dosage form contain some sort of matrix system. In such instance, the drug dissolved from the matrix. The dissolution pattern of the drug is dictated by water penetration rate (diffusion controlled). In higuchi model, a plot of % drug release versus square root of time is linear.
Q= Kh t1/2
Where, Kh is constant, t is time.
Application: This relationship can be used to describe the
drug dissolution from several types of modified release pharmaceutical dosage forms, as in the case of some transdermal systems and matrix tablets with water soluble drugs.
Korsmeyer- Peppas model:
To find the mechanism of drug release, drug release data was fitted in Korsmeyer –Peppas model, log of % cumulative drug release versus log of time.
Mt/M∞= Ktn
Where, Mt/M∞ is fraction of drug released at time t and K is
RESULTS AND DISCUSSION
Preformulation Studies: Drug characterization:
Identity of drug was proved by various tests conducted for its characterization as shown below:
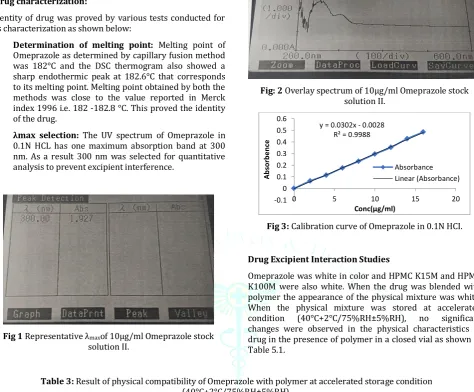
• Determination of melting point: Melting point of
Omeprazole as determined by capillary fusion method was 182°C and the DSC thermogram also showed a sharp endothermic peak at 182.6°C that corresponds to its melting point. Melting point obtained by both the methods was close to the value reported in Merck index 1996 i.e. 182 -182.8 °C. This proved the identity of the drug.
• λmax selection: The UV spectrum of Omeprazole in
0.1N HCL has one maximum absorption band at 300 nm. As a result 300 nm was selected for quantitative analysis to prevent excipient interference.
•
Fig 1 Representative λmaxof 10μg/ml Omeprazole stock
solution II.
Fig: 2 Overlay spectrum of 10μg/ml Omeprazole stock
solution II.
Fig 3: Calibration curve of Omeprazole in 0.1N HCI.
Drug Excipient Interaction Studies
Omeprazole was white in color and HPMC K15M and HPMC K100M were also white. When the drug was blended with polymer the appearance of the physical mixture was white. When the physical mixture was stored at accelerated
condition (40°C+2°C/75%RH±5%RH), no significant
changes were observed in the physical characteristics of drug in the presence of polymer in a closed vial as shown in Table 5.1.
Table 3: Result of physical compatibility of Omeprazole with polymer at accelerated storage condition
(40°C+2°C/75%RH±5%RH).
Drug/ Drug + polymer Observed Physical Appearance
0 week 1 week 2 week 3 week 4 week
1:5 1:5 1:5 1:5 1:5
Drug Alone White Powder White Powder White Powder White Powder White Powder
Drug+HPMC
K15M+HPMC K100 White Powder White Powder White Powder White Powder White Powder
FTIR: FTIR and DSC techniques were used to study the
interaction between Drug and Polymer. FTIR spectrum of Omeprazole is shown in Fig 5.3 and it revealed various characteristic broad peaks such at 3416.30 cm in the spectra
of the pure drug corresponds to C=N group. The peat at 108.32 cm corresponding to C=S bonding. The peak at 1610.83 per cm and 1571.37 per cm indicates the presence of carbonyl group.
Fig 4: FTIR spectrum of Omeprazole
y = 0.0302x - 0.0028 R² = 0.9988
-0.1 0 0.1 0.2 0.3 0.4 0.5 0.6
0 5 10 15 20
Ab
so
rb
e
n
ce
Conc(μg/ml)
Fig: 5 FTIR spectrums of drug and HPMC K15M
Fig: 6FTIR spectrum of drug and HPMC K100M
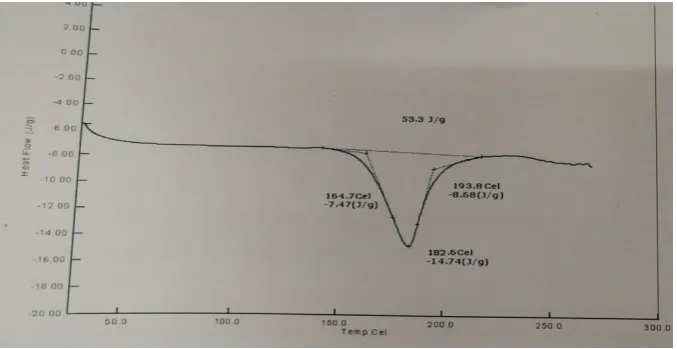
DSC: DSC thermogram of Omeprazole showed a sharp
endothermic peak at 182.6°C corresponding to the sharp melting point and representing its typical crystalline nature. Fig 5.7 shows the DSC thermogram of HPMC K100M with
abroad peak at 162.1°C. Fig 5.8 shows the DSC thermogram of HPMC K15M with a broad peak at 163.0°C, attributed to desolation of water molecules.
Fig: 8DSC thermogram of HPMC K 100M
Fig: 9DSC thermogram of HPMC K15M
Formulation and Evaluation Studies:
We made a 9 batches of different concentration of polymer. In these batches the drug was 40 mg and polymer was taken as a mixture of HPMC K15M and HPMC K100M . We formulated a floating tablet by wet granulation method using isopropyl alcohol as a wetting agent. Excipients like magnesium stearate, PVPK30 and sodium bicarbonate in a dough were passed through sieve no. 40 and 60 then
granules were dried in oven at 121°C for 1 hr. After properly drying of granules, then evaluate the pre compression parameters like bulk density , tap density , angle of repose. then punched the powder with punching machine and made 500mg tablets. The post compression parameters like hardness, weight variation, friability, drug content, floating lag time, buoyancy time, dissolution time and disintegration time were calculated. F3batch has a greater % drug release 91 %.
Table 4:Preliminary batches using different polymer ratios concentration.
S No. Batch Drug(mg.) HPMC
K15M K100M HPMC PVP K30 Stearate Mag. bicarbonates Sod
1 B1 40mg 10% - 4% 1% 10%
2 B2 40mg 15% - 4% 1% 10%
3 B3 40mg 20% - 4% 1% 10%
4 B4 40mg - 10% 4% 1% 10%
Table 5: Batches using mixture of polymers ratio: S.
NO. Batch Omeprazole K100m HPMC
(mg.)
HPMC K15M (mg.)
Lactose
(mg.) Pvp K30
(mg.)
Mg.
Stearate(mg.) Bicarbonate Sodium
(mg.)
1 F1 40 75 50 260 20 5 50
2 F2 40 100 50 235 20 5 50
3 F3 40 125 50 210 20 5 50
4 F4 40 75 75 235 20 5 50
5 F5 40 100 75 210 20 5 50
6 F6 40 50 75 185 20 5 50
7 F7 40 75 100 210 20 5 50
8 F8 40 50 100 185 20 5 50
9 F9 40 125 100 160 20 5 50
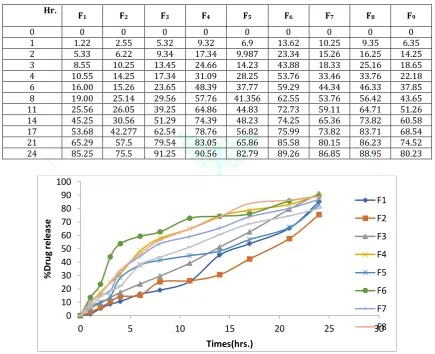
Table 6: Results of % DR of preliminary batches of floating tablet
Hr. F
1 F2 F3 F4 F5 F6 F7 F8 F9
0 0 0 0 0 0 0 0 0 0
1 1.22 2.55 5.32 9.32 6.9 13.62 10.25 9.35 6.35
2 5.33 6.22 9.34 17.34 9.987 23.34 15.26 16.25 14.25
3 8.55 10.25 13.45 24.66 14.23 43.88 18.33 25.16 18.65
4 10.55 14.25 17.34 31.09 28.25 53.76 33.46 33.76 22.18
6 16.00 15.26 23.65 48.39 37.77 59.29 44.34 46.33 37.85
8 19.00 25.14 29.56 57.76 41.356 62.55 53.76 56.42 43.65
11 25.56 26.05 39.25 64.86 44.83 72.73 59.11 64.71 51.26
14 45.25 30.56 51.29 74.39 48.23 74.25 65.36 73.82 60.58
17 53.68 42.277 62.54 78.76 56.82 75.99 73.82 83.71 68.54
21 65.29 57.5 79.54 83.05 65.86 85.58 80.15 86.23 74.52
24 85.25 75.5 91.25 90.56 82.79 89.26 86.85 88.95 80.23
Fig 10: Dissolution profile of floating in Hcl pH 1.2 medium
Zero order reaction:
Fig: 11 zero order release of F3 formulation Fig: 12 first order release of formulation F-3
0
10
20
30
40
50
60
70
80
90
100
0
5
10
15
20
25
30
%
D
ru
g
rel
e
as
e
Times(hrs.)
F1
F2
F3
F4
F5
F6
F7
F8
0 20 40 60 80 100
0 10 20 30
%C
D
R
Times(hrs) Zero order reaction
F3
Linear (F3)
0 0.5 1 1.5 2 2.5
0 5 10 15 20 25 30
%C
D
R
Times(hrs) First order reaction
Fig:13 Higuchi kinetics drug release formulation F-3
Fig:14 Korsmeyer-peppas model of drug
releasesformulation F3
Table 6: Evaluation result of preliminary batches of floating tablet.
Formulation FLT (S) BT (min)
F1 78±0.07 578 ±0.51
F2 103±0.10 596±0.42
F3 159±0.12 581±0.67
F4 197±0.08 697±0.17
F5 232±0.12 706±0.78
F6 268±0.09 718±0.41
F7 284±0.11 789±0.12
F8 306±0.07 809±0.14
F9 347±0.17 814±0.09
FLT-floating lag time and BT- buoyancy time*
CONCLUSION
The study conclusively demonstrated a floating tablet of Omeprazole, prepared using mixture of HPMC K15M and HPMC K100M as polymer, were successfully be prepared by wet granulation method which will lead to improved patient compliance and product quality. The technique adopted for the preparation of floating tablet was wet granulation. A comparative Omeprazole release study from pure drug and optimum batch in 0.IN HCL pH 1.2 was performed. It showed significant change in the percentage of Omeprazole released from floating tablet in HCL pH 1.2 medium was observed, which would affect its availability in stomach.
When the optimum formulation was subjected to accelerated stability study at 40°C+2°C/75%RH±5%RH for three months it showed no significant change in the physical appearance, drug content and in vitro drug release characteristics, thus confirming stability we can conclude that:
• Floating tablet were successfully prepared using wet
granulation technique, and the resultant floating tablet showed the similar dissolution profile for the Omeprazole, release in acidic medium as that of the pure drug.
• Since release of Omeprazole was increased from floating
tablet in 0.1N HCL at 1.2 pH medium, therefore the retention time of Omeprazole is increased in stomach.
• The FTIR, DSC and studies of the Omeprazole containing
tablet indicated the phase inversion of Omeprazole from crystalline to amorphous form.
• Floating tablet of Omeprazole prepared with mixture of
HPMC K15M and HPMC K100M are better than the marketed tablet in case of patient compliance as increase retention time of drug in stomach.
Acknowledgement:
The authors are thankful to theShivalik College of pharmacy for providing the good guidelines and support for work.
Conflict of Interest:
The authors report no conflicts ofinterest.
REFERENCES
1. Chiao C S, Robinson JR., 1995, Sustained release drug delivery system, The science and practice of industrial pharmacy, 2: 1660-75.
2. Streubel A, Siepmann J, Bodmeier R., 2006, Gastroretentive drug delivery system. Expert Opin Drug Deliv., 3(2):217- 33.
3. Iannucelli V, Coppi G, Bernabei M T, Camerorni R., 1998, Air compertment multiple-unit system for prolonged gastric residence. Part-I. Formulation study, Int. J. Pharm., 174: 47-54. 4. Garg R, Gupta G D., 2008, Progress in controlled gastroretentive
delivery systems, Trop. J Pharm Res., 7(3):1055-66.
5. Nasa P, Mahant S, Sharma D., 2010, Floating Systems: A novel approach towards gastroretentive drug delivery systems, Int. J. Pharmacy & Pharma. Sci., 2: 1-7
6. Ross and Wilson, 2010, Anatomy and physiology in health and illness, 11:315.
7. Baumgartner, S., Kristl, J., Vrecer, F., Vodopivec, P., Zorko, B., 2000. Optimization of floating matrix tablets and evaluation of their gastric residence time. Int. J. Pharm. 19(5): 125–135 8. Arora, S., Ali, J., Ahuja, A., Khar, R.K., Baboota, S., 2005. Floating
drug delivery system: a review. AAPS Pharm. Sci. Tech. 6;372– 390.
9. Mishra K, Sharma D, 2012, Childhood obesity in developing generics: epidermiology, determinants and prevention , EPUB,33(1):48-70.
10. Chawla G, Gupta P, Koradia V, Bansal AK. Gastroretention(2003): A Means to address regional variability in intestinal drug absorption. Pharm Tech ; 27: 25
11. Streubel A, Siepmann J, Bodmeier R., 2003, Multiple unit Gastroretentive drug delivery: a new preparation method for low density microparticles. J Microencapsul.,20; 329-47. 12. Mali S.N, Patel N.A, SudhirPawar , Sanket B, 1994, Evaluation of
antiulcer effect of amlodipine in gastric ulcer in rats , Indian journal of pharmacology ,44(3):387-389.
13. Goole J, Vanderbist F, Aruighi K., 2007, Development and evaluation of new multiple-unit levodopa sustained-release floating dosage forms, Int J Pharm., 33(4):35-41
14. Shrma S, Pawar A., 2006, Low density multiparticulate system for pulsatile release of meloxicam. Int J Pharm., 3(1): 150-58 15. Rouge N, Allemann E, Gex-Fabry M, Balant L, Cole ET, Buri P,
Doelker E., 1998, Comparative pharmacokinetic study of a floating multiple-unit capsule, a high density multipleunit capsule and an immediate-release tablet containing 25 mg atenolol, Pharm. Acta. Helbetiae., 7(3): 81-7398
16. Santus G, Lazzarini G, Bottoni G, Sandefer EP, Page RC, Doll WJ, Ryo UY, Digenis GA., 1997, An in vitro- in vivo investigation of oral bioadhesive controlled release furosemide formulations. Eur J Pharm Biopharm., 4(4): 39-52.
17. Klausner E A, Lavy E, Friedman M, Hoffman A., 2003, Expandable gastroretentivedosage forms, J. Control Release, 90:42-62. 18. Deshpande A A, Shah N, Rhodes C T, Malik W., 1997,
Development of a novel controlled-release system for gastric retention, Pharm Res., 14: 815-19
19. Park K., 1988, Enzyme-digestible swelling as platforms for long term oral drug delivery: synthesis and characterization. Biomaterials, 9: 435.
20. Fujimori J, Machida Y, Nagai T., 1994, Preparation of a magnetically-responsive tablet and configuration of its gastric residence in beagle dogs, STP Pharma Sci., 4: 425-30. -50
0 50 100
0 0.5 1 1.5
%C D R Log Times(hrs) Higuchi kinetics F3 Linear (F3)
y = 1.0901x + 0.4884 R² = 0.9002
0 1 2 3
0 0.5 1 1.5