Managing experiments on cognitive processes in
writing with HandSpy
Carlos Monteiro1and Jos ´e Paulo Leal2
1 CRACS & INESC-Porto LA
Faculty of Sciences, University of Porto Porto, Portugal
2
CRACS & INESC-Porto LA Faculty of Sciences, University of Porto
Porto, Portugal [email protected]
Abstract. Experiments on cognitive processes require a detailed
analy-sis of the contribution of many participants. In the case of cognitive pro-cesses in writing, these experiments require special software tools to col-lect gestures performed with a pen or a stylus, and recorded with special hardware. These tools produce different kinds of data files in binary and proprietary formats that need to be managed on a workstation file system for further processing with generic tools, such as spreadsheets and sta-tistical analysis software. The lack of common formats and open reposito-ries hinders the possibility of distributing the workload among researchers within the research group, of re-processing the collected data with soft-ware developed by other research groups, and of sharing results with the rest of the cognitive processes research community.
This paper describes the development of HandSpy, a collaborative envi-ronment for managing experiments in the cognitive processes in writing. This environment was designed to cover all the stages of the experiment, from the definition of tasks to be performed by participants, to the synthe-sis of results. Collaboration in HandSpy is enabled by a rich web interface. To decouple the environment from existing hardware devices for collecting written production, namely digitizing tablets and smart pens, HandSpy is based on the InkML standard, an XML data format for representing digital ink. This design choice shaped many of the features in HandSpy, such as the use of an XML database for managing application data and the use of XML transformations. XML transformations convert between persistent data representations used for storage and transient data representations required by the widgets on the user interface. Despite being a system in-dependent from a specific collecting device, for the system validation, a framework for data collection was created. This framework has also been highlighted in the paper due to the important role it took in a data collection process, of a scientific project to study the cognitive processes involved in writing.
Keywords:InkML, experiments management, collaborative environment,
1.
Introduction
Writing is a basic tool for a successful personal and academic growth. Given the importance of this subject social scientists are actively researching the cog-nitive processes involved in writing. Writing studies can focus on different writ-ing forms, such as keyboard loggwrit-ing and handwritwrit-ing. The writtwrit-ing action can be complemented with other indicators, such as eye movements and speech made during the production. The collected data focus on the complementary concepts of burst and pause [7]. Aburst is a time span in which text was pro-duced without interruptions. A pauseis a non-writing time span between two writing bursts. These two moments are linked to distinct cognitive processes. The duration of a pause is related to the writing task being performed. Dur-ing thepauseperiod the working memory used in the writing process is freed. Therefore the time spent pausing is used for planning and revising the written production.
The development of HandSpy is embedded in the research project DAAR, being held at the Psychology Faculty of Porto University. The object of study in this research is the relation between the cognitive processes involved in writing and the quality of the writing productions. As the goal of this research is in general to determine the factors that influence the development of writing skills, the participants are school children. The object of these research studies are writing productions on different tasks such as narratives, copies, dictations and alphabet transcriptions. Different tasks influence the way the idea of the text is processed. The study results may be used to detect learning problems related to the ability of creating good quality writing productions. This can then be used to define new strategies and interventions on writing teaching.
A collecting framework was developed to collect data for system validation. This framework uses a fairly inexpensive hardware device in a shape of a nor-mal pen, enabling a less intrusive collecting method in the writing process.
The present paper is organized as follows. Section 2 describes the state of the art with regard to the platforms used to conduct scientific experiments on writing productions and describes the principles of experiment management systems in which HandSpy was based. Section 3 describes the main technolo-gies used to develop HandSpy and describes existing devices to record hand-writing productions. Section 4 is the main description of the design and im-plementation methods. Section 5 describes a collecting framework created to validate HandSpy usage. Section 6 is an evaluation of the usability of HandSpy to prepare future modifications. Section 7 concludes this paper and identifies opportunities for future work on HandSpy.
2.
Related Work
This section covers background topics related to the development of a collabo-rative environment for managing experiments on cognitive processes in writing. Studying cognitive processes in writing involves the detailed analysis of writ-ten productions, therefore the analysis component is the essential feature on a software for that purpose. HandSpy analysis engine owes credit to two mature systems used in the study of cognitive processes in writing. These systems are described in the first section of this paper.
The proposed environment complies with the requisites for an Experiment Man-agement System (EMS) [3] thus the second section is devoted to introduce this kind of system.
2.1. Collecting and Analysing Tools
Studies on cognitive processes in writing are mainly conducted by social sci-entists. In the last decade this subject was supported by the availability of new devices to digitally record the writing productions and complemented with new software to analyze those productions. The two most proeminent tools currently available to conduct studies on cognitive processes in handwriting are Eye And Pen [1] and Ductus [2]. The following subsections are a description of these systems.
Pen analysis software to reconstruct the written text and display the point of regard on the tablet surface related to the pen position on that specific moment. The point of regard is the spot in the paper that the participant is looking at a particular moment. The text reconstruction can be played and controlled with a media player style control set. Thepausesare displayed on the reconstructed text image and are represented by a circle centered on the place where the pen stopped, its diameter is defined by thepauseduration time.
The experiment control system consists on a scripting language used to define the tasks to be performed. The tasks are displayed on the computer connected to the tablet. Particular regions on the tablet can be assigned to a function. When these regions are reached they act as control buttons of the experiment and sets the end of a task.
Before Eye and Pen, the eye tracking devices were mostly used to study reading processes. The first known use of eye trackers for studying writing was made on computer typing. Studies on computer typed tasks are limited by the expertise of the participants using a computer keyboard. The tasks that can be performed with a computer keyboard are also limited to the typing action. Any study that makes use of technological equipment to collect the data is sub-ject to errors and mishandling of the devices. For instance the eye tracker de-pends on specifications of the manufacture and some eye trackers require the participant to hold the head still in order to work properly. Using an eye tracker while writing may distract and alter the normal text production. These factors may invalidate the text production.
Ductus Ductus is a software to study the processes involved on handwritten productions. The system is composed by two modules, aStimulus
Presenta-tion Module and aData Analysis Module. The Stimulus Presentation Module
encompasses two parts, the stimulus presentation and a data acquisition mod-ule. The stimulus is displayed on a computer screen in front of the participant and consists on a series of images, words or texts for transcription. The stimu-lus module supports plain text (.txt) and bitmap (.bmp) file formats. The visual stimulus are preceded by a sound to signal the begining of a stimulus.
The data acquisition module works with any model of digitizer from Wacom, a recognized tablets manufacturer. The sample rate is limited by the digitizer model. The elements recorded by the acquisition module are:
– pen postion - the position of the pen on the digitizer.
– pressure - the pressure made on the digitizer, some digitizers enable the recording of hovering movements on the tablet.
– latency - the time between the apearence of the stimulus and the pen touch-ing the digitizer.
– event landmark - is an event defined by the experimenter to signal some occurence during the recording.
The recorded data is stored in a plain text file and is used by theData Analysis
of the handwriting. TheData Analysis Moduleinterface displays information on several windows. There are two windows that display information on the writing and are the most used during the data analysis.
The first window is divided in four parts. A list with data on the points that constitute the text, such as time, position, absolute velocity, absolute accel-eration and pressure, an image with the reconstruction of the text, hovering movements are displayed in a gray light tone, a graph with the variations on the trajectory made with the pen and finally a graph with the pressure made on the tablet and an image of the text and the graphs have a vertical line that syncs the position in the text with the positions in the trajectory and pressure graphs.
The second window is used to segment the text for a thorough analysis. The text can be segmented in a hierarchical way, the text can be divided into paragraphs and each paragraph into words and the words into letters. These segments are made to limit the calculations to a precise area. The results are presented in a table and can be exported through the clipboard or can be saved in a plain text file.
2.2. Experiment Management Systems
The growth of data collected during scientific experiments, leveraged by the use of digital devices, created the need for systems to manage this data. Mul-tiple fields of scientific research require the analysis of large amounts of data. Usually, researchers in these areas do not have the necessary knowledge to manage this information in an automated basis by using a digital database sys-tem.
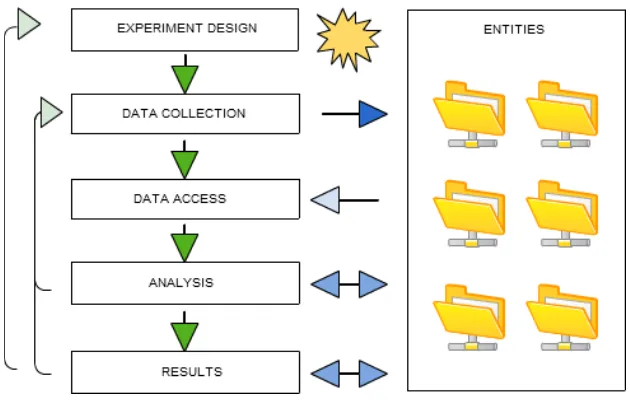
An Experiment Management System is composed by two parts, user interface and data storage system. These systems aim to abstract experimentation pro-cedures, offering a consistent data management system replicated by different experiment stages and entities. An entity is a flexible abstract format to repre-sent information regarding some aspect of the experiment, for instance the list of participants, tasks involved in the experiment and actual collected data [3].
In the Figure 1 is depicts the life cycle of an experiment with data abstrac-tion on entities and its relaabstrac-tion with data transfers. The stages of an experiment process depicted on the Figure 1 are described on the following.
Experiment Designis the first stage of the experimentation process. In this
stage, data files containing information about the experiment are defined. These definitions can be updated in the course of the experiment. These definitions are stored in the database alongside with the collected data.
Data Collectionstage can be repeated several times during the experiment,
Fig. 1.Experiment Life Cycle
Data Accessstage is set to retrieve the data, for analysis, validation or
shar-ing.
Analysisis the main stage of every experiment. The data analysis is done
by researchers that assess its validity and generate the results of their studies. In this step design modifications and the need to collect more data may arise.
Resultsis the final stage of the experiment cycle where the results are
gen-erated. The experiment success is validated by the results. At this point the experiment can be terminated, redesigned or more data may be collected.
3.
Technology
3.1. InkML
keyboard logs and mouse movements.
The ink in InkML is defined by characteristics associated with the act of creat-ing a trace such as the width and color of the trace, the pen orientation while writing, the pen distance to the surface(whether the trace was made with the pen down or hovering the writing surface), among others.
The root element of InkML isinkand has the identifier attributedocumentID
with the typeUniform Resource Identifier (URI)that uniquely defines each file.
Thetraceelement is set to describe a continuous trace, i.e. the act of sketching
a trace with the pen down on the surface. Eachtraceis a collection of points and their features, separated by commas. These characteristics are defined in the
channelelement. If nochannelis defined to cast traces, the defaulttrace
is simply the X and Y coordinates of each point. A set of traces can be grouped in a context, defining optional features such as starting time, writing surface dimensions and characteristics of the trace.
The Listing 1.1 is an example of the ”Hello” word described in a basic InkML file. The word has five letters represented with five traceelements, its con-tents are defined on thetraceFormatwith a set ofchannelelements whose attributes define the nameand the type. The values on thetrace element separated by commas represent the coordinates (X,Y) and a timestamp defined on thetraceFormat channelelements. This data represents each point de-picted on the Figure 2 and the time the point was recorded.
Listing 1.1.InkML ”hello” example
<i n k xmlns= ” h t t p : / / www. w3 . org / 2 0 0 3 / InkML ”> <c o n t e x t x m l : i d = ” s t a r t ”>
<i n k S o u r c e>
<t r a c e F o r m a t>
<channel name= ” X ” t y p e = ” d e c i m a l ” /> <channel name= ” Y ” t y p e = ” d e c i m a l ” /> <channel name= ” T ” t y p e = ” d e c i m a l ” /> </ t r a c e F o r m a t>
</ i n k S o u r c e>
<timestamp x m l : i d = ” s t a r t T i m e ” t i m e = ” 10000 ” /> </ c o n t e x t>
<t r a c e>
10 0 11000 , 9 14 11200 , 8 28 11400 , 7 42 11500 , 6 56 11600 ,
10 70 11700 , 8 84 11900 , 8 98 12100 , 8 112 12200 , 9 126 12300 ,
10 140 12400 , 13 154 12500 , 14 168 12600 , 17 182 12800 , 18 188 12900 , 23 174 13000 , 30 160 13100 , 38 147 13200 , 49 135 13400 , 58 124 13600 , 72 121 13700 , 77 135 13800 , 80 149 13900 , 82 163 14000 , 84 177 14200 , 87 191 14300 , 93 205 14400
</ t r a c e> <t r a c e>
130 155 14500 , 144 159 14600 , 158 160 14800 , 170 154 15000 , 179 143 15100 , 179 129 15200 , 166 125 15300 , 152 128 15400 , 140 136 15600 , 131 149 15700 , 126 163 15800 , 124 177 15900 , 128 190 16000 , 137 200 16200 , 150 208 16300 , 163 210 16400 , 178 208 16600 , 192 201 16700 , 205 192 16900 , 214 180 17000 </ t r a c e>
<t r a c e>
227 50 17100 , 226 64 17200 , 225 78 17400 , 227 192 17500 , 228 106 17600 , 228 120 17800 , 229 134 17900 , 230 148 18100 , 234 162 18200 , 235 176 18300 </ t r a c e>
<t r a c e>
282 145 18600 , 281 159 18700 , 284 173 18900 , 285 187 19000 , 287 101 19100 , 288 115 19200 , 290 129 19400 , 291 143 19700 , 294 157 19900 , 294 171 20000 , 294 185 20200 , 296 199 20300
</ t r a c e> <t r a c e>
366 130 20400 , 359 143 20600 , 354 157 20700 , 349 171 20800 , 352 185 21000 , 359 197 21100 , 371 204 21300 , 385 205 21500 , 398 202 21600 , 408 191 21800 , 413 177 21900 , 413 163 22000 , 405 150 22100 , 392 143 22200
3.2. Digital Sketching Devices
In recent years the digital recording of handwritten data, had significant devel-opments. With smaller process units new writting tools appeared in the shape of normal pens.
This section is an overview on devices that resemble a normal pen and have the capability to digitally record handwritten text.
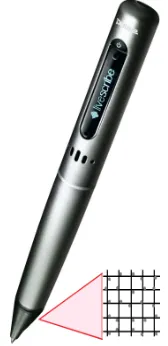
Fig. 3.Livescribe Smartpen and the dotted position system
Livescribe Smartpen The Livescribe Smartpen depicted on Figure 3 is a de-vice with the shape of a normal pen featuring a LCD display, an infrared cam-era and a microphone. The LCD display is just for status information on the smartpen menu navigation and usage, the infrared camera is the key feature for recording sketched shapes and more specifically handwriting. The smart-pen has an internal memory capacity of up to 4GB and a built in battery. The pen has a physical ink cartridge on the tip to sketch on the paper.
can identify the number of the current page.
The smartpen runs a system based on Java Micro Edition and can run exter-nal applications known as Penlets. Livescribe has a SDK forPenlets develop-ment but its support has been discontinued, restricting the use of custom made
Penlets. The Penletscan raise events entering on active zones on the dotted
paper, for instance to scroll through the main menu. The smartpen has a built in handwriting recognition (HWR) system. The dotted paper can be acquired in the form of notebooks or can be produced and printed on a standard 600 dpi laser printer. Every notebook has a Anoto Functionality Document (AFD) to describe it. This document needs to be installed on the smartpen so the printed paper sheets can be used, all the recording done on a page on a notebook is stored on the AFD structure.
For retrieving the recorded data, updating the software and recharging the battery there is a dock station. It has a desktop application, Livescribe Desk-top, that can run both on Windows and Mac OS environments. This application downloads the data files from the smartpen and organizes by notebook. Live-scribe has also a Desktop Application SDK for developing applications to extract and process the recorded data on the pen.
The comercial bundle has an average price of 100e and comes with a smartpen, a dotted notebook and the dock station.
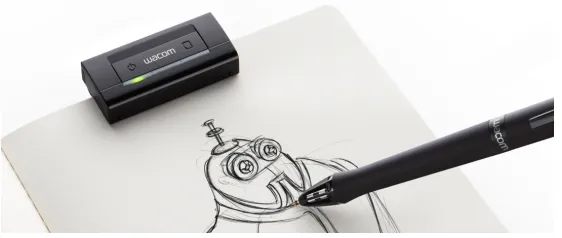
Fig. 4.Wacom Inkling
The operation of this tool mimics the functioning of a sonar system. The pen emits an inaudible sound, that is processed by the receiver. The receiver uses this pulse of sound to calculate the pen position and record it. The pen is pressure sensitive, this enhances the digital line weights. The system allows the definition of a new layer on the same sheet, by pressing a button on the receiver.
To transfer the data from the receiver to the computer, the receiver must be connect to the charging case. The Inkling Sketch Manager is the desktop ap-plication for downloading data from the receiver. Sketches can be saved as a single image by merging different layers or can be exported as layered files and be used on common image editors. The data can also be exported as an XML format similar to InkML.
The comercial bundle has an average price of 200e and its composed by the pen, the receiver and a charging case.
4.
HandSpy
HandSpy is a web based application to manage distributed and collaborative experiments on cognitive processes in writing. The system has the following distinctive features:
– an experiment management philosophy encompassing all the steps of the research in cognitive processes in writing;
– a multiuser web interface fostering collaboration among researchers and enabling remote work on the experiments;
– a cloud-based data management system providing central storage for all data collected in the experiments;
– an analysis process of the collected data, inspired in the state-of-art sys-tems described in Section 2;
– the ability to select and synthesize collections of data based on different criteria;
– the use of standard XML based data formats to promote interoperability and cooperation among researchers in this community.
Protocols
Ink Data
Entities Data
Source
Entity Manager Protocol Manager
XML XML
3
XSL Transformations XML
2
XML
XML
Data Source
1
.PNG InkML
XML
Database Manager
Presentation Logic data
XML
XML
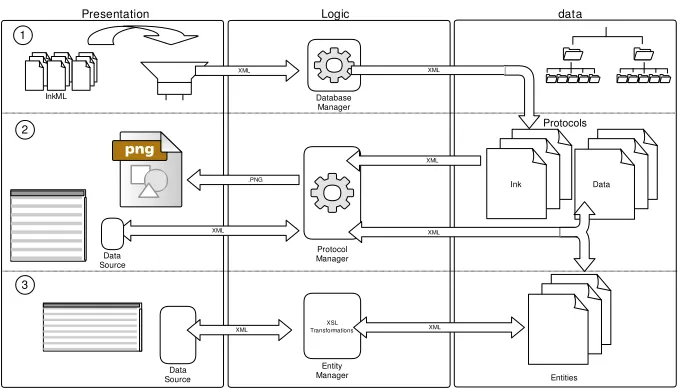
Fig. 5.HandSpy application architecture
The middle row represents the interaction with ink data. The two main com-ponents of HandSpy user interface are depicted in this row, an image viewer to display the written production of the protocol ink and a list of calculations based on the protocol data. The server gets the ink of the selected protocol and generates an image file to feed the image viewer. The list grid is populated with calculations results based on thepauseconcept. To optimize the system, the main definitions on the HandSpy are classified and treated as entities. This generalization of data permits to manage it in the same way. All data showing objects are based on list grids which use XML data sources.
In the third row of the model in Figure 5 is shown the Entity Manager that identifies the entity and uses the respective XSL transformer to transform the data stored in the database into the client specific data source when the fetch operation is made. Adding, updating and deleting entities uses XSL transforma-tions to perform the operatransforma-tions and save the changes to the database.
4.1. Design
This section divides the description of the system design in three parts, the
Application Interface,LogicandData Repository.
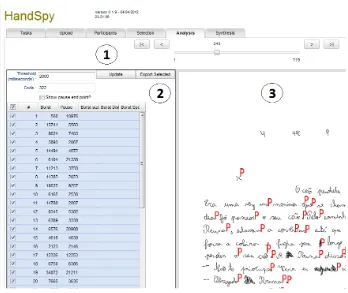
Fig. 6.HandSpy interface
Tasks Identification of tasks to be performed by the participants during the experiment. For instance, an experiment may include a task where partic-ipants must write as much letters of the alphabet as they can in a fixed amount of time.
Upload Upload of the InkML files collected with specialized hardware (smart pens or digitizing tablets) to the system. The interface displays a collection of thumbnail images of the uploaded files. Thumbnails can be selected to display a real size image for better identification. At this stage the InkML data is associated with a task and a participant.
Participants Manage the participants in the current experiment. Display the features and the tasks completed by each participant. Custom features de-scribing the participants, such as handedness or mother language, can be added to the participants. The participants features are useful for select-ing them in a particular study. The list of participants can be imported and exported as a CSV (Comma Separated Values) file.
collec-tion of condicollec-tions on protocols to be analyzed and synthesized. Seleccollec-tions set by different researchers are independent from each other, enabling re-searchers to analyze different collections of protocols simultaneously. Analysis Figure 6 is a screenshot of HandSpy interface with the Analysis tab
selected. The area identified as 1 is a slider to browse the current protocol selection (set in the Selection tab). Area 2 has a form to define the param-eters to calculate the pauses which are listed in the table below. The main parameter is the threshold, the time elapsed to be a pause. Each row has a pause duration, a burst duration, a burst size is a number of words present on the burst, burst distance and the burst average speed. The footer of the table presents statistics on some of its columns, such as the average and standard deviation of durations, and the count of words. Area 3 displays the written production with red Ps (for Pause) marking the place where the pauses selected in area 2 start. Pause selection allows worthless parts (for instance, a part where the participant erased a word) to be removed from the analysis. The current selection of pauses can be stored on the database using the threshold value for identification, this enables the analysis work al-ready done on this transcript to be retrieved for further analysis.
Synthesis Displays global statistics on the data processed on the Analysis tab and is delimited by the selection criteria defined for the analysis process. The statistics presented in Analysis tab table footer for each protocol are computed on this tab aggregating all the selected protocols. These results can be exported to other systems, such as spreadsheets or statistical anal-ysis packages.
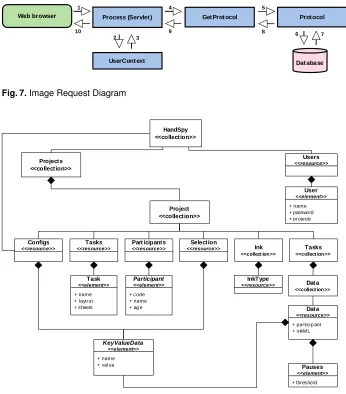
Logic The server side of the system was designed to receive requests, process them and send the response to the client. Figure 7 depicts an image request flux on the server. The client, on the left, sends a request for an image to the server.
TheProcessreceives the request and authenticates the session based on the
UserContext. If it is a valid command for that session the commandGetProcotol
is called. TheProtocolaccesses theDatabaseand requests for the respective
InkMLfile. The resulting image is sent back to the client through the response
stream.
This flow describes the behavior of HandSpy upon a request. HandSpy deals with many requests for information in the XML format. The main differ-ence responding to these request is in the creation of the response. Requests for XML files are created using an XSL transformations engine.
Process (Servlet) Web browser Database UserContext GetProtocol Protocol 1 3 4 5 6 2
10 9 8 7
Fig. 7.Image Request Diagram
HandSpy - Dat a
Users <<resource>> HandSpy <<collection>> Projects <<collection>> Project <<collection>> User <<element>> + name + password + projects Tasks <<collect ion>> Tasks <<resource>> Task <<element>> + name + layo ut + sheets InkType <<resource>> Ink <<collect ion>> Data <<collect ion>> Data <<resource>>
+ particip ant + inkML Part icipants <<resource>> Participant <<element>> + code + name + ag e
Selection <<resource>> Configs <<resource>> KeyValueData <<element>> + name
+ value Pauses
<<element>>
+ thresho ld
Fig. 8.Database structure diagram
for other purposes, projects or even different analysing systems. For every task added to the project a task collection is created with the name of the task, to store data files containing the calculations and other information obtained by analysing the respectiveInkMLfile.
and associated with theInkMLby name. Differente studies can be conducted at the same time as every task has an independentDatafile.
Schema Definitions The entities and the data file associated to the InkML files were specifically defined to work with the proposed architecture. An abstract data format –KeyValueData– which represent a mapping of a value to its key was designed and is used in several entities on the system. The following list covers the definitions of the resources presented on Figure 8.
– TheUsersresource is composed by the login name of the user, its
pass-word and a list of projects to which it has access.
– TheConfigsandSelectionresources are composed byKeyValueData
ele-ments.
– TheTasksresource has the attributes to define the name, the layout and the
sheets. The sheets value is the page interval on the notebook associated to this task.
– TheParticipantsresource have the basic attributecode, to identify the
par-ticipant and a set of KeyValueData elements to complete the participant details.
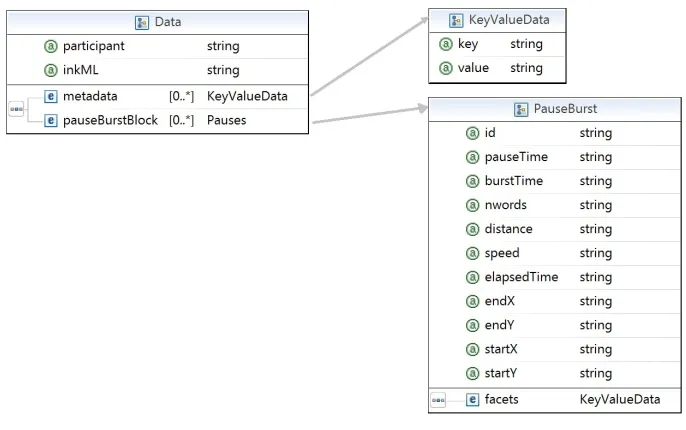
– TheData file has two attributes to identify the file. Theparticipant which has the code of the participant and theinkMLthat have the name of the inkML file. HaspauseBurstBlock element which is aPauses. The Pauses
element defines a set ofPause. EachPausehas an attributethreshold and a set ofPauseelements which is aPauseBurstformat, with calculations for the defined threshold. ThePauseBurst element has several attributes and a set offacetsin theKeyValueDataformat. Figure 9 is theDatafile schema with focus on the attributes of thePauseBurstelement. This file stores the pauses selected on the interface tabAnalysisdescribed in the Section 5.
4.2. Implementation
As depicted in Figure 5, HandSpy is composed by presentation, logic and data layers. The presentation layer was implemented on SmartClient JavaScript framework. The logic layer was deployed on the Tomcat servlet container and the data layer on the eXist XML database. The remainder of this section presents the implementation of each layer, describing the implementation methods using these components as platform.
Fig. 9.Dataschema
of the data source object. As the information can be displayed in a table fashion, the most used widget is theListGrid.
HandSpy analysis gear is the most important feature of the system as it drives the research work. The analysis of the production is made with the visu-altization of the text. SmartClient offers the possibility to create a HTML pane. This pane enables the use of a HTML 5 canvas. Images of the written text are generated on the server and displayed as background of HTML 5 canvas object. The use of Javascript functions enables placement of image objects rep-resenting thepausesstarting points on the canvas, overlaying the background image. This also provides flexibility for future costumizations without being tied to widget/function limitations.
thepauses. Creating and deleting files on the XML database is made by the server. Maintaining the whole processing on the server side reduces the need of processing power on client machines.
All the data is stored as XML files on the database. Using Java Architecture for XML Binding (JAXB) it is possible to, marshal Java objects into XML files and doing the inverse,unmarshal XML files to Java objects. This architecture uses the XSD’s of the XML files to construct Java objects, with getters and
setters for the XML files elements and attributes. This provides a faster and
efficient generation of Java objects, that are in line with the definition of the XML structure on the XSD. These objects can be used to extract values from XML files and bind them to Java primitive data types.
This architecture is useful on the image generation and calculation process. The InkML files are bound into Java objects. By using the InkML object we can
getthe values of the (X,Y) pair for every point of every stroke in that production and draw the corresponding image. The same object is used to fetch the times-tampof every point and calculate the pauses and the rest of the information.
HandSpy server side is composed by aServlet that is the dispatcher for client requests and a set of other functions to create responses. The next list describes some of the main functions that compose the server.
– Process- implements a Java Servlet instance. Acts as the single entrance point on the system, managing all client requests. The HttpSession and
theUserContext are requested or created when required. The information
is sent as an HTTP POST request and is parsed to retrieve the invoked command. The command is tested by an authentication method to attest its validity, if the command is valid for the authenticated user thedoRequest
method is called. Every command performed is stored on theUserContext
for an efficient reusage of the same command.
– Command- is anabstract class to be used by theCommandFactory. The methoddoRequest of class Command is implemented by each command. Every command on the system needs an authenticated session to be per-fomed. TheCommand have theHttpServletRequest,HttpServletResponse
and theUserContextas arguments.
– Protocol- is the class for managing theInkTypeandDataobjects that are
theunmarshalledrepresentations of theInkMLandDataXSD. TheProtocol
class implements several methods including the getImage, that uses the InkType object to generate apngimage and write it to theOutputStreamof
theHttpServletResponse.
– Selector- is the class for implementing the selection engine of the sys-tem. Makes use of the Selection resource described in Section 4.1. The parameters of the Selection resource are used to make a XPath query and generate a scrollableLinkedHashMapwith theProtocol selection. The slider on the client interface is delimited to this selection and can be used to navigate in the selected elements.
array are accessed through theUserContext, therefore all commands using these variables must have a valid instance ofUserContext.
– DBconnection- is a Singleton class that implements the connection to the database. This class connects to the database using the XML:DB API, the unique point for database management. When a fresh installation of the system is made the methodcreateDataBaseStructureIfNeeded is invoked to create the basic structure of the database.
– EntityManager- is the class that implements theAdd,Remove,ListandUpdate
operations on the system resources. Every resource type has a XSL Trans-formation for each operation. Using aDBconnectioninstance the resource files on the database are requested and used to perfom these operations. The result of the operation is written to theOutputStream.
Data Layer TheData Layer was implemented using eXist [4] database man-agement system. As the system uses XML files to represent all the information on the system, choosing a native XML database was the most suitable option.
The database system is installed on the same machine as the Tomcat server and is remotely accessed through a socket. The database is exclusively man-aged by the HandSpy server. The HandSpy database structure described in Section 4.1 is created when the HandSpy starts for the first time.
5.
Collecting Framework
As the focus of the project is based on writing productions, a tool for collecting handwritten data was developed. The device used to collect the data for this experiment was the Livescribe Smartpen, already described in Chapter 3.
There are several advantages in using a smartpen instead of digitizing tablets traditionally used for this kind of experiment. The possibility of setting up an ex-periment in a classroom, a familiar place to the participants and being a writing device similar to the pens normally used by school children. These features make the smartpen less intrusive than digitizing tablets. The cost of running the experiment with smart pens is also relevant because the price of a single digitizing tablet is equivalent to several pens. They are easy to carry, a single researcher can set up and supervise several participants at once. The pens can record several experiment tasks without the need to be connected to download the data to the computer. A single computer can be used to download all the data in every pen.
smartpen.
5.1. Penlet
The smartpen records data written on the paper on the AFD file of the paper
application. This data is used by the Livescribe Desktop to organize the
down-loaded data and render the respective drawing. For the purpose of the exper-iment the default data recorded on the AFD was not sufficient to calculate the pause and burst time. By default the only information on the strokes that can be retrieved with the AFD file was the starting time.
Thepenletwas developed with the Livescribe Pen API. Using the interface
–PenletStorage– storing a plaintextfile in the internal storage pool. For every
stroke, thetimestamp of every point in the stroke was written on the file. This extra timestamp enables the calculation of pauses occured within a stroke.
To record the moments when each experiment started and ended, active re-gions were defined in the paper application. The active rere-gions raise events on
thepenlet when the specified regions are entered or exited. These regions set
a timestamp for the beginning and the end of the experiment. The timestamp is over overriden if the active zone is repeatedly entered. These timestamps are also written on the same file as extra information on the experiment and are used to calculate the time taken to actually start the task.
A visual feedback on the status of the penlet is given through the display on the smartpen. When the penlet starts its version is shown on the display as well as the interaction with the active regions.
Thepenlet is associated with the specific paper application created for the
ex-periment, thepenletstarts running when the tip of the pen touches the sheet of paper. On every change of paper sheet the penlet writes a control line on the
textfile to identify a new collection of strokes.
5.2. Paper Application
Apaper applicationis an AFD file with the digital description of each sheet of a
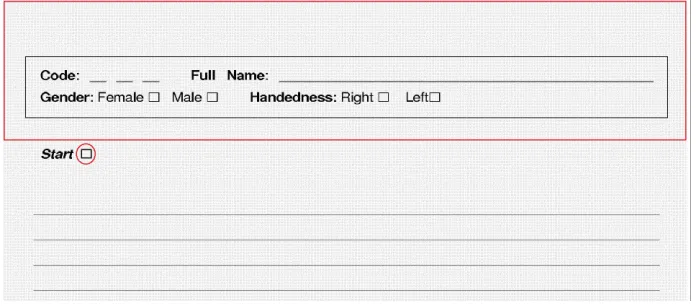
notebook. Different paper applications were design to perfom the different tasks for the experiment. The paper application was developed in the Integrated De-velopment Environment (IDE), Eclipse. Livescribe provides an Eclipse plugin to create an AFD file and interactively draw the active regions. A background image, on the PostScript(PS) format, defines the page layout, with the page header and a place for the action buttons.
All tasks, follow the same layout. The basic layout of the paper sheet consists of three active regions. A top region to place the header, the start and the end button region. The active regions can be drawn aided by the background image, to ensure their exact position.
Fig. 10.Paper Application - active regions in red
if the participant didn’t ”touch” the start button, the start timestamp setter was activated by an event raised by any stroke made outside the header or start delimited region.
5.3. Data File Generator
The Livescribe Desktop SDK is a C# API to extract data from the smartpen used for generating the InkML files.
The AFD files and the internal storage pool, wheretext file with the extra infor-mation on the strokes is stored, are accessed. For every control line with the identification of a new collection of strokes found in the file, a new InkML file is created. The next lines have the timestamp of the beginning of each stroke pre-ceded by increments of milliseconds of every point within the stroke. The time increments have as reference the beginning of the stroke timestamp. These in-crements represent the time of each point within the stroke. The timestamps are used to access the AFD file and retrieve the X and Y coordinates of every point given the timestamp. The InkML file is written with the X,Y coordinates and the respective timestamp. The Listing 1.2 is an example oftrace element generated with information of every point, following the schema [X Y Times-tamp] separated by commas. This data was generated from a real collection made with the smartpen.
5.4. Hardware Issues
Listing 1.2.InkML trace element example . . .
<t r a c e>
2534 685 37297520816 , 2537 684 37297520829 , 2539 681 37297520843 , 2544 678 37297520856 , 2546 677 37297520883 , 2546 678 37297520896 , 2548 680 37297520909 , 2549 682 37297520923 , 2554 695 37297520949 , 2559 707 37297520963 , 2565 720 37297520976 , 2572 732 37297520989 , 2580 749 37297521016 , 2582 753 37297521029 , 2584 754 37297521043 , 2584 754 37297521056 , 2584 754 37297521083 , 2584 754 37297521096 , 2584 754 37297521109 , 2584 754 37297521123 , 2584 753 37297521149 , 2585 751 37297521163 , 2586 748 37297521176 , 2592 738 37297521189 , 2603 710 37297521216 , 2611 694 37297521229 , 2615 684 37297521243 , 2620 673 37297521256 , 2620 670 37297521283 , 2621 670 37297521296 </ t r a c e>
. . .
Our first intention was to use smartpen to react to active regions. On the first version of the paper application the header had active regions to define each field. The information written on the fields was processed by the HWR engine to automatically transform the letters and numbers into its character codes. To improve the HWR success different contexts were associated with each field. For thecodeidentification of the participant, as it was a numeric field, the context was set to recognize only numeric symbols and for thenamefield, only characters. This entailed a change of context for almost every field and consequently an unexpected overload on the smartpen processing capacity. This overload caused a significant increase in stroke losses, which invalidate an entire collection. The ratio of successful recognitions was not enough to be useful therefore the use of the HWR was discontinued.
The experiment participants are intended to be school aged children. The use of audible signals to prompt entering active regions is also discouraged, as it distracts the children and could led to an active region touching spree, invalidating the experiment timestamps. Children tend to hold a pen close to its tip. As the smartpen makes use of the infrared camera to work and it is located on the tip of the pen, it is necessary to pick the pen in a way so the camera is not blocked by any finger.
The Livescribe Desktop SDK is limited to Windows environment. On the first month of the development of the collecting framework, a surprising business move from Livescribe occurred, they discontinued the development program, ceasing the support and updates on the Livescribe SDK. This led to run system updates more thoroughly.
6.
HandSpy Usability Evaluation
The project,Develop Automate and Auto Regulating cognitive processes in
written production. It aims to relate the automation of writing processes and self-regulation of others with the development of this competence.
The plan of the study is divided in two phases. On the first phase, which was the first year of HandSpy development, the participants were children from the second grade to the seventh. The studies characterize the text production and the involved cognitive processes. The second phase will be divided in two interventions. The participants of the first intervention will be children from first to fourth grade and will focus on transcription skills. The second, with children in the fourth grade, will focus on strategies of self-regulation in writing.
In the first year of the development, HandSpy is being used to store the col-lected data of the first phase of the study. More than two thousand productions were collected on several tasks performed with five hundred and sixty children. The collections were made with the collecting device described in Chapter 5 with groups of fifteen children at a time making five different writting tasks. Af-ter collecting the data was uploaded to the HandSpy system and automatically stored on the XML database. HandSpy is currently being used to analyze the data of the first phase of the project.
The social scientists on this project were the users who had more contact with HandSpy therefore they were the main assessors of the system usability. Besides the evaluation that was made throughout the development which iden-tified some problems, an evaluation based on the completion of a questionnaire was also made. The evaluation method is described in the following sections.
6.1. Heuristic Evaluation
Heuristic evaluation is on the most popular methods to identify problems in the user interface design. An heuristic is a set of rules and methods to solve problems. Rolf Molich and Jakob Nielsen [6] describe the heuristic evaluation as ”an informal method of usability analysis where a number of evaluators are presented with an interface design and asked to comment on it”.
After evaluating different heuristics, Nielsen created a list with the best heuris-tics to identify interface usability problems [5].
– Visibility of system status - The system should always give operation status.
– Compatibility- The system should use familiar language to the user. Infor-mation should appear in a natural order.
– User control and freedom- Support undo and redo operations to recover from choosing functions by mistake.
– Consistency and standards- The interface should use consistent colors, operations names and layout.
– Error prevention- Try to prevent errors from ocurring displaying confirma-tion on critical operaconfirma-tions.
– Recognition rather than recall- Minimize the users memory load by mak-ing objects, actions, and options always visible.
– Aesthetic and minimalist design- The information displayed must be rel-evant.
– Help users recognize, diagnose, and recover from errors- Error mes-sages should be clear, precisely indicate the problem and suggest a solu-tion.
– Help and documentation - Help and documentation should always be available.
6.2. Evaluation
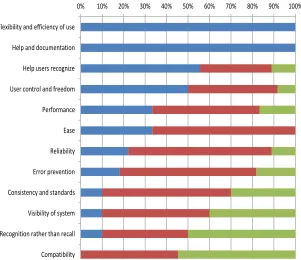
The evalution made on HandSpy usability was based on the results of a ques-tionnaire. The questionnaire was based on the heuristic set listed in Section 6.1. The questionnaire was answered by three evaluators. The questionnaire consisted on a multiple choice answer system. In the Figure 11 is the graph with percentage of each heuristic. The results were processed as follows:
– For each group of questions the possible answers were -Does not apply –Never–Almost Never–Regular–Almost Always–Always
– The total number of effective answers is calculated by subtracting theDoes not applyanswers to the total answers.
– The percentage of the answers ”Never/Almost Never”, ”Regular”, ”Always/Al-most Always” is calculated based on effective answers.
With the analysis of graph is clear that the critical issues on the interface are the lack of help, documentation and poor flexibility. These problems are re-inforced by the evaluators in the comments ”Insufficient help menus and still
arise many errors that are not comprehended”, ”Integrate the help in tutorial
format, improve ergonomics and clarity of controls and functions”. We can
ver-ify that the heuristics better accomplish are ”Compatibility” and ”Recognition
rather than recall”. Despite a better classification, some comments made on
these heuristics suggest some improvements on some specific components
”Improve the way to confirm the selection of data”, ”Improve interactivity with
the data from participants” and ”Transparency for the user’s project idea and
its management”. The comments clearly show that project management is the
feature that deserves more improvements on usability. Despite having quite a few negative points the interface meets satisfactorily the usability heuristics.
The answer to, an overall evaluation of the system,”Considering all the
pa-rameters that you analyzed how would you rank HandSpy?” was unanimous, all
evaluaters answer that the system is”Merely Adequate”. Despite some severe faults on the interface this evaluation showed that HandSpy has potential to be a reference in this field, improving some aspects on the user experience.
7.
Conclusion
0% 10% 20% 30% 40% 50% 60% 70% 80% 90% 100%
Flexibility and efficiency of use
Help and documentation
Help users recognize
User control and freedom
Performance
Ease
Reliability
Error prevention
Consistency and standards
Visibility of system
Recognition rather than recall
Compatibility
Almost Never/Never
Regular
Almost Always/Always
Fig. 11.Heuristic Evaluation
possibilities provide new ways of studying the cognitive processes involved in the handwriting process. This paper describes the design, implementation and evalution of a new tool, HandSpy, to support the study on cognitive processes in writing.
HandSpy aims to manage and support handwriting research studies with large amounts of data and enable collaborative work to speed up the analysis pro-cess. Embedded in a web platform, HandSpy is a powerful tool to be used as a cross platform environment. With the use of the web browser as the main working tool, it obviates the need for installing various programs, on various machines.
The collecting framework described in the Chapter 5 is a new tool for record-ing writrecord-ing productions. The use of a commercial product such as the Livescribe smartpen to collect written productions results on a affordable, easy to use and less intrusive compared to other tools for this purpose. This tool has already raised interest among the social sciences research community.
7.1. Future Work
defined the next steps in the user interface upgrades. Based on the outcome of the questionnaire along with a series of suggestions made by the evalua-tors, we present here some of the main future implementations to improve user interaction.
– Incorporate user guides and tutorials on the interface, offering information on the current screens.
– Improve error handling giving specific feedback of the error.
– Optimize interaction in the analysis screen giving a more accurate selection and identification of the pauses.
– Create a real time animation playback of the written text.
The smartpen has a built-in microphone which enables collection extension with audio data. This can be used to record information on what participants are thinking, if they are asked to ”think out loud”, while writing. In this case synchro-nizing the audio with the writing is eased as they are collected with the same device. Collecting physiologic data such as heart rate or electric conductivity of the skin can be useful to relate with the writing pauses. Video recording the production is also an added value for the research but only if we manage to retrieve the point of regard on the paper during the writing production. Never-theless synchronizing video and physiologic data with the writing raises new challenges.
Acknowledgments.This work is in part funded by the ERDF/COMPETE Programme
and by FCT within the projects FCOMP-01-0124-FEDER-022701 & PTDC/PSI-PCO/110708/2009.
References
1. D. Alamargot, D. Chesnet, C.D., Ros, C.: Eye and pen: A new device for studying reading during writing. Behavior Research Methods (2006)
2. E.Guinet, Kandel, S.: Ductus: A software package for the study of handwriting pro-duction. Behavior Research Methods (2010)
3. Ioannidis, Y.E., Livny, M.: Conceptual schemas: Multi-faceted tools for desktop sci-entific experiment management. Journal of Intelligent and Cooperative Information Systems 1, 451–474 (1992)
4. Meier, W.: e[x]ist: An open source native xml database. Web, Web-Services, and Database Systems (2003)
5. Nielsen, J.: Enhancing the explanatory power of usability heuristics. In: Proceedings of the SIGCHI conference on Human factors in computing systems: celebrating inter-dependence. pp. 152–158. ACM, New York, NY, USA (1994)
6. Nielsen, J., Molich, R.: Heuristic evaluation of user interfaces. In: Proceedings of the SIGCHI conference on Human factors in computing systems: Empowering people. pp. 249–256. ACM, New York, NY, USA (1990)
Carlos Monteiro is currently a Telecommunications Engineer at Inmarsat, a satellite telecommunications company. During his master’s degree he was in-volved in a research project that was focused on digital handwriting formats and analysis, based on XML.
Jos ´e Paulo Leal is assistant professor at the department of Computer Sci-ence of the Faculty of SciSci-ences of the University of Porto (FCUP) and asso-ciate researcher of the Center for Research in Advanced Computing Systems (CRACS). His main research interests are eLearning system implementation, structured document processing and software engineering. He has a special interest on automatic exercise evaluation, in particular on the evaluation of pro-gramming exercises, on ontology processing and on web adaptability. He has participated in several research projects in his main research areas, including technology transfer projects with industrial partners. He has over 60 publica-tions in conference proceedings, journals and book chapters.