IJSRSET184116 | Received : 25 Dec 2017 | Accepted : 07 January 2018 | January-February-2018 [(4) 1 : 01-09 ]
© 2018 IJSRSET | Volume 4 | Issue 1 | Print ISSN: 2395-1990 | Online ISSN : 2394-4099 Themed Section : Engineering and Technology
01
Optimizing the Co
2- Laser Parameters to Attain the Minimum
Wear Rate in Cobalt Based Hardfaced Surfaces
A. Umesh Bala
*1, Dr. R. Varahamoorthi
21Research Scholar, Department of Manufacturing Engineering, Annamalai University, Tamil Nadu, India 2Associate Professor, Department of Manufacturing Engineering, Annamalai University, Tamil Nadu, India
ABSTRACT
The laser hardfacing is carried out by CO2 laser. AISI 304 stainless steel is used as the base metal and Stellite- 6 cobalt based powder is used as hardfaced material. In this Investigation an attempt has be made to optimizing the process parameters of laser hardfaced surfaces such as Laser Power (P), Travel Speed (T), Defocusing Distance (D) and Powder feed rate (F). The influence of the processing variables on wear rate is discussed. The experiments were conducted using design matrix based on a four factor and five level central composite rotatable design. An empirical relationship was developed to predict the Wear Rate of Cobalt-based (Stellite-6) hardfaced layer using Response Surface Methodology (RSM) technique. The optimized parameters and the influenced parameter were identified. The interaction effects of input process parameters of laser hardfacing were discussed.
Keywords: Optimizing, RSM, Stellite-6, Laser Hardfacing, Wear Rate, AISI 304 SS.
I.
INTRODUCTION
The laser hardfacing technique offers unique advantages over other processes in that the overlay or substrate hardfacing provides a metallurgical bond which is not susceptible to spallation and can easily be applied free of porosity and other defects. The process is also extremely versatile as a large variety of materials can be deposited for protection against degradation. The materials used for hardfacing should have melting point close to or lower than the substrate materials. During hardfacing, the temperature of the coating material is increased to the melting point and then allowed to solidify on the substrate. The effectiveness of hardfacing depends on the process of application of the hardfaced layer and the composition of the layer. The process should be optimized to have high deposition rate, high thermal efficiency, excellent dilution, excellent control of composition and hardfacing thickness. These processes can be grouped as torch processes, arc hardfacing process and high energy beam processes. Among high energy beam processes, laser hardfacing and electron beam hardfacing are more important. In this investigation the high energy CO2 laser beam is used. The laser based techniques offer several distinct advantages over other conventional
surface modification processes. All variants of laser surface modification are characterized by very fast heating and cooling rates resulting in a rapidly solidified layer, in which both the microstructure and the distribution of the alloying elements could be tailored as required by suitably controlling the operating parameters. The metastable and non-equilibrium phases that can form as a consequence of rapid quenching, offer the possibility to develop layers with novel microstructures and properties superior to those of traditional processes.
Table 1: Chemical composition (wt.%) of Base material (AISI 304 SS).
C Mn Ni Si P S Cr Fe
≤0.12 ≤ 2.0 8.00 – 11.00
≤1.0 ≤0.035 ≤0.03 17.00 –19.00
Balance
This plasticity helps in dissipating energy, and in the process cracking and spalling of the hardfacing is avoided. However, there are some inherent problems associated with this material. Annealing or slow heating followed by cooling results in embrittlement of the material due to precipitation of carbides in the grain boundary. This material with high work hardening capability and moderate yield strength is capable of responding plastically to abrasion and impact loading.
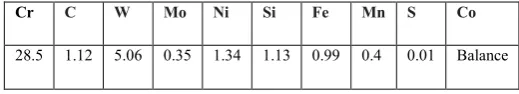
Cr C W Mo Ni Si Fe Mn S Co
28.5 1.12 5.06 0.35 1.34 1.13 0.99 0.4 0.01 Balance
Table 2: Chemical composition (wt.%) of Powder
material (Stellite-6).
The main advantage of Cobalt based (Stellite-6) hardfacing alloys are excellent wear resistance, corrosion and oxidation resistance and that is why they are successful in replacing Iron based alloys. These alloys are however more expensive than other variety of alloys. The Cobalt-based hardfacing alloy was developed as Stellite. Stellite-6 alloys contain varying amount of Carbon, Tungsten and Molybdenum to enhance the properties. The cobalt alloy is also strengthened by chromium. The wear resistance is governed by formation of carbide, their volume fraction and size and distribution.
II.
EXPERIMENTAL WORK
The Identified input parameters are Laser Power (P), Travel Speed (T), Defocusing Distance (D) and Powder Feed Rate (F). The upper limit was coded as + 2 and the lower limit as -2 by using the input parameters and their working range. The design matrix was developed and the experiment were conducted as per the design matrix. The laser hardfacing parameters and their limits are tabulated in Table 3 The experimental runs were carried out based on trials AISI 304 stainless steel plate using Stellite-6 alloy to find out the feasible working limits of laser hardfacing parameters.
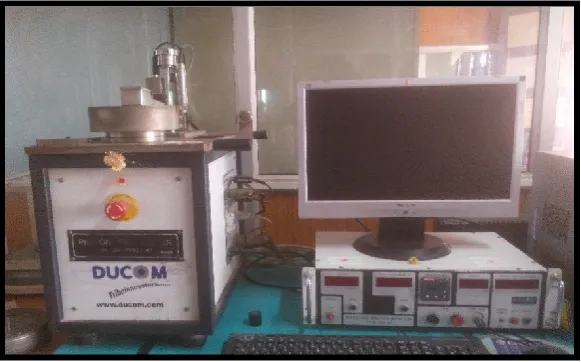
Figure 1 : Pin on Disc set up
2.1 Identify The Important Process Variables and Its Limits:
Parameters Units Notations Levels
-2 -1 0 1 2
Laser Power W P 2200 2400 2600 2800 3000 Travel Speed mm/min T 400 500 600 700 800
Defocusing Distance mm D 16 18 20 22 24
Powder Feed Rate g/min F 4 8 12 16 20
Table 3: Laser hardfacing parameters and their limits
The trail experiments were conducted and the working range was decided based on the quality appearance and the absence of any visible defects. Different combinations of parameters were used to carry out the trial experiments. This was done by varying any one of the factors from minimum to maximum while keeping the other parameters at constant. The working limits of the individual parameters were identified by macro and
After hardfacing the deposit was cut into small samples by using Electrical Discharge Machining (EDM) for wear test on pin on disc machine as shown in Figure 2. and scanned electron microscopy (SEM) images. The evaluating of wear rate for 30 samples as per the design
matrix was calculated by maintaining the wear testing parameters as constant. and the subsequent values are noted. The same wear rate values are used for deriving the empirical relationship.
Figure 2: Laser Hardfaced Samples for wear test
Source Sum of
Squares
Degree of freedom
Mean
Square F-value p-value
Significant (or) Not significant
Model 0.0212 14 0.0015 73.01 < 0.0001 Significant
P 0.0006 1 0.0006 28.42 < 0.0001
T 0.0010 1 0.0010 49.09 < 0.0001
D 0.0010 1 0.0010 49.72 < 0.0001
F 0.0030 1 0.0030 146.52 < 0.0001
PT 0.0001 1 0.0001 2.50 0.1349
PD 0.0002 1 0.0002 9.71 0.0071
PF 0.0001 1 0.0001 6.71 0.0205
TD 0.0001 1 0.0001 4.53 0.0503
TF 0.0003 1 0.0003 15.61 0.0013
DF 0.0004 1 0.0004 21.44 0.0003
P² 0.0079 1 0.0079 381.51 < 0.0001 T² 0.0041 1 0.0041 195.22 < 0.0001
D² 0.0000 1 0.0000 1.73 0.2084
F² 0.0057 1 0.0057 275.61 < 0.0001
Residual 0.0003 15 0.0000
Lack of Fit 0.0002 10 0.0000 0.7200 0.6928 Not Significant
Pure Error 0.0001 5 0.0000
Cor Total 0.0215 29
R² 0.9855
Adjusted R² 0.9720 Std. Dev. 0.0046
Predicted R² 0.9423 Mean 0.1986
Adeq Precision 29.3675 C.V. % 2.29
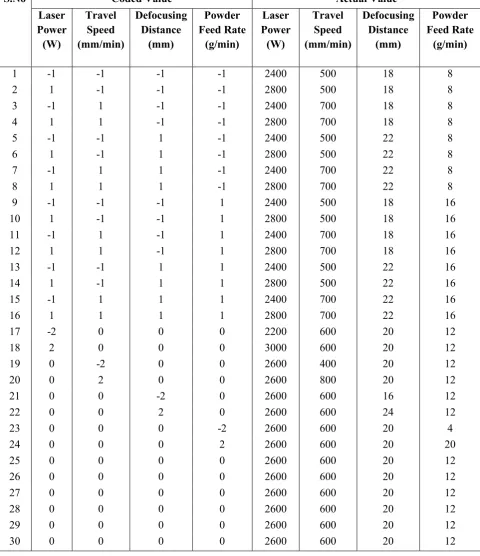
2.2 Experimental Design Matrix:
S.No Coded Value Actual Value
Laser Power (W)
Travel Speed (mm/min)
Defocusing Distance
(mm)
Powder Feed Rate
(g/min)
Laser Power (W)
Travel Speed (mm/min)
Defocusing Distance
(mm)
Powder Feed Rate
(g/min)
1 -1 -1 -1 -1 2400 500 18 8
2 1 -1 -1 -1 2800 500 18 8
3 -1 1 -1 -1 2400 700 18 8
4 1 1 -1 -1 2800 700 18 8
5 -1 -1 1 -1 2400 500 22 8
6 1 -1 1 -1 2800 500 22 8
7 -1 1 1 -1 2400 700 22 8
8 1 1 1 -1 2800 700 22 8
9 -1 -1 -1 1 2400 500 18 16
10 1 -1 -1 1 2800 500 18 16
11 -1 1 -1 1 2400 700 18 16
12 1 1 -1 1 2800 700 18 16
13 -1 -1 1 1 2400 500 22 16
14 1 -1 1 1 2800 500 22 16
15 -1 1 1 1 2400 700 22 16
16 1 1 1 1 2800 700 22 16
17 -2 0 0 0 2200 600 20 12
18 2 0 0 0 3000 600 20 12
19 0 -2 0 0 2600 400 20 12
20 0 2 0 0 2600 800 20 12
21 0 0 -2 0 2600 600 16 12
22 0 0 2 0 2600 600 24 12
23 0 0 0 -2 2600 600 20 4
24 0 0 0 2 2600 600 20 20
25 0 0 0 0 2600 600 20 12
26 0 0 0 0 2600 600 20 12
27 0 0 0 0 2600 600 20 12
28 0 0 0 0 2600 600 20 12
29 0 0 0 0 2600 600 20 12
30 0 0 0 0 2600 600 20 12
Figure 3: Pin on Disc wear test machine
III.
DEVELOPING AN EMPIRICAL
RELATIONSHIP
Wear rate of hardfaced surface is a function of the Laser parameters such as Laser power (P), Travel speed (T), Defocusing distance (D), Powder feed rate (F), and it can be expressed as
Wear Rate of deposit = f (P, T, D, F)
The second-order polynomial equation used to predict the response surface Y is given by
∑ ∑ ∑
) And for four factor, the selected polynomial could be
expressed equally
Wear Rate = b0 + b1(P) + b2 (T) + b3 (D) + b4 (F) + b12(PT) + b13 (PD) + b14 (PF) + b23 (TD) + b24(TF) + b34 (DF) + b11(P2) + b22 (T2) + b33 (D2) + b44 (F2)
( where, b0 is the average of response and b1, b2, b3…b4
are regression co-efficient that depends on respective linear, interactions and square terms of factors. The value of co-efficient was calculated using Design Expert software at 95% confidence level. The significance of the each co-efficient was calculated from t-test and p values. The value of “Probe > F” is less than 0.05, indicates that model terms are significant.
Wear Rate = {+4.4495 - 0.0024 P -0.0011 T - 0.0384 D - 0.0540 F - 9.00000E-08 P * T+ 8.87500E-06 P * D +3.68750E-06 P * F -0.000012 T * D +0.000011 T * F
+ 0.000659 D * F +4.24844E-07 P ² +1.21562E-06 T² +0.000286 D² +0.000903 F²}
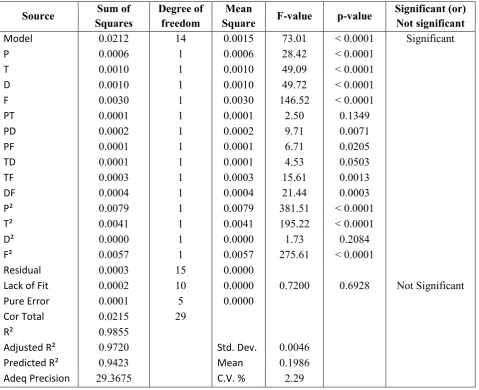
The equation in terms of actual factors can be used to make predictions about the response for given levels of each factor. Here, the levels should be specified in the original units for each factor. This equation should not be used to determine the relative impact of each factor because the co-efficient are scaled to accommodate the units of each factor and the intercept is not at the center of the design space. The adequacy of the above relation is tested by analysis of variance(ANOVA). The ANOVA test results are given in Table 4. at the desired confidence level of 95%. The relationship may be considered to be adequate. If the calculated value of the F ratio of the developed relationship does not exceed the tabulated value of F ratio for an anticipated level of confidence and the model is found to be adequate. The Fisher’s F-test with a very low probability value demonstrates a very high significance of the regression model. The goodness of fit of the model is fitted by the
determination co-efficient (R2). The coefficient of
determination was calculated to be 0.985 in response which implies that 98.5% of the experimental values confirm the compatibility with data as predicted by the
model. The R2 value should always be between 0 and 1.
A model is statistically good the R2 value should be close to 1.0. Then adjusted R2 value reconstructs the
expression with the significant terms. The Model
not significant. If there are many insignificant model terms (not counting those required to support hierarchy), model reduction may improve the model. The Lack of Fit F-value of 0.72 implies the Lack of Fit is not significant relative to the pure error. Non-significant lack of fit is good hence the model is considered to be fit. The value of adj. R2=0.97 is also high and indicates the high significance of the model. The pred. R2 value is 0.94 which means that the model could explain 94% of the variability in prediction. Adequate measures of the signal to noise ratio, a ratio greater than 4 is desirable. During this investigation the ratio is 29.36, which indicates an adequate signal. The model can be used to navigate the design space.
IV.
OPTIMIZING THE LASER PARAMETERS
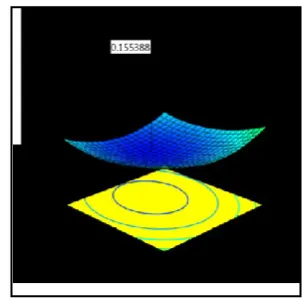
The surface and contour plots are shown in Figure 4 (A– F) for each process parameters. From the Response surface and contour plots graphs, it can be observed that when the Wear Rate trends to decrease with increasing Powder Feed Rate. It may be validated due to increase in hardness of laser hardfaced surface. The Wear Rate increases with increasing laser power because the high heat input will rise the depth of penetration and increases the rate of dilution of the deposits. Contour plot shows a vital role in the erudition of the response surface. It is clear that the Wear Rate get minimized with the rise in powder feed rate (F) and defocusing distance (D). With an increase of process parameters such as laser power (P) and travel speed (T), the wear rate reaches to a minimum level and then it starts to
multiples. Wear Rate mainly depends on dilution, hardness and microstructure. When the powder feed rate increases the dilution rate is minimized which because of more amount of heat is utilized for melting the hardfacing powder material and only a very small amount of heat is enough to melt the substrate material. So that the hardness of the hardfaced surface increases and leads to the decrease in Wear Rate. The rate of dilution reduces with the increase of defocusing distance which leads the decrease of wear rate to certain limit. With increasing the Transfer speed, the powder density per square area becomes less hence there is an upturn in the dilution rate and it rise the value of Wear Rate. Laser power is mainly used for melting the powder but when it keeps increasing, the high volume of substrate material begins to melts which leads to the results of an upturn in dilution, as the variation of Wear Rate in laser hardfaced sample could be affected by the dilution. As the results of higher dilution the hardness of laser hardfaced sample falls down which leads to an increasement in wear rate. So the dilution should be kept minimum to attain the achievable minimum wear rate. Increasing Laser Power raises the dilution rate and multiples the Wear Rate. By analysing the response surface and contour plots as shown in Figure 4 (A–F), the optimized rounded values of laser hardfacing parameters are shown in Table.6. It is found that the minimum wear rate of 0.155388 (mg/N-km) can be achieved by the laser power of 2615 (W), Travel speed of 634 (mm/min), Defocusing distance of 22 (mm) and Powder feed rate of 12.5 (g/min).
.
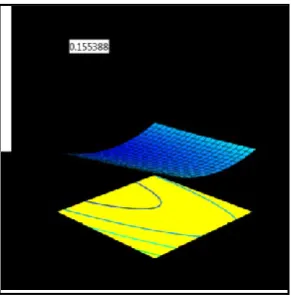
Figure 4 B: Interaction effect of Laser Power and Defocusing Distance
Figure 4 C: Interaction effect of Laser Power and Powder Feed Rate
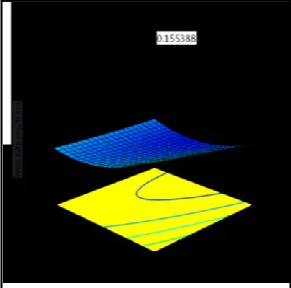
Figure 4 D: Interaction effect of Travel Speed and Defocusing Distance
Figure 4 F: Interaction effect of Powder Feed Rate and Defocusing Distance
Table 6: Optimized Hardfacing Parameters for wear rate.
V.
CONCLUSION
An empirical relationship was developed to predict the Wear Rate of cobalt-based (Stellite-6) hardfaced layer produced on AISI 304 Stainless-Steel substrates by incorporating important Laser Hardfacing parameters such as Laser power(P), Travel speed (T), Defocusing distance (D), and Powder feed rate (F). A minimum Wear Rate of 0.155388 (mg/N-km) could be achieved in the Laser hardfaced surface which was produced by the Laser Power of 2615 (W), Travel Speed of 634 (mm/min), defocusing distance of 22 (mm) and Powder Feed Rate of 12.5 (g/min). The Powder Feed Rate is identified as the major influencing factor than other three laser hardfacing parameters to predict the Wear Rate of Hardfaced surfaces.
VI.
REFERENCES
[1]. P. Balu, P. Leggett, “Multi-response optimization of laser-based powder deposition of multi-track single layer hastelloy C-276,” Mater. Manuf. Process., vol. 28, no. 2, pp. 173–182, (2013). [2]. K. Y. Benyounis “Optimization of different
welding processes using statistical and numerical approaches - A reference guide,” Adv. Eng. Software., vol. 39, no. 6, pp. 483–496, (2008).
[3]. S. Guo, Z. Chen, D. Cai, and J. Yao, “Prediction of simulating and experiments for co-based alloy laser cladding by HPDL,” Phys. Procedia, vol. 50, no. October 2012, pp. 375–382, (2013). [4]. M. K. Alam, N. Nazemi, “Investigating Process
Parameters and Microhardness Predictive Modeling Approaches for Single Bead 420 Stainless Steel Laser Cladding,” August, (2017). [5]. Wood, P. D, Evans, H. E. and Ponton, C. B.
“Investigation into the wear behaviour of Stellite 6 during rotation as an unlubricated bearing at 600 °C”, Tribology. Int..44, pp. 1589–1597 (2011). [6]. Luo., H. li. “Abrasive Wear Comparison of
Cr3C2/Ni3Al Composite and Stellite 12 Alloy Cladding”. J. Iron Steel Res. Int. 14, pp. 15–20, (2007).
[7]. S. Liu., “Statistical analysis and optimization of processing parameters in high-power direct diode laser cladding,” Int. J. Adv. Manuf. Technol., vol. 74, no. 5–8, pp. 867–878, (2014).
[8]. F. Madadi, F. Ashrafizadeh, “Optimization of pulsed TIG cladding process of stellite alloy on carbon steel using RSM,” J. Alloys Compd., vol. 510, no. 1, pp. 71–77, (2011).
[9]. B. R. Moharana,“Experimental investigation on mechanical properties of AISI 304 to Cu joints by
S. No Important Laser Parameters Optimized Value
CO2 laser,” Eng. Sci. Technol.Int. J., vol. 19, no. 2, pp. 684–690, (2016).
[10]. I. Tabernero, A. Calleja, A. Lamikiz, and L. N. López De Lacalle, “Optimal parameters for5-axis Laser cladding,” Procedia Eng., vol. 63, pp.45– 52, (2013).
[11]. Ahn, D. G. “Hardfacing technologies for improvement of wear characteristics of hot working tools”: A review. Int. J. Precis. Eng. Manuf.pp. 14, pp. 1271–1283, (2013).
[12]. Ameen, H. “Effect of loads, sliding speeds and times on the wear rate for different materials”. Am.J. Sci. Ind. Res.2, pp. 99–106 (2011).
[13]. K. S. H. Prasad, C. S. Rao, “Application of Design of Experiments to Plasma Arc Welding Process: A Review,” J. Brazilian Soc. Mech. Sci. Eng., vol. 34, no. 1, pp. 75–81, (2012).
[14]. Liu, R., Yao, J. H., Zhang, Q. L., Yao, M. X. and Collier, R. Sliding wear and solid- particle erosion resistance of a novel high-tungsten Stellite alloy. Wear322–323, pp. 41–50, (2015).