RESEARCH ARTICLE
ZINC OXIDE NANOPARTICLES IMPREGNATED POLYMER HYBRIDS FOR EFFICIENT EXTRACTION
OF HEAVY METALS FROM POLLUTED AQUEOUS SOLUTION
Beaulah Angelin, K., Siva, S. and
*Sayee Kannan, R.
Department of Chemistry, Thiagarajar College, Madurai-625009, India
ARTICLE INFO
ABSTRACT
The aim of this research work is to investigate the exploitation of the nano zinc oxide composite was used as an adsorbent for the removal of Pb(II), Hg(II), Cd(II) and Bi(III) heavy metal ions from aqueous solution. The resulting adsorbent n-ZPFR was characterized by SEM with EDS, BET, TEM, FT-IR, XRD, DTA and TGA analyses and tested for metal adsorption. The maximum adsorption performance was achieved for Pb(II), Hg(II), Cd(II) and Bi(III) ions from aqueous solution by n-ZPFR was investigated as a function of some parameters such as initial metal ion concentration (0.01M), contact time (60min), dose (0.250g) and temperature (328K). Langmuir, Freundlich, Dubinin Kaganer-Radushkevich, Temkin and Jovanoic isotherm models were used to interpret the experimental data. The data obeyed both D-R and Jovanoic models (R2=0.999) indicating a monolayer adsorption of heavy metal ions onto the homogeneous surface. The linear plot of Temkin isotherm showed adsorbent adsorbate interactions. Moreover, the energy obtained from D-R isotherm (2579.8-426.9 KJ/mol) indicated a physical adsorption of the metal ions onto the adsorbent surface. Kinetic studies indicated that Pb(II),Hg(II),Cd(II) and Bi(III) ions adsorption followed the pseudo-second-order model. Kinetics; controlled by both liquid-film and intra-particle diffusion mechanisms. The thermodynamics parameters (∆G0, ∆H0 and ∆S0) of adsorption systems indicated spontaneous and endothermic process. The results suggested that n-ZPFR composite is economical, eco-friendly and capable to remove Pb(II), Hg(II), Cd(II) and Bi(III) from natural water resources.
Copyright © 2015Beaulah Angelin et al.This is an open access article distributed under the Creative Commons Attribution License, which permits unrestricted use, distribution, and reproduction in any medium, provided the original work is properly cited.
INTRODUCTION
Environmental Pollution today has far-reaching negative consequences on human lives. Water pollution is increasing worldwide due to rapid growth of industry, increase the human population, domestic and agricultural activities which leads to
the life time threatening diseases (Schwarzenbach et al.,
2010). Degradation of organic pollutants that have deleterious effects on human well-being has become a focus of current scientific research effort. Heavy metal ions are dangerous constituents of waste waters because of their toxicity to living
systems even at low concentrations (Fujita et al., 2014). The
pollution of the environment with heavy metals is a result of human activities, and the effects of these toxic metals on the ecosystems are of public health significance. Toxic metals can be distinguished from other pollutants, since they are not biodegradable and can be accumulated in living tissues, causing various diseases and disorders. The increasing levels of toxic heavy metal ions discharged into the environment have received considerable attention due to the adverse effects on receiving waters.
*Corresponding author: Sayee Kannan, R.,
Department of Chemistry, Thiagarajar College, Madurai-625009, India.
These include metal ions such as lead (Pb), Chromium (Cr), Copper (Cu),Cadmium (Cd), Nickel (Ni), Silver (Ag), Mercury (Hg) and Zinc(Zn).The potential sources of heavy metal ions in wastewaters include fertilizers, fungicides, metals used in manufacturing paints, pigments and batteries. Although few natural sources are concerned for lead existence such as soil-erosion, volcanic emissions, mining,but industrial activities delivered about 90% of lead into environment, where lead-containing dust particles are significantly polluted the air
as well as soils. (Inglezakis et al., 2003; Barakat, 2011).
Because of their high solubility in the aquatic environments, heavy metals can be absorbed by living organisms. Once they enter the food chain, large concentrations of heavy metals may accumulate in the human body. The accumulation of lead in the human body causes chronic poisoning which include mental retardation to infants and kidney problem to adults
(Kawasaki et al., 2006). Mercury has very tendency of binding
with proteins and it mainly affects the renal and nervous systems. This metal ion is a hazard to public health and the
environment when discharged inappropriately. (Denizli et al.,
2003) In recent years the new promises that nanotechnology offers have spurred the industry to focus their research and investments on developing new applications such as purification of air, water and hazardous waste. In order to detoxify heavy metals various techniques have been employed.
ISSN: 0976-3376
Vol.06, Issue, 12, pp.2139-2150, December,Asian Journal of Science and Technology 2015Available Online at http://www.journalajst.com
ASIAN JOURNAL OF
SCIENCE AND TECHNOLOGY
Article History:
Received 12th September, 2015
Received in revised form 25th October, 2015
Accepted 07th November, 2015
Published online 30th December, 2015
Key words:
FT-IR,
Among these nano-based adsorbents are the more effective technologies for the removal of heavy metal ions from the aqueous system. Application of zinc oxide based nano material composite polymer-resin are more effective for removal of heavy metals contamination from the water because of their important features like high surface area, small size etc. So Nanoparticulates have much larger surface areas than bulk materials and exhibit novel properties due to their small size
(Dlarmendra et al., 2008).
In recent years,variety of nanomaterials such as carbon nanotu
bes (Mohamed Abdel Salam and Robert C.Burk, 2010), TiO2,
(Senthilnathan and Ligy Philip,
2010), magnetic chitosan Nanocomposite (Xiaowang Liu et
al., 2009), magnetic Fe3O4 (Jing-Fu Liu et al., 2007), surface
modified MnFe2O4 (Jing Hu et al., 2005), alumina (Rahmani et
al., 2010) etc., have been investigated for their tendency
towards the removal of toxic metals. Nanosized zinc oxides as an environmental friendly material, ZnO can be used in catalyst industry, gas sensors, solar cells and so on. As an
adsorbent ZnO was mostly applied to eliminate H2S. Recently,
people have found that nanostructured ZnO could efficiently remove heavy metals. Thus, the main objectives of this paper are; i) To determine the physic-chemical characteristics of nanocomposities, ii) To identify the various parameters like pH, initial concentration, contact time and temperature on adsorption capacity of ZnO have been investigated. The adsorption potential of synthesized ZnO nanoparticles in the removal of Pb(II), Hg(II), Cd(II) and Bi(III) ions from aqueous solutions has been studied. Based on these adsorption studies, to analyze the equilibrium uptake capacity of the adsorption process from various adsorption isotherms models like Langmuir, Jovanoic isotherm equation. Finally the adsorption kinetics and thermodynamics of these ions were evaluated.
MATERIALS AND METHODS
Materials
The chemicals used in the present study were Conc. Sulfuric acid (Specific gravity = 1.82), Formaldehyde (37-40% solution) and Phenol (Density=1.057gm-1), Zinc Oxide (30 nm, molecular weight,81.38) was supplied by SRL chemicals,
Mumbai, India. The Mercury(II) Chloride
(HgCl2,M.W.271.50) and lead Nitrate
(Pb(NO3)2,M.W.331.21), Cadmium Nitrate tetra hydrate
(Cd(NO3)2.4H2OM.W.308.47), Bismuth(III) Nitrate
pentahydrate (Bi(NO3)3.5H2OM.W.485.07) was obtained from
RANKEM chemicals New Delhi, India. All the chemicals used were analytical grade. The double distilled (DD) water was used throughout the investigation.
Preparation of nano ZPFR composites
Phenol and Conc. Sulfuric acid (1:1) and 0.5 mg of nano Zinc oxide were mixed slowly with constant stirring in an ice bath. The mixture was then, heated to 70°C for six hours, cooled and kept overnight. The product was polymerized with formaldehyde solution (12.5 ml) in an ice bath, and then heated to 80°C for three hours and the product was cured, then ground washed with DD water, to remove the free acid. Then the sample was dried at 70°C for 16 h. Then the composite
resin were sieved and preserved for characterization and further studies (Kannan and Seenivasan, 2007).
Adsorption experiments
Batch adsorption experiments were carried out by adding certain amount of adsorbent in a set of 250ml conical flasks containing 40ml of metal ion solutions with various initial concentrations, dose, contact time and temperatures in a thermo stated water bath shaker and shaking speed of 200rpm for 1hr. After above treatments the samples were centrifuged to separate the solutions from the adsorbent at 4000rpm for 5mts. Then 1ml of the supernatants was diluted to a suitable concentration and the absorbance of the supernatants solution was measured before and after treatment using atomic absorption (Elico SL-173) spectrometry at wavelength of 283.3,253.7,458,253nm for Pb(II), Hg(II),Cd(II) andBi(III). Each experiments was carried out in twice under identical
conditions and an average value was employed. The PH of the
metal ion solution was adjusted by using NaOH or HCl
solution and a PH meter. The different temperature was carried
out in adsorption studies. This thermodynamic parameter was used to determine the effect of temperature in adsorption studies. The adsorption efficiency and amount of adsorption in batch experiments were calculated as follows:
q = (Co– Ce) V / m ……… (1)
Efficiency (%) = (Co–Ce) / Co ×100 ……….. (2)
Where, Co is the initial concentration (mg/L)
Ce is the equilibrium concentration (mg/L)
V is the volume of solution (mL) m is the mass of adsorbent (g) q is the amount of adsorbed (mg/g)
Desorption experiments
The desorption studies of the adsorbed metal ions from ZnO nanocomposities were carried out by HCl eluent solutions of different concentration and stirred at 200rpm for 12h at room temperature. For regeneration the adsorbent was removed from the solution and rinsed with DD water. The adsorption-desorption cycles were repeated for 3 times to establish the reusability of the adsorbent, the desorption percentage (E) was calculated as follows:
E (%) =CdVd / (Co-Ce) ×100 ……….. (3)
Where, E is the desorption ratio,
Cd is the concentration of the solutes in the desorption
solutions,
Vd is the volume of the desorption solution and
Co, Ce and V are the same as defined above
RESULTS AND DISCUSSION
Effect of adsorbent activity
The activity of adsorbent for the adsorption of Pb (II),Hg (II), Cd(II) and Bi(III) was studied with an initial concentration of 0.01M,adsorbent dose of 0.250 g and contact time of 60 min and the results were shown in (Fig.1) the order of adsorption activity for the removal of all the metal ions was n
PFR > n-ZnO.n-ZPFR composite resin exhibited higher adsorption activity (97.1% ,86.8%,80.9%
compare to other resin . n-ZPFR composite resin had high removal efficiency than PFR and n-ZnO due to more exposed active sites resulted in high removal of metal ion adsorption and high surface area.
Figure 1. Adsorption activity of PFR, n-ZnO, and n
Characterization of the adsorbent
B.E.T: Specific surface area and pore volume analysis
The surface area was calculated by the Brunauer
Teller (BET) equation. The
BET specific surface area was measured on the s instrument through the adsorption of Nitrogen
area of n-ZPFR was 26.4111 m²/g with R2=0.999
pore radius of n-ZPFR was 10.90 Å and total pore volume was 0.11962 cm³/g. As shown in (Fig.2) the isotherm could be classified as IV type isotherm which is characteristics of the
mesoporous materials (Chang et al., 2012).
The porosity and the specific surface area of mposites were investigated through the nitrogen
sorption isotherms.The relative adsorption performance of different adsorbent is highly dependent on the internal pore structure of each material. With the increase of pore radius, more adsorbate is easier to be adsorbed. It is not only able to increase the surface area and average pore radius but also reinforce the chemical strength of adsorbents in acidic medium. It is interesting to note that n-ZPFR composites showed higher surface area compared to other nanocomposites
(Zhao et al., 2011; Zhang et al., 2013; Oh et al
al., 2013; Cheng et al., 2012). Therefore,
offered some attractive advantages.
FTIR
The FT-IR technique was used to monitor changes on the surface of the ordered mesoporous carbon. The FT
were performed in the range of 400 – 4000cm
spectra of the nanoparticles were taken in KBr pressed pellets
2141 Asian Journal of Science and Technology
The activity of adsorbent for the adsorption of Pb (II),Hg (II), Cd(II) and Bi(III) was studied with an initial concentration of 0.01M,adsorbent dose of 0.250 g and contact time of 60 min the order of adsorption ty for the removal of all the metal ions was n-ZPFR > ZPFR composite resin exhibited higher adsorption activity (97.1% ,86.8%,80.9% and 61.2%) than ZPFR composite resin had high due to more exposed active sites resulted in high removal of metal ion adsorption
ZnO, and n-ZPFR
B.E.T: Specific surface area and pore volume analysis
Brunauer- Emmert-
equation. The
the thermal analysi adsorption of Nitrogen. The surface
=0.999. The average and total pore volume the isotherm could be classified as IV type isotherm which is characteristics of the
n-ZPFR nano co nitrogen adsorption/de adsorption performance of different adsorbent is highly dependent on the internal pore ch material. With the increase of pore radius, more adsorbate is easier to be adsorbed. It is not only able to increase the surface area and average pore radius but also reinforce the chemical strength of adsorbents in acidic ZPFR composites showed higher surface area compared to other nanocomposites
et al., 2013; Liu et
carbon activation
IR technique was used to monitor changes on the surface of the ordered mesoporous carbon. The FT-IR spectra
4000cm-1 .The infrared
of the nanoparticles were taken in KBr pressed pellets
on a NEXUS670 infra fourier transform spectrometer Nico Thermo, Waltham. MAI.
Figure 2. Adsorption-desorption isotherm n-ZPFR
The spectra of the ZnO, Hg(II).ZPFR-Cd(II) and
n-(Fig.3). In (Fig.3a). The FT-IR spectra of pure n
sharp peak absorption band observed at 1383.9cm corresponding to stretching vibration.
peaks obtained between 3434.0cm intermolecular H bonds present in sample.
FTIR spectrum of n-ZPFR the broad peak at 3412.0 cm indicated the presence of OH groups on the surface of n ZPFR.
The two characteristic bands at 1642.1 cm due to the corresponding C=C and
vibrations. The another two bands occurred at 1469.8 and
882.2 cm-1 were observed due to the presence of C=C and C
stretching in the aromatic ring.
Pb showed that characteristic band at 3436.3, 1645.4, 1464.8 and 1207.2 cm-1 correspond to the OH groups, C=C stretching, C-H bending vibrations and C
vibrations. The sharp peak at 1032.4 cm
C-O stretching vibrations were involved in Pb(II) ion adsorption respectively. (Fig.3d
showed that characteristic bands at 3394.2, 2923.2, 1642.6 and 1033.4 cm-1 corresponding to OH, =C
stretching vibrations respectively whereas one sharp peak
observed at 1471.0cm-1 corresponding to C
vibrations were involved in Hg(II) ion adsorption. IR data of
n-ZPFR Cd showed that characteristic
35.8 cm-1 correspond to the OH groups,
vibration, C=C stretching vibrations.
There was a sharp band at 1645.4cm
the presence of C=O stretching vibrations were involved in Cd(II) ion adsorption.(Fig.3f)
observed the broad peak at 3435.9cm presence of intermolecular H bonds. FT
Bi(III) showed that characteristic band at
1644.9,1464.5,1032.7cm-1 correspond to the C=O stretching
Asian Journal of Science and Technology Vol.06, Issue, 12, pp.2139-2150, December
fra fourier transform spectrometer Nico-let
desorption isotherms of nitrogen at 77 K on ZPFR
-ZPFR, n-ZPFR-Pb(II),n-ZPFR--ZPFR-Bi(III) were shown in IR spectra of pure n-ZnO displays
sharp peak absorption band observed at 1383.9cm-1
corresponding to stretching vibration. Moreover the broad
peaks obtained between 3434.0cm-1 are due vibration mode of
resent in sample.(Fig.3b) showed the ZPFR the broad peak at 3412.0 cm-1 indicated the presence of OH groups on the surface of
n-The two characteristic bands at 1642.1 cm-1 and 1029.7 cm-1
due to the corresponding C=C and C-O-C stretching vibrations. The another two bands occurred at 1469.8 and were observed due to the presence of C=C and C-H stretching in the aromatic ring.(Fig.3c) FTIR data of n-ZPFR-Pb showed that characteristic band at 3436.3, 1645.4, 1464.8
1 correspond to the OH groups, C=C H bending vibrations and C-O-C stretching
The sharp peak at 1032.4 cm-1 corresponds to the
O stretching vibrations were involved in Pb(II) ion Fig.3d). FTIR data of n-ZPFR-Hg(II) showed that characteristic bands at 3394.2, 2923.2, 1642.6 and 1 corresponding to OH, =C-H, C=O,C=C stretching vibrations respectively whereas one sharp peak corresponding to C-H bending involved in Hg(II) ion adsorption. (Fig:3e)
FT-characteristic band at 3429.6,1465.8,10 correspond to the OH groups, C-H bending vibration, C=C stretching vibrations.
There was a sharp band at 1645.4cm-1 which was the feature of
the presence of C=O stretching vibrations were involved in FT-IR data of n-ZPFR-Bi(III)
observed the broad peak at 3435.9cm-1were attributed the
presence of intermolecular H bonds. FT-IR data of
n-ZPFR-Bi(III) showed that characteristic band at
correspond to the C=O stretching
vibrations, C-H bending vibrations and C=C stretching vibrations were involved in Bi(III) ion adsorption respectively
(Zagorodni et al., 2002).
Figure 3.FTIR spectra of;(a) n-ZnO (b) n-ZPFR (c) n-ZPFR-Pb(II) (d) n-ZPFR-Hg(II) (e) n-ZPFR-Cd(II) (f) n-ZPFR-Bi(III)
XRD
In order to confirm the crystalline nature of ZnO nanoparticles on n-ZPFR composite, XRD pattern has been studied. The characteristic 10˚-60˚ peaks of n-ZPFR were discernible in carbon, the diffraction spectrum of n-ZPFR Pb(II) shows crystalline peak at the scan range 20-50˚ thereby indicating the crystalline phase of n-ZPFR. The XRD pattern was collected
in the 2 theta range from 100 to 800. In (Fig 4a) shows the no
peaks of any other phases are detected from the XRD pattern, which are attributed to the n-ZPFR showed amorphous carbon.In (Fig.4b) shows the XRD pattern of n-ZPFR-Pb(II)
the characteristic diffraction peaks at 2ɵ = 20.8o , 24.5o ,26.6o,
29.6o , 33.1o , 43.7o represent the corresponding indices (120)
(002) (030) (221) (310) (400), respectively (Nata et al., 2010;
Zhang et al., 2011). The peak positions and relative intensities
of the n-ZPFR composite are in good agreement with those from the JCPDS card no PDF ≠ 231496, which reveals the
well-known ortho rhombic structure of Zn2PbO4.The average
crystalline size of n-ZPFR was 8nm.
Figure 4. XRD pattern of free (a) and Pb (II) loaded (b) n-ZPFR
SEM
SEM (Scanning Electron Microscopy) studies provide useful information regarding the surface morphology of the materials
which their records are shown in (Fig.5a) the SEMs of ZPFR, ZPFR-Pb(II), ZPFR-Hg(II), ZPFR-Cd(II) and n-ZPFR-Bi(III) ions. As can be seen the synthesized ZPFR had an approximate spherical shape with a mean diameter of about 1µm.This images illustrate that the ZnO nanoparticles have holes and some small openings on the surface, which increases the contact area and can improve metal ion adsorption.
(Fig.5b,5c 5d and 5e) showed micrographs of the n-ZPFR surface after adsorbed Pb (II) ions, Hg (II) ions, Cd(II) and Bi(III) the surface of n-ZPFR was relatively smoother and less porous because of the formation of a layer over the adsorbent surface after adsorption of metal ions. Decreasing size of the nanoparticles with mole fraction of dopant ions can be
attributed to internal strain of the lattice (24) (Sankar et al;
2013).
Figure 5. SEM images of (a) ZPFR (b) ZPFR-Pb (II) (c) n-ZPFR-Hg (II) d) n- ZPFR-Cd (II) e) n- ZPFR- Bi (III).
EDX
Further confirmation of the adsorption of Pb(II),Hg(II),Cd(II) and Bi(III) on n-ZPFR composite was done by energy dispersive X-ray analysis (EDS). (Fig.6a) for the unloaded n-ZPFR, did not show any characteristic signal for metal ions, but only showed for the four major constituents, i.e., C, O, Zn and S. Whereas for Pb (II), Hg(II), Cd(II) and Bi(III) loaded (Fig.6b 6c 6d and 6e) signals of presence of Pb(II), Hg(II), Cd(II) and Bi(III) were observed. This showed the diffusion or accumulation of metal ions onto the surface of n-ZPFR (25)
TGA/DTA Analysis
The TGA thermo grams for the n-ZPFR samples were shown in (Fig.7a). The thermo gravimetric profile revealed that the mass loss occurs in three stages (26).
Figure 6. Energy dispersive spectra of a) n-ZPFR b) n-ZPFR-Pb(II) c) n-ZPFR-Hg(II) d) n- ZPFR-Cd(II)
The first weight loss about 95.4% in that temperature range 100-110°C, which may be the combined water existed in n-ZPFR composite. The second weight loss occurred in the temperature range 300-350°C, a typically high enough temperature to induce thermal degradation of ordinary carbon polymers which about 75.6%. The final weight loss was determined above 600-700°C, which about 56.9%. Finally, no mass loss was detected when the temperature was increased to 750ºC. This result indicated that the n-ZPFR are stable at higher temperature. The char residue of n-ZPFR content was 33.6%.The characterization results confirmed that the formation of the adsorbent n-ZPFR occurred successfully.In (Fig.7b) shows the loss of water and n-ZPFR composite was evidenced by endothermic peak was obtained.Two sharp peak indicates the chemical changes occurring due to thermal
degradation of the n-ZPFR composite.At 560oc , the presence
of one broad peak indicate the dehydration of n-ZPFR (27)
(Thongnopkum et al., 2012).
Figure 7. TGA (a) and DTA curve (b) of n-ZPFR
TEM
The morphology and size of nanoparticles were studied by transmission electron microscopy (TEM). The image revealed that the particle size of the composite was 10nm (Fig.8a and Fig8b).
Figure.8 TEM images of free (a) and Pb (II) loaded n-ZPFR.
Electron diffraction analysis
The electron diffraction patterns of ZnO nanoparticles and n-ZPFR composite (Fig.9a and Fig 9b) were studied. The fringe ring pattern clearly indicated the amorphous nature of the zinc oxide nanoparticles. The fused ring pattern revealed the crystalline nature of the n-ZPFR composite.
Figure 9. Electron diffraction of a) n-ZPFR b) n-ZPFR-Pb(II)
Effect of initial concentrations of heavy metal ions
The adsorption capacity is dependent on the initial metal ion concentration. The dependence of adsorption capacity of ZnO nanoparticles was studied at different initial metal ion concentrations in the range of 20-60 mg/L at 298 K with 0.250 g n-ZPFR at 60 min. The percentage of Pb (II), Hg (II), Cd(II) and Bi(III)ions adsorption at different metal concentrations using n-ZPFR, decreased with increase in metal ion concentration. This may be due to saturation of active adsorption sites onto n-ZPFR. The effect of initial concentration on the removal of Pb (II), Hg (II), Cd(II) and Bi(III) by the adsorbent was indicated in (Fig.10) (28)
Effect of contact time on adsorption
The effect of contact time on metal ion adsorption is shown in (Fig.11). The adsorption capacity of Pb(II), Hg(II), Cd(II) and Bi(III) adsorption increased with increasing the contact time, the maximum removal of all the metal ions occurred at 60 min, after which there were no significant changes. Hence in the present study 60min was chosen as the equilibrium time.
Figure.10.Effect of initial concentration on the removal of Pb(II), Hg(II), Cd(II) and Bi(III) from aqueous solution
The adsorption rate was fast and the maximum adsorption was achieved almost within 60min for all the metal ions. Because of the availability of more active sites and more functional groups which participate in the metal ions uptake till equilibrium is attained and thereafter, there was no further adsorption. The contact time is one of the important parameter s for economical wastewater treatment application. (Smiciklas
et al., 2008).
Figure.11. Effect of contact time on the removal of Pb(II), Hg(II), Cd(II) and Bi(III) from aqueous solution.
Effect of adsorbent mass
The effect of adsorbent dosage on Pb(II), Hg(II), Cd(II) and Bi(III) removal was studied by varying the amount n-ZPFR between 0.050-0.250g. The increased metal ion removal percentage at increasing adsorbent dosage is due to increased active sites and surface area for adsorption at higher adsorbent dosage. That is, the percentage removal increased from 45.9% to 97.1% for lead, mercury was increased from 37.9% to 86.8%, Cadmium increased from 35.1% to 80.9% and Bismuth
increased from 21.4% to 61.2% as the n-ZPFR adsorbent were shown in (Fig:12).The optimum adsorbent dosage was found to be 0.250 g for Pb(II),Hg(II),Cd(II) and Bi(III). The adsorption efficiency of Pb(II),Hg(II),Cd(II) and Bi(III) was observed at 97.1% ,86.8%,80.9% and 61.2% respectively (30).
Figure.12.Effect of adsorbent dosage on percentage removal of Pb(II), Hg(II), Cd(II) and Bi(III) onto n-ZPFR
Adsorption isotherms
Adsorption isotherms is the most important design can be used
to explained the interactions between adsorbents
and adsorbates, as well as the adsorption capacity of adsorbents. The adsorption isotherm shows how the adsorbate molecules are distributed between the liquid phase and solid phase. The analysis of the isotherm data by fitting them to different isotherm model is an important step to find the suitable model that can be used for design purposes. The correlation of equilibrium data is essential for practical design and operation of adsorption systems.
The Langmuir isotherm which has been successfully applied to many sorption processes can be used to explain the sorption of metal ions. Langmuir model (31) assumes that the uptake of Pb (II), Hg(II), Cd(II) and Bi(III) ions occurs on a homogeneous surface by monolayer adsorption without any interaction between adsorbed ions. Isotherms are the equilibrium relations between the concentration of adsorbate on the solid phase and its concentration in the liquid phase. From the isotherms the maximum adsorption capacity can be obtained. These data provide information on the capacity of the sorbent or the amount required to remove a unit mass of pollutant under the system conditions. Data has been subjected to different adsorption isotherms. The Langmuir (32) parameters can be used to predict affinity between the adsorbate and the adsorbent using the dimensionless constant
separation factor (RL), given by equation
RL = 1/1+bC0 ………. (4)
Where RL is the dimensionless separation factor,C0 is the
initial concentration of the adsorbate (mg L-1),and b is the
The RL can be used to verify that the adsorption in the system
studied is unfavorable (RL less than 1), linear (RL=1).
Favorable (0 less than RL less than 1),or irreversible
(RL=0).The value of RL decreased with an increase in the
initial concentration, says that the adsorption is more favorable at high concentration shows the equilibrium isotherms data as points for the adsorption of Pb(II), Hg(II), Cd(II) and Bi(III) ions by ZnO nanoparticles. These isotherm data have been analyzed for the Langmuir and Freundlich isotherms by linear method of analysis.
The linear form of Langmuir isotherm is given by:
Ce/qe = 1/KL × qm + Ce/qm ……… (5)
Where, qm is the maximum adsorption capacity, KL is the
Langmuir bonding energy coefficient. The KL and qm can be
calculated from the intercept and slope of the linear plot of
Ce/qe against Ce shown in (Fig.13).
The Freundlich model is the earliest known empirical equation and is shown to be consistent with exponential distribution of active centers, characteristic of heterogeneous surfaces. The linear form as follows:
logqe = log KF + 1/n log Ce ……… (6)
Where, ‘KF ’ and ‘n’ are the Freundlich isotherm constants
indicating the adsorption capacity and adsorption
intensity,(33,34) respectively. The KF and n can be calculated
from the intercept and slope of the linear plot of log qe against log Ce. The value of n >1 is favorable and heterogeneous adsorption for all metal ions (35). All the metals did not follow the Freundlich isotherm as closely as the Langmuir isotherm. Temkin isotherm models assume that the heat of adsorption for all the molecules in the layer decreases linearly with coverage due to adsorbent-adsorbate interactions. The data were analyzed according tothe linear form of the Temkin model.
qe = B1 ln KT + B1 ln Ce ……… (7)
The isotherm constants B1 and KT are related to the maximum
binding energy and heat of adsorption. The B1and KT can be
calculated from the intercept and slope of the linear plot of qe against ln Ce. The Freundlich and Langmuir isotherm models could not elucidate clearly the type of biosorption behavior (physical or chemical).
Dubinin-Kaganer- Radushkevich (DKR) isotherm model DKR model (36,37) is significant for calculating the apparent energy of adsorption, which predicts the type of adsorption i.e. physisorption or chemisorption. The model can be represented as (Dubinin and Radushkevich, 1947) :
ln qe = lnqm – βƐ2 ……….. (8)
Where, β a constant related to the adsorption energy (mol2/kJ2), qm is a constant that indicates the sorption degree characterizing the sorbent (mg/g) and ε is the Polanyi potential shown in Eq.8:
Figure 13. Langmuir isotherm plots for the adsorption of Pb (II), Hg (II), Cd (II) and Bi (III) onto n-ZPFR
ε = RT ln (1+1/Ce) ………….. (9)
where Ɛ = RT ln (1+1/Ce) is polanyi potential. The plot of ln qe
vs Ɛ2 yielded a straight line, thereby confirming the
applicability of the model (Fig.14). The value of β was calculated from the slope of the plot which was used to
calculate the adsorption energy, E (= 1/(2β)1/2).
Figure 14. DKR adsorption isotherm models for adsorption of Pb (II), Hg (II), Cd (II) and Bi (III) onto n-ZPFR composite
The biosorption type based on the D-R model can be expressed by the mean free energy (kJ/mol) employing Eq.10:
E = 1/ (2β) ½ ………. (10)
E values are useful in estimating the type of adsorption. The mean free energy of adsorption for the present study was found to be energy values for the adsorption of Pb(II), Hg(II), Cd(II), and Bi(III) in the range 0.08002 KJ/mol to 0.42697 KJ/mol indicate a physical adsorption.
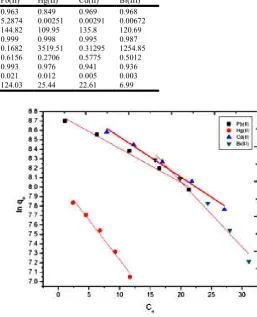
The Jovanoic isotherm (Jovanoic, 1969), which is based on the same assumptions of the Langmuir isotherm, also considers the possibility of some mechanical contacts between the adsorbing and desorbing molecules on the homogeneous surface and can be represented in a linear form as follows:
lnqe = ln qm + KJ Ce ………. (11)
Where, qmis the maximum amount adsorbed (in mg/g) and KJ
(in L/mg) is the constant related to the energy of adsorption. The qm and KJ can be calculated from the intercept and slope of the linear plot of ln qe against Ce (Fig.15). To understand the adsorption equilibrium behavior, five isotherms, namely Langmuir, Freundlich, Temkin, D-R and Jovanoic isotherm
models were tested and the Table 1 summarized the isotherm
parameter values. The best fitted models were selected on the basis of coefficient Jovanoic isotherm and D-R isotherm model. The Jovanoic isotherms were best fit model for the adsorption of Pb(II), Hg(II), Cd(II) and Bi(III) onto n-ZPFR.
Kinetic modeling
In order to explain the mechanism and to determine the rate controlling step of adsorption for Pb(II), Hg(II), Cd(II) and Bi(III) onto n-ZPFR, kinetic models were used. The rate constants were calculated by using pseudo-first-order and pseudo-second-order kinetic models and the rate controlling step was described by intra-particle diffusion model and the Table 2 summarized the kinetic parameter values.
Pseudo-first-order model
The pseudo-first-order kinetic model (Lagergren, 1898;
Smiciklas et al., 2008) has been widely used to predict
sorption kinetics. The equation of the model was represented as follows:
Figure 15. Jovanoic Isotherm plots for the adsorption of Pb (II), Hg (II), Cd (II) and Bi (III) onto n-ZPFR
ln(qe-qt) = lnqe-k1t ……… (12)
where qe is the amount of metal ions adsorbed per unit weight
of adsorbent at equilibrium ie; adsorption capacity (mg/g) ,q is
the amount of adsorbent adsorbed (mg/g) at any time t and k1
is the rate constant. The value of k1 was calculated from the
slope of the linear plot of ln (qe-qt) versus t.
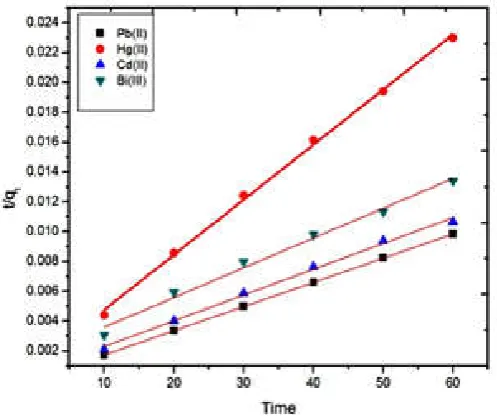
Pseudo-second-order rate model
The linear form of pseudo-order kinetic model (41) was expressed by equation
Table 1. Different adsorption isotherm model parameters for the adsorption of Pb(II), Hg(II), Cd(II) and Bi(III) on n-ZPFR
Mathematical Models Parameters Pb(II) Hg(II) Cd(II) Bi(III)
Langmuir isotherm R2 0.955 0.949 0.944 0.91
KL 3.4772 9.7033 5.1228 0.00118
qm(mg/g) 0.2875 0.1030 0.1952 847.457
Freundlich isotherm R2 0.786 0.889 0.916 0.941
KF 6362 2172 9772 3.9810
N 4.6511 2.1231 1.5649 0.6540
Temkin isotherm R2 0.860 0.946 0.969 0.991
B1 963.1 851.61 2401 3849.7
KT 6393.3 3389.6 1051.6 1470.1
D-R isotherm R2 0.915 0.952 0.953 0.996
Β 1.93813E-5 7.76598E-5 8.38598E-5 1.17103E-4
qm(mg/g) 4988.7 1710.2 3790.6 3455.7
E kJ/mol 2579.8 643.8 596.2 426.9
Jovanoic isotherm R2 0.989 0.986 0.986 0.977
KJ(L/mg) 0.035 0.084 0.042 0.069
qm(mg/g) 8.768 8.074 8.957 9.438
Table 2. Kinetics parameters for the adsorption of Pb(II), Hg(II), Cd(II) and Bi(III) on n-ZPFR
Mathematical models Parameters Pb(II) Hg(II) Cd(II) Bi(III)
First-order kinetics R2 0.963 0.849 0.969 0.968
K1 (min-1) 5.2874 0.00251 0.00291 0.00672
qe (mg/g) 144.82 109.95 135.8 120.69
Second-order kinetics R2 0.999 0.998 0.995 0.987
K2 g/mg/min 0.1682 3519.51 0.31295 1254.85
qe(mg/g) 0.6156 0.2706 0.5775 0.5012
Intra-particle diffusion R2 0.993 0.976 0.941 0.936
Kid g/mg/min1/2 0.021 0.012 0.005 0.003
t/qt =1/k2×qe2 + t/qe ……… (13)
Where k2 (g/mg/min) is the second-order rate constant of
adsorption. The plot of t/qt versus t shows a linear form. The
equilibrium adsorption capacity qe and the values of k2 were
calculated from the intercept and slope of the plot represented in (Fig.16)
Figure 16. Pseudo-second order kinetic plots for adsorption of Pb (II), Hg (II), Cd (II) and Bi (III) onto n-ZPFR
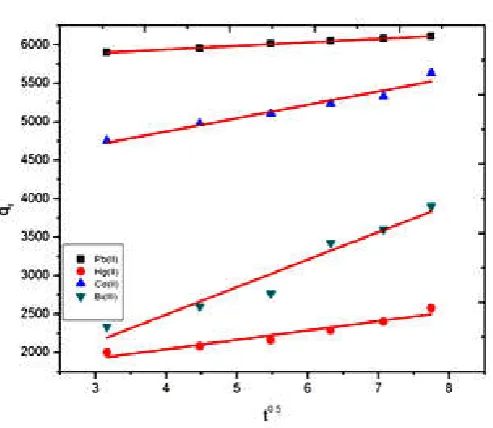
Intra-particle diffusion model
The overall reaction kinetics for the adsorption of Pb(II), Hg(II), Cd(II) and Bi(III) is a pseudo-second order process. However this could not highlight on the rate-limiting step.The rate-limiting step (slowest step of the reaction) may be either the boundary layer (film) or the intra-particle (pore) diffusion of solute on the solid surface from bulk of the solution in a batch process (Fig.17). The intra-particle diffusion model proposed by Weber and Morris (Weber and Morris, 1964; Weber and Morrism, 1964; Weber and Morris, 1963; Sairam
Sundaram et al., 2008) was used to identify the mechanism
involved in the adsorption process:
qt =kidt0.5 + c ………. (14)
where qt is adsorption capacity at any time t and kid is the
intra-particle diffusion rate constant (mg g-1 min -0.5) and C
(mg/g) reflects the boundary layer effect. Greater the value of C greater is the effect of boundary layer on adsorption process. If the rate limiting step be the intra-particle diffusion, the plot
of qt against the square root of time should be a straight line
and pass through the origin. The deviation of the plot from the linearity indicates the rate-limiting step should be boundary layer (film) diffusion controlled.
The kid and C can be determined from the slope and intercept
of the linear plot of qt against t0.5The pseudo-first order.
pseudo-second order and intra-particle diffusion models were used to understand the kinetic nature of Pb(II), Hg(II), Cd(II) and Bi(III) onto n-ZPFR adsorption system. All the experimental data showed better agreement with pseudo-second order model in terms of higher correlation coefficient
value (R2>1), which suggested the adsorption rate of Pb(II),
Hg(II), Cd(II) and Bi(III) onto n-ZPFR might be controlled by chemisorptions mechanism. The rate controlling step consisted valence forces through sharing or exchange of electrons between the adsorbent surface and adsorbate ions and no involvement of mass transfer in solution (46). The value of
pseudo-second-order rate constant ,k2,was 0.168 g/mg/min for
Pb(II), 3519.51 g/mg/min for Hg(II), 0.31295g/mg/min for Cd(II) and 1254.85g/mg/min for Bi(III).
Figure 17. Intra-particle diffusion
Effect of temperature and Thermodynamics Data
The adsorption of metal ions were studied at three different temperatures at 308k,318k and 328k,respectively.For kinetic studies, a series of 250ml flask were used and each flask was filled with n-ZPFR at mass loadings 0.250g for all the metal ions solution at 0.01M.The percentage removal of all the metal ions are shown in (Fig.18).
This indicates that the adsorption of metal ions on n-ZPFR is endothermic in nature. The increase in the rate of adsorption with the increase in temperature may be attributed to the strong adsorptive forces between the active sites of the adsorbents and adsorbate species and also between the adjacent molecules of the adsorbed phases. Thermodynamic
parameters, such as change in enthalpy (∆H0), change in
entropy (∆S0) and change in free energy (∆G0),were
determined using the following equations (Biswas et al., 2007;
Ahmet Sari et al., 2007).
KL= qe/ce ……….. (15)
Where KL is the Langmuir constants; Ce is the concentration of
solute adsorbed on the resin at equilibrium, mg/L.
∆G0 = -RTlnKL ……….. (16)
The ∆H0 and ∆S0 were obtained from the slope and intercept of
van’t Hoff plot of ln KL versus 1/T plot shown in (Fig.19),
according to the following equation:
ln KL = ∆S0/R -∆H0/RT ………. (17)
Figure 18. Effect of Temperature
Where, R is the gas constant (8.314 J/mol K),T is the temperature in Kelvin. The values of these parameters thus calculated are recorded in Table 3.The correlation coefficient for the linear plot for Pb(II), Hg(II), Cd(II) and Bi(III) was
R2=0.999, R2 =0.999, R2 =0.999 and R2 =0.812.The positive
values of standard enthalpy change (∆H0) for the intervals of
temperatures showed the endothermic in nature of the
adsorption process. The low enthalpy values of ∆H0 less than
20kJ/mol indicates that the physisorption is involved in the process of adsorption. The positive value of entropy change
∆S0 corresponds to a increase in degree of freedom of the
adsorbed species and thereby increase in concentration of adsorbate in solid-solution interface which takes place through ion exchange interactions (Malkoc and Nuhoglu, 2007).
The negative values of ∆G0 at all temperatures indicated the
spontaneous nature of the adsorption of Pb(II), Hg(II), Cd(II) and Bi(III).It indicated that the adsorption efficiency of all metal ions onto ZnO nanoparticles increases with increases in temperature, this trend to be assigned to the dissolution of ZnO
nanoparticles at higher temperatures (Mustafa et al., 2002).
The negative values of ∆G0 confirm the feasibility of the
process at all temperatures and the spontaneous nature of adsorption with a high preference for Pb(II) compared to Hg(II),Cd(II) and Bi(III) onto n- ZPFR.
Table 3. Thermodynamic parameters for the adsorption of Pb(II), Hg(II), Cd(II) and Bi(III) onto n-ZPFR
Metal ions R2 ∆H0 ∆S0 -∆G0 (KJ/mol)
308K 318K 328K
Pb(II) 0.999 42.33 197.13 -65.88 -81.90 -97.65
Hg(II) 0.999 52.42 218.11 -29.57 -47.64 -65.53
Cd(II) 0.999 53.33 220.22 -26.95 -45.46 -63.32
Bi(III) 0.812 28.85 138.29 -21.06 -26.10 -41.27
Desorption Studies
Desorption studies of the adsorbed metal ions from n-ZPFR composites was carried out by HCl solution at room temperature. Desorption percentage was calculated as follow;
Desorption (%) = Ce1 V/qm × 100 % …………. (18)
Figure 19. van’t Hoff plots of lnKL versus 1/T for the adsorption
of Pb (II),Hg (II), Cd (II)and Bi (III)
Where q is the adsorption capacity (mg/g), m is the mass of the adsorbent (mg), V is the volume of the aqueous solution
(ml), Ce1 is the concentration of metal ions aqueous solution
after desorbed from the adsorbent. For regeneration, the adsorbent was removed from the solution and rinsed with DD water. The adsorption–desorption cycles were repeated for 5 times, and desorption percentage was calculated. The results showed that the elution ratio is different under various eluent concentrations. Maximum recovery of Pb (II), Hg(II), Cd(II) and Bi(III) at 100%, was achieved with 2 and 3M HCl eluent solutions, respectively. Recovery and recyclability of adsorbents in aqueous reaction system are regarded as a crucial property in the purification systems of wastewater.
Conclusion
The main objectives of this paper are to identify the various parameters that affect the adsorption, such as adsorbent dose,
initial concentration, contact time, temperature and PH .To
analyze the equilibrium uptake capacity of the adsorption process from various adsorption isotherms models like D-R, Jovanoic isotherm equation. Present study reported the mechanism of adsorption of Pb (II), Hg(II), Cd(II) and Bi(III) onto nano ZPFR prepared via polymerization method. The D-R and Jovanoic model provided the best fit for the Pb(II), Hg (II) ion, Cd(II) and Bi(III) revealing the maximum adsorption capacity of Pb(II) 8.768 mg/g and Hg(II) 8.074 mg/g respectively.
The lower values of RL and n < 1 indicated that the adsorption
Acknowledgement
The authors wish to acknowledge the management and Department of Chemistry, Thiagarajar College, Madurai-9, for providing lab facilities.
REFERENCES
Ahmet Sari, Mustafa Tuzen , Demirhan Citak, Mustafa Soylak 2007. Equilibrium, Kinetics and thermodynamic studies of adsorption of Pb(II) from aqueous solution onto Turkish
Kaolinite clay, Journal of Hazardous Materials,
149:283-291.
Barakat, M.A. 2011. New trends in removing heavy metals
from industrial wastewater. Arabian Journal of Chemistry,
4: 361-377.
Biswas, K., Saha, S.K. and Ghosh, V.C. 2007. Adsorption of fluoride from aqueous solution by a synthetic iron (III)
aluminum(III) mixed oxide. Ind. Eng. Chem. Res., 46:
5346- 5356.
Bonner, O., Easterling, G., Weit, D. and Holland, V. 1955. Osmotic and activity coefficients of P-toluene sulfonic acid and p-ethyl benzene sulfonic acid and their relationship to
ion exchange equilibria, J. Am. chem. Soc., 77:242-244.
Chang, B.S., Zhang, X.R., Guo, J., Sun, Y, Tang. H.Y., Ren. Q.G. and Yang, W.L. 2012. General one-pot strategy to prepare multifunctional nanocomposites with hydrophilic colloidal nanoparticles core/mesoporous silica shell
structure, J. Colloid Inter-face Sci., 377:64-75.
Cheng, K., Zhou, Y.M., Sun, Z.Y., Hu, H.B., Zhong, H., Kong. X.K. and Chen, Q.W. 2012. Synthesis of
carbon-coated, porous and water-dispersive Fe3O4 nanocapsules
and their excellent performance for heavy metal removal applications, Dalton Trans., 41:5854-5861.
Denizli, A., Senal, S., Alsancak, G., Tuzmen, N. and Say, R. 2003. Mercury removal from sunthetic solutions using poly (2-hydroxyethylmethacrylate) gel beads modified with Poly (ethyleneamine). Reactive and Functional polymers 55: 121-130.
Dlarmendra, K. Tiwari, Behari, J. and Prasenjit Sen, 2008. Application of nanomaterials in wastewater treatment.
World Applications science Journal, 3: 417-433.
Dubinin, M. and Radushkevich, M.L.V. 1947. The equation of the characteristic curve of activated charcoal. Dokl. Akad. Nauk SSSR 55:327-329.
Febrianto, J., Kosasih, A.N., Sunarso, J., Ju, Y.H., Indraswati,
N., et al. 2009. Equilibrium and kinetic studies in
adsorption of heavy metals using biosorbent: a summary of
recent studies. J. Hazard Mater, 162: 616-645.
Foo, K.Y. and Hameed, B.H. 2010. Insights into the modeling
of adsorption isotherm systems. J. Chem. Eng., 156: 2-10.
Fujita, M., lde, Y., Sato, D. et al. 2014. Heavy metal
contamination of coastal lagoon sediments. Fongafale islet,
Funafuti atoll, tuvalu, Chemosphere, 95: 628–634.
Hall, K.R., Eagleton, L.C., Acrivos, A. and Vermevlen, T. 1966. Pore and Solid diffusion kinetics in fixed bed
adsorption under constant pattern conditions. Indian
Engineering and chemistry Fundamentals, 5: 212-219.
Ho, Y.S., Mckay G. Wase, and Forster, C.F. 1963. Study of the adsorption of divalent metal ions onto peat, Adsorption
science and Technology Am Soc Civ Eng., 89: 31-60.
Inglezakis, V.J., Loizidou, M.D. and Grigoropoulou, H.P.
2003. Ion exchange of Pb(2+) Cu(2+) Fe(3+) and Cr(3+) on
natural clinoptilolite: selectivity determination and
influence of acidity on metal uptake. J. Colloid Interface
Sci., 261: 49-54.
Jing Hu, M.C. Irene and Guohua Chen, 2005. Fast removal and recovery of Cr (VI) using surface- modified jacobsite
(MnFe2O4) nanoparticles, Langmuir, 21:11173-11179.
Jing-Fu Liu, Zond-Shan Zhao, Gui-Bin Jiang and Coating
2007. Fe2O4 magnetic nanoparticles with humic acid for
high efficient removal of heavy metals in water,
Environmental science and Technology, 42:6949-6954.
Jovanoic, D.S. 1969. Physical adsorption of gases I. Colloid and Polymer science 235l: 1203-1214.
Kannan, N. and Seenivasan, R.K. 2007. Synthesis and studies of phenol-formaldehyde cationic exchangers blended with sulphonated Eugenia jambolana, lam, Carbon, Desaline, com, 216:77-87.
Kannan, N., Mukunthan, K.S. and Balaji, S. 2011. A comparative study of morphology, reactivity and stability of synthesized silver nanoparticles using bacillus subtilis and catharanthus roseus (L.) G. Don. colloids surf B 86:378-383.
Kawasaki, N., Bun-el, R., Ogata, F., Nakamura, T., Tanei, S.,
et al. 2006. Water treatment technology using
carbonaceous materials produced from vegetable biomass,
Journal of water and Environmental Technology, 4: 73-82.
Lagergren, S. 1898. About the theory of so-called adsorption of soluble substance, K. Svenska Vetenskapsakad Handl 24: 1-39.
Langmuir, I. 1918. The adsorption of gases on plane surfaces
of glass, mica and platinum, Journal of American chemical
society, 40: 1361-1403.
Liu, J.W., Cheng, J., Che, R.C., Xu, J.J., Liu, M.M. and Liu, Z.W. 2013. Double-shelled yolk-shell microspheres with
Fe3O4 cores and SnO2 double shells as high –performance
microwave adsorbers, J. Phys. Chem., C 117, 489-495.
Malkoc, E. and Nuhoglu, Y. 2007. Determination of kinetic and equilibrium parameter of the batch adsorption of
Quercus itnaburensis. Chemical Engineering Process, 46:
1020-1029.
Mckay, Y.S.G. 1999. Pseudo-second order model for sorption
processes. Proc. Biochem. 34:451-465.
Mohamed Abdel Salam and Robert C. Burk, 2010.
Thermodynamics and kinetics studies of
pentachlorophenol adsorption from aqueous solutions by multi-walled carbon nanotubes, water, air, and soil pollution 210:101-111.
Mustafa, S., Shahida, P. Naeem, A. Dilara, B. and Rehana, N. 2002. Sorption studies of divalent metal ions on ZnO. Langmuir 18:2254-2259.
Nata, I.F., Salim, G.W. and Lee, C.K. 2010. Facile Preparation
of magnetic carbonaceous nanoparticles for Pb2+ ions
removal, J. Hazard.Mater, 183:853-858.
Ngah, W.S.W., Endud, C.S. and Mayanar, R. 2002. Removal of copper (II) ions from aqueous solution onto chitosan and
cross-linked Chitosan beads. React Funct Polym., 50:
181-190.
Oh, H.D. Kim, S.O. Lee, J.K. and Lee, S.W. 2013. Facile
synthesis of carbon layer-entangled Fe3O4 clusters as anode
materials for improved Li-ion batteries, J. Power sources,
244 (2013) 575-580.
Ozsoy, H.D., Kumbur, H., Saha, B. and Leeuwen, J.H.W. 2008. Rhizopus oligosporus produced from food processing wastewater as a biorsorbent for cu(II) ions
removal from the aqueous solutions, Journal of
Bioresource Technology, 99:4943-4948.
Rahmani, A., Zavvar, H., Mousavi, M. and Fazli, 2010. Effect of nanostructure alumina on adsorption of heavy metals, Desalination 253:94-100.
Sairam Sundaram, C., Natrayasamy Viswanathan and Meenakshi, S. 2008. Deflorination chemistry of synthetic hydroxyapatite at nano scale: equilibrium and kinetic
studies, Journal of Hazardous Materials, 155:206-215.
Sankar, R., Karthick, A., Prabu. A, Karthick. S, Subramanian. K. and Ravikumar, V. 2013. Origanum vulgare mediated biosynthesis of silver nanoparticles for its antibacterial and anticancer activity, colloids surf B, 108:80-84.
Schwarzenbach, R.P., Egli, T., Hofstetter, T.B., Von Gunten,
U. and Wehrli, B. et al. 2010. Global water pollution and
human health. Annual Review of Environment and
Resources, 35: 109–136.
Senthilnathan J. Ligy Philip, 2010. Removal of mixed pesticides from drinking water system using surfactant
assisted Nano-TiO2 , water, Air, and soil pollution,
210:143-154.
Smiciklas, I., Onjia, A., Raicevic, S., Janackovic, D., Metric, M. 2008. Factors influencing the removal of divalent
cations by hydroxyapatite, Journal of Hazardous
Materials, 152:876-884.
Smiciklas, L., Onjia, A., Raicevic, S., Janackovic, D. and Metric, M. 2008. Factors influencing the removal of
divalent cations by hydroxyapatite, J. Hazard. Mater, 152:
876-884.-
Srivastava, S.K., Bhattacharjee, G., Tyagi, R., Pant, N. and Paul, N. 1988. Studies on the removal of some toxic metal ions from aqueous solutions and industrial waste, Part I (Removal of lead and cadmiumby hydrous ion and
aluminium oxide), Environ Technol Lett., 9:1173-1185.
Thongnopkun, P., Jamkratoke, M. and Ekgasit, S. 2012. Thermal behavior of nanosilver clay in the application of
handmade jewelry, Mater. Sci. Eng., 556:849-854.
Weber, Jr W.J., Morris, J.C. 1963. Kinetic of adsorption on
carbon from solution. J. Sanit Eng Div Am Soc Civ Eng.,
89: 31-60.
Weber, W.J. and Morris, J.C. 1964. Equilibria and capacities
for adsorption on carbon, Journal of the sanitary
Engineering Division, 90:79-107.
Weber, W.J., Morris, 1964. Advances in water pollution research. Pergamon Press. Oxford.
Xiaowang Liu, Oiyan Hu, Zhen fang, Xiaojur, Zhang and Beibei Zhang, 2009. Magnetic chitosan nanocomposites: a useful recyclable tool for heavy metal ion removal, Langmuir, 25:3-8.
Xue-Song Wang, Juan Huang, Huai-Qiong Hu,
JingWang,Yong Qin, 2007. Determination of Kinetic and equilibrium parameters of the batch adsorption of Ni(II) from aqueous solution by Na-mordenite, Journal of Hazardous Materials 142:468-476.
Zagorodni, A.A. Kotova, D.L. and Selemenev, V.F. 2002. Infrared spectroscopy of ion exchange resins; chemical
deterioration of resins, Reac. Func, Poly., 53:157-171.
Zhang, X.F., Wang, J., Li. R.M, Dai. Q.H, Gao. R, Liu. Q,
Zhang. M.L. 2013. Preparation of Fe3O4@Layered double
hydroxide composite for magnetic separation of uranium,
Ind. Eng. Chem. Res., 52:10152-10159.
Zhang, Y.F., Liu, X.H., Nie, J.R., Yu, L., Zhong, Y.L. and
Huang, C. 2011. Improve the catalytic activity of α-Fe2O3
particles in decomposition of ammonium perchlorate by
coating amorphous carbon on their surface, J. Solid state
chem., 184:387-390.
Zhao, G.H., Wang, J.Z. Li, Y.F., Chen, X. and Liu, Y.P. 2011.
Enzymes immobilized on super paramagnetic
Fe3O4@Clays nanocomposites: preparation,
characterization, and a new strategy for the regeneration of
supports, J. Phys. Chem., C 115:6350-6359.