Scientia
Pharmaceutica
Article
The Optimization of Gel Preparations Using the
Active Compounds of Arabica Co
ff
ee Ground
Nanoparticles
Salfauqi Nurman1,* , Ruka Yulia2, Irmayanti1, Erliza Noor3and Titi Candra Sunarti3
1 Department of Agricultural Industrial Engineering, Faculty of Agricultural Technology, Universitas Serambi
Mekkah, Banda Aceh 23245, Indonesia; [email protected]
2 Department of Food Technology, Faculty of Agricultural Technology, Universitas Serambi Mekkah, Banda
Aceh 23245, Indonesia; [email protected]
3 Department of Agricultural Industrial Technology, Faculty of Agricultural Technology, Bogor Agricultural
Institute, Bogor 16680, Indonesia; [email protected] (E.N.); [email protected] (T.C.S.)
* Correspondence: [email protected]; Tel.:+62-85374520342
Received: 27 August 2019; Accepted: 13 November 2019; Published: 19 November 2019
Abstract: Arabica coffee (Coffea arabica L.) ground nanoparticles contain phenolics compounds
that have anti-inflammatory effects, so they can be used as sources of active compounds in
anti-inflammatory gel preparations. This study aims to determine the optimum formulation of
anti-inflammatory gel preparations using Arabica coffee ground nanoparticles as active compounds.
Treatment optimization was performed using a Response Surface Methodology according to the Box-Behnken Design with a quadratic model in the Design Expert Version 10.0.3.0 software. In this study we used three factors (x): carbopol 940, triethanolamine (TEA), and nanoparticles, each of which consists of three levels, the response (y) observed including the acidity degree (pH), spreadability, viscosity and total phenolic content. ANOVA analysis results show that the quadratic model is very appropriate since it produces a high R2 value and a low PRESS value for all responses, as well as
significant p-values (<0.0500) and an insignificant lack of Fit values (p-value>5%). The optimum
formulations for the gel preparations of the Arabica coffee ground nanoparticles obtained in this
study are carbopol 940 (0.569%), TEA (0.468%), and nanoparticles (3.000%), which have values w/o an
interval (0.994) and a desirable (0.981) response to acidity (5.212), spreadability (5.850 cm), viscosity
(3734.244 cps) and total phenolic content (669.227µgGAE/g).
Keywords: formulation; Box-Behnken; nanogel
1. Introduction
Nanotechnology is a new breakthrough in the world of technology, especially in the use of
nano-sized materials [1] to produce extraordinary new properties. Nanotechnology has been widely
developed in various fields including industry, agriculture [2], packaging [3], food and beverages [4],
and health [5,6].
Nanotechnology is growing rapidly in the health sector, especially in the development of
pharmaceutical preparations and medicines [7]. Nano technology has been used in recent years to
produce nanoparticles as drug carriers [8], as well as active drug substances [9]. Nano-sized active
drugs haves the ability to pass through cell walls and membranes to reach the target cell [5,10].
In addition, nano-sized particle also have the ability to dissolve and possess a high absorption efficiency,
so materials at a nanoscale size have become very popular [6].
Arabica coffee ground nanoparticles are one example of the use of nano technology to produce
materials used as active substances in pharmaceutical preparations. Arabica coffee grounds contain
many bioactive compounds [11], such as alkaloids, phenolics [12] (flavonoids [13] and chlorogenic
acid [14]), saponins, karatenoid [15], [16], and other active compounds [17], [18]. Arabica coffee grounds
also contain polysaccharides [19] and oil [20]. Nurman et al. [21] presented GC-MS results from
arabica coffee ground oil which showed the presence of compounds such as 1,2-benzenedicarboxylic
acid, bis (2-etylhexyl) ester (18.09%), methylcyclopentane (14.93%), linoleic acid (9.00%), pentadecylic acid (8.81%), ethyl linoleate (6.36%), 2,3-dimethylbenzofuran (1.61%), cyclohexane (1.36%), and other compounds.
The secondary metabolite content of Arabica coffee ground nanoparticles can be used as an
active ingredient in antioxidant and anti-inflammatory gel preparations [22,23]. Anti-inflammatory
gel is a semi-solid preparation (for topical use), which contains active compounds that can provide
anti-inflammatory effects [24,25]. To produce an optimal anti-inflammatory gel it is necessary
to optimize the gel preparation formula. One of optimization methods used is the Response Surface Methodology.
The Response Surface Methodology is a set of mathematical methods and statistical techniques that are used to create a model and conduct an analysis of responses influenced by several factors to optimize
the response [26]. One method for Response Surface is the Box-Behnken Design. The Box-Behnken
Design is used in experiments with three levels of factorial design [27,28].
Based on the above description, we conducted this research to determine the optimum formulation
of anti-inflammatory gel preparations using Arabica coffee ground nanoparticles as active compounds.
Treatment optimization was performed using the Response Surface Methodology, according to the Box-Behnken Design, with a quadratic model in Design Expert Version 10.0.3.0 with three factors (x) and four responses (y).
2. Materials and Methods
2.1. Tools and Materials
The tools used in this study were analytical grade, baker glass, graduated cylinders, a volume pipette, and a mortar and pestle. The instruments used were a pH meter (pHep HI 98107 by HANNA Instrument, George Washington Hwy Smithfield, RI 02917, United States), Viscometer Brookfield (Dial Reading Viscometer Brookfield, Brookfield Engineering Labs., Inc.11 Commerce
Boulevard, Middleboro, MA 02346, USA), particle size analyzer (DelsaTMNano, Beckman Coulter, Inc.
Indianapolis, IN 46268, USA), scanning electron microscope (QuantaTM650, FEI, Hillsboro, OR, USA)
and UV-Vis spectrophotometer (UV-1700 pharmaspec, Shimadzu Corporation, Kyoto, Japan). The materials used in this study were carbopol 940, methylparaben, glyserin, triethanolamine
(TEA) (Pharmaceutical Grade), aquadest and Arabica Coffee (Coffea arabicaL.) ground nanoparticles.
2.2. Research Design
Optimization of the gel formulations was performed using the Box-Behnken Design because it
can combine a 2k factorial with an incomplete blocking design [28], conducted with Software Design
Expert Version 10.0.3.0, using three factors (x) and three levels (low, medium and high) as shown
in Table1. The Response surface quadratic model is used to interpret experimental data. Therefore, it
can be obtained by the relationship between factors (x) and responses (y). The relationship between
factors and responses is given by Equation (1):
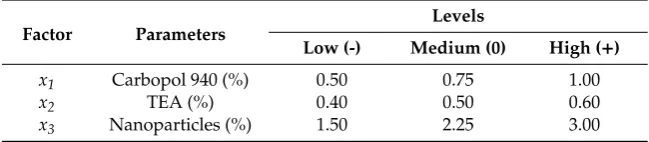
Table 1.Design level of Arabica coffee ground nanoparticles gel formulation with three factors (x) and three levels.
Factor Parameters Levels
Low (-) Medium (0) High (+)
x1 Carbopol 940 (%) 0.50 0.75 1.00
x2 TEA (%) 0.40 0.50 0.60
x3 Nanoparticles (%) 1.50 2.25 3.00
The quadratic relationship uses a higher polynominal degree approximation function called a second-order model, as given by Equation (2):
y=β0+
k X
i=1 βixi+
k X
i=1
βiix2i +. . .+ X
i<j X
βi jxixj +ε. (2)
wherexis the independent/factors variable,yis the responses variable,εis the error responses, andβ
is the model variable.
2.3. Formulation of Gel Preparations
The carbopol 940 base was weighed and put into a beaker glass. Then, we added 100 mL of
aquadest and stirred the solution using a magnetic stirrer at 80◦C for 30 min. The expanded carbopol
base was put in a mortar, TEA, and 7.5 mL glycerin were added: they subtance was stirred evenly.
Then, 0.1 g methylparaben was added and homogenized. Finally, Arabica coffee ground nanoparticles
were added, crushed until homogeneous, and completely dispersed.
2.4. Characterization of Gel Preparations
The characterization and response (y) in the design of the experiments conducted on the gel
preparations include an acidity degree (pH) test, a spreadability test, a viscosity test, and a total phenolic test.
2.4.1. Acidity Degree (pH) Test
We weighed a sample of 10 g, dissolved in aquadest to 100 mL, and stirred evenly. Then, the pH of the solution was measured using a pH meter.
2.4.2. Spreadability Test
The gel was weighed to be as high as 0.5 g and then placed on graph paper coated with glass. Then, we put another glass above the gel mass. The gel diameter was calculated by measuring the diameter length of several sides. Then we added an additional load of 150 g, allowed the mixture to stand for 1 min, and measured the diameter of the gel as before.
2.4.3. Viscosity Test
A maximum of 100 mL of gel was put into a container, and then placed on a viscometer with spindle no. 64 installed. Then, the spindle was lowered onto the gel to the specified limit. Next, we set the speed to 0.6 rpm and used the viscosity value shown on the tool.
2.4.4. Total Phenolic Test
Gallic acid was weighed to amaximum of 125 mg. Then, 96% ethanol was added up to 25 mL
to obtain a 5000 mg/mL concentrated mother solution. From the main solution, 10 mL was pipetted
a concentrate of 1000 mg/mL. The second mother solution was then pipetted 3, 4, 5, and 7 mL, and diluted with 96% ethanol to a volume of 10 mL. The resulting solution had concentrations of 300, 400,
500, and 700 mg/L. A total of 0.2 mL of each gallic acid solution at various concentrations was pipetted,
and then we added 15.8 mL of distilled water and 1 mL of Folin-Ciocalteu reagent: the mixture was then shaken until homogeneous. The solution was allowed to stand for 8 min, and then we added
3 mL of 20% Na2CO3solution, which was shaken homogeneously. The solution was then incubated
for 2 h at room temperature. Uptake was measured by a UV-Vis spectrophotometer at a wavelength of 725 nm.
A total of 0.3 g of gel was weighed and then dissolved to 10 mL with 96% ethanol. A total of 0.2 mL of the solution was then pipetted, and we added 15.8 mL of distilled water and 1 mL of the Folin-Ciocalteu reagent; the solution was shaken until homogeneous. The solution was allowed to
stand for 8 min, and then 3 mL of Na2CO320% of the solution was allowed to stand for 2 h at room
temperature. Uptake was measured by a UV-Vis spectrophotometer at a wavelength of 725 nm.
3. Results and Discussion
The arabica coffee ground nanoparticles used were residue from the processing of coffee drinks.
The ultrasonication process, produced 396.0 nm nanoparticles (Figure1), with 70.680% solubility
and pH 5.33. The SEM analysis results for the arabica coffee ground nanoparticles can be seen in
Figure2. The secondary metabolite content of the arabica coffee ground nanoparticles are alkaloids,
saponins, and phenolics, with a total phenolic content of 1246.897µg GAE/g. Phenolic compounds are
compounds providing antioxidant and anti-inflammatory effects [29–34]. A nano-sized active drug
has the advantage of being able to pass through cell walls and membranes to reach the target cell.
In addition, a nano-size also ensures high solubility and absorption efficiency [7,8,35].
incubated for 2 h at room temperature. Uptake was measured by a UV-Vis spectrophotometer at a wavelength of 725 nm.
A total of 0.3 g of gel was weighed and then dissolved to 10 mL with 96% ethanol. A total of 0.2 mL of the solution was then pipetted, and we added 15.8 mL of distilled water and 1 mL of the Folin-Ciocalteu reagent; the solution was shaken until homogeneous. The solution was allowed to stand for 8 min, and then 3 mL of Na2CO3 20% of the solution was allowed to stand for 2 h at room
temperature. Uptake was measured by a UV-Vis spectrophotometer at a wavelength of 725 nm.
3. Results and Discussion
The arabica coffee ground nanoparticles used were residue from the processing of coffee drinks. The ultrasonication process, produced 396.0 nm nanoparticles (Figure 1), with 70.680% solubility and pH 5.33. The SEM analysis results for the arabica coffee ground nanoparticles can be seen in Figure 2. The secondary metabolite content of the arabica coffee ground nanoparticles are alkaloids, saponins, and phenolics, with a total phenolic content of 1246.897 µ g GAE/g. Phenolic compounds are compounds providing antioxidant and anti-inflammatory effects [29–34]. A nano-sized active drug has the advantage of being able to pass through cell walls and membranes to reach the target cell. In addition, a nano-size also ensures high solubility and absorption efficiency [7,8,35].
Sci. Pharm. 2019, 87, x FOR PEER REVIEW 5 of 17
Figure 2. Morphology SEM of Arabica coffee ground nanoparticles.
3.1. Prediction of Optimum Formulation
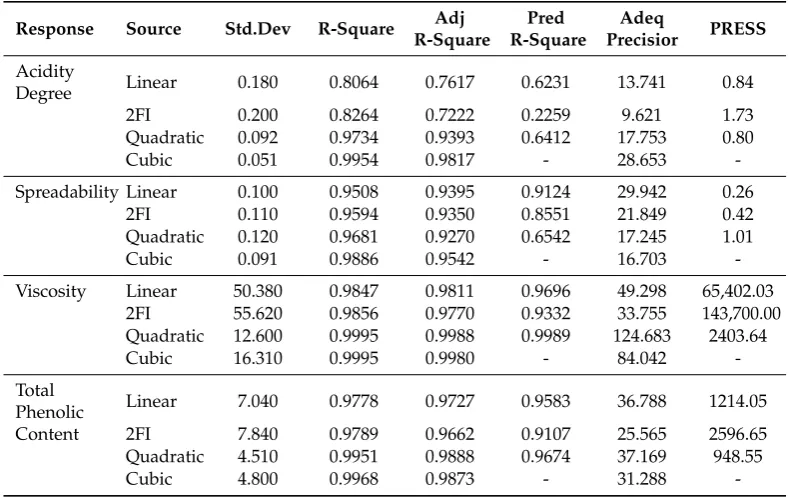
The optimum formulation of gel preparations using the Box-Behnken Design was performed using Design Expert Version 10.0.3.0 with three factors (x) on three levels and four responses. This analysis obtained 17 runs, as shown in Table 2. The design model used in this study was the qaudratic model because it obtained a high R2 value and a low PRESS value for all responses compared to the
linear model, the 2FI model, and the cubic model. The value of R2 was expressed in %, which showed
the contribution of the regression; The greater the value of R2, the greater the contribution or role of
factor (x) to the response (y). An R2 value above 70% is considered sufficient[28]. Even though the
cubic model has a high R2 value, it does not have a Pred-R2 value and a PRESS value, so the effect of
each variable that has a signal difference is not necessary or aliased [36]. An analysis of the variance of the designed models in this study is shown in Table 3.
Table 2. Formulation design and dan characterization results of arabica coffee ground nanoparticles gel formulation with three factors (x) and three levels.
Run
Factor 1 A: Carbopol 940
% Factor 2 B: TEA % Factor 3 C: Nanoparticles % Response 1 Acidity Degree pH Response 2 Spreadability cm Response 3 Viscosity cps Response 4 Total Phenolic µgGAE/g
1 1.00 0.50 1.50 5.67 5.27 4455.05 540.86
2 0.75 0.50 2.25 5.50 5.50 3965.05 590.17
3 1.00 0.40 2.25 5.37 5.13 4535.08 595.41
4 0.50 0.40 2.25 5.33 6.33 3523.39 602.42
5 0.50 0.50 3.00 5.20 6.03 3641.82 672.10
6 0.75 0.60 1.50 6.20 5.93 3845.48 543.83
7 0.75 0.40 1.50 5.43 6.00 3823.57 548.10
8 0.75 0.50 2.25 5.60 5.60 3942.74 601.13
9 0.75 0.50 2.25 5.60 5.63 3979.20 602.51
10 0.75 0.50 2.25 5.50 5.70 3956.10 597.44
11 0.75 0.40 3.00 5.30 5.50 4033.90 663.14
12 0.75 0.60 3.00 6.20 5.27 4027.11 657.02
13 0.50 0.50 1.50 5.33 6.43 3405.97 553.75
14 0.75 0.50 2.25 5.57 5.73 3981.97 598.54
15 1.00 0.50 3.00 5.80 5.10 4604.96 669.76
16 0.50 0.60 2.25 6.13 6.27 3532.03 593.45
17 1.00 0.60 2.25 6.47 5.20 4549.12 588.52
Table 3. Characterization for the statistical design model of arabica coffee ground nanoparticles gel formulation.
Figure 2.Morphology SEM of Arabica coffee ground nanoparticles.
3.1. Prediction of Optimum Formulation
The optimum formulation of gel preparations using the Box-Behnken Design was performed
using Design Expert Version 10.0.3.0 with three factors (x) on three levels and four responses. This
analysis obtained 17 runs, as shown in Table2. The design model used in this study was the qaudratic
model because it obtained a high R2value and a low PRESS value for all responses compared to the
linear model, the 2FI model, and the cubic model. The value of R2was expressed in %, which showed
the contribution of the regression; The greater the value of R2, the greater the contribution or role of
factor (x) to the response (y). An R2value above 70% is considered sufficient [28]. Even though the
cubic model has a high R2value, it does not have a Pred-R2value and a PRESS value, so the effect of
each variable that has a signal difference is not necessary or aliased [36]. An analysis of the variance of
the designed models in this study is shown in Table3.
3.2. Organoleptic
Organoleptic gel preparations of Arabica coffee ground nanoparticles were carried out by visually
observing their shape, color, odor, and homogeneity. Overall, the arabica coffee ground nanoparticles
gel preparations have a semisolid (gel) shape, a brownish black color (typical of coffee grounds), and
homogeneous. These physical properties were more dominant due to the active substance added:
arabica coffee ground nanoparticles.
Table 2.Formulation design and dan characterization results of arabica coffee ground nanoparticles gel formulation with three factors (x) and three levels.
Run Factor 1 A: Carbopol 940 % Factor 2 B: TEA % Factor 3 C: Nanoparticles % Response 1 Acidity Degree pH Response 2 Spreadability cm Response 3 Viscosity cps Response 4 Total Phenolic
µgGAE/g
1 1.00 0.50 1.50 5.67 5.27 4455.05 540.86
2 0.75 0.50 2.25 5.50 5.50 3965.05 590.17
3 1.00 0.40 2.25 5.37 5.13 4535.08 595.41
4 0.50 0.40 2.25 5.33 6.33 3523.39 602.42
5 0.50 0.50 3.00 5.20 6.03 3641.82 672.10
6 0.75 0.60 1.50 6.20 5.93 3845.48 543.83
7 0.75 0.40 1.50 5.43 6.00 3823.57 548.10
8 0.75 0.50 2.25 5.60 5.60 3942.74 601.13
9 0.75 0.50 2.25 5.60 5.63 3979.20 602.51
10 0.75 0.50 2.25 5.50 5.70 3956.10 597.44
11 0.75 0.40 3.00 5.30 5.50 4033.90 663.14
12 0.75 0.60 3.00 6.20 5.27 4027.11 657.02
13 0.50 0.50 1.50 5.33 6.43 3405.97 553.75
14 0.75 0.50 2.25 5.57 5.73 3981.97 598.54
15 1.00 0.50 3.00 5.80 5.10 4604.96 669.76
16 0.50 0.60 2.25 6.13 6.27 3532.03 593.45
Table 3. Characterization for the statistical design model of arabica coffee ground nanoparticles gel formulation.
Response Source Std.Dev R-Square Adj
R-Square
Pred R-Square
Adeq
Precisior PRESS
Acidity
Degree Linear 0.180 0.8064 0.7617 0.6231 13.741 0.84
2FI 0.200 0.8264 0.7222 0.2259 9.621 1.73
Quadratic 0.092 0.9734 0.9393 0.6412 17.753 0.80
Cubic 0.051 0.9954 0.9817 - 28.653
-Spreadability Linear 0.100 0.9508 0.9395 0.9124 29.942 0.26
2FI 0.110 0.9594 0.9350 0.8551 21.849 0.42
Quadratic 0.120 0.9681 0.9270 0.6542 17.245 1.01
Cubic 0.091 0.9886 0.9542 - 16.703
-Viscosity Linear 50.380 0.9847 0.9811 0.9696 49.298 65,402.03
2FI 55.620 0.9856 0.9770 0.9332 33.755 143,700.00
Quadratic 12.600 0.9995 0.9988 0.9989 124.683 2403.64
Cubic 16.310 0.9995 0.9980 - 84.042
-Total
Phenolic Linear 7.040 0.9778 0.9727 0.9583 36.788 1214.05
Content 2FI 7.840 0.9789 0.9662 0.9107 25.565 2596.65
Quadratic 4.510 0.9951 0.9888 0.9674 37.169 948.55
Cubic 4.800 0.9968 0.9873 - 31.288
-3.3. Acidity Degree
The acidity degree (pH) is a very important parameter in gel preparations since gel is a topical preparation used on the skin. Therefore, gel preparations must have a pH similar to that of human
skin (4.5–6.5) [37] to avoid irritation or erythema on the skin. This test shows that the pH of the gel
preparation ranges from 5.20 to 6.47, which is still in the human skin’s pH range (Table2).
The quadratic design model has a significant effect on the acidity degree of gel preparations, with
a p-value of 0.0001 (less than 0.0500), as shown in Table4. Significant factors on acidity are A, B, and
B2because they have p-values, respectively, of 0.0016;<0.0001, and 0.0005. The insignificance of the
“lack of fit” with an F-value of 6.41 and a p-value of 5.23%, indicates that the quadratic design model is appropriate for analyzing the acidity test data, but this model has a low probability because its p-value
is less than 10%. The relationship between the degree of acidity of the gel preparation with a factor (x)
based on the coefficient value can be seen in Equation (3).
y=5.55+0.16A+0.45B−0.017C+0.075AB+0.067AC+0.033BC−5.833E-003A2+0.28B2−0.048C2 (3)
The degree of acidity increases with an increasing concentration of TEA used in accordance with
a p-value of<0.0001, as shown in Figure3. TEA is difficult to evaporate at room temperature, has an
ammonia odor, and can form a solid or liquid depending on its temperature and the value of its purity. Its relatively basic nature means that a TEA with a pH of 10.5 can be used as a basic agent and also as
an emulsifying agent [38]. However carbopol 940 has a pH of 7.7 and a nanoparticle has a pH of 5.33,
which does not have a significant effect on the acidity level of the arabica coffee ground nanoparticles
gel preparations.
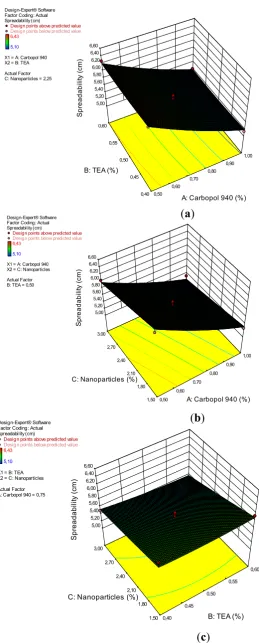
3.4. Spreadibility
The spreadability of gel preparations is defined as the ability of the gel to be spread on the surface
of the skin [39]. The greater the scatter diameter, the greater the surface area that can be reached by
the gel. Good spreadability can guarantee the distribution of a gel when applied to the skin, good
gel preparations reveal a value between 5.10–6.43 cm (Table2), which indicates that the gel has a good spreadability.
Table 4. ANOVA analysis for the quadratic model of the acidity degree of arabica coffee ground nanoparticles gel preparations.
Source Sum of Squares df Mean Square F Value p-Value Prob>F Characterization
Model 2.18 9 0.24 28.52 0.0001 significant
A-Carbopol 940 0.21 1 0.21 24.90 0.0016
B-TEA 1.59 1 1.59 187.43 <0.0001
C-Nanopartikel 2.222×10⁻³
1 2.222×10⁻³
0.26 0.6245
AB 0.022 1 0.022 2.65 0.1474
AC 0.018 1 0.018 2.10 0.1910
BC 4.444×10⁻³ 1 4.444×10⁻³ 0.52 0.4927
A2 1.433×10⁻⁴
1 1.433×10⁻⁴
0.017 0.9003
B2 0.32 1 0.32 38.22 0.0005
C2 9.500×10⁻³
1 9.500×10⁻³
1.12 0.3251
Residual 0.059 7 8.484×10⁻³
Lack of Fit 0.049 3 0.016 6.41 0.0523 not significant
Pure Error 0.010 4 2.556×10⁻³
Cor Total 2.24 16
The results of the ANOVA analysis for the quadratic model of the spreadability of the arabica
coffee ground nanoparticles gel preparations are shown in Table5. This model shows significant
results, with a p-value of 0.0002. Significant factors for spreadability are A and C, with p-values of
<0.0001 and 0.0011, respectively. The “lack of fit” value is not significant, with an F-value of 2.39 and a
p-value of 20.96%. This result shows that the quadratic design model is very appropriate for analyzing the spreadability test data. The interactions between the gel dispersion power and the factor (x) can be
seen by the coefficent value, as shown in Equation (4).
y=5.63−0.55A−0.037B−0.22C+0.033AB+0.058AC−0.042BC+0.067A2+0.033B2+8.333E-003C2 (4)
Table 5. ANOVA analysis for the quadratic model of the spreadability of the arabica coffee ground nanoparticles gel preparations.
Source Sum of Squares df Mean Square F Value p-Value Prob>F Characterization
Model 2.82 9 0.31 23.57 0.0002 significant
A-Carbopol 940 2.38 1 2.38 179.29 <0.0001
B-TEA 0.011 1 0.011 0.85 0.3882
C-Nanoparticles 0.38 1 0.38 28.25 0.0011
AB 4.444×10⁻³ 1 4.444×10⁻³ 0.33 0.5812
AC 0.014 1 0.014 1.02 0.3453
BC 6.944×10⁻³
1 6.944×10⁻³
0.52 0.4933
A2 0.019 1 0.019 1.41 0.2741
B2 4.678×10⁻³
1 4.678×10⁻³
0.35 0.5717
C2 2.924×10⁻⁴
1 2.924×10⁻⁴
0.022 0.8863
Residual 0.093 7 0.013
Lack of Fit 0.060 3 0.020 2.39 0.2096 not significant
Pure Error 0.033 4 8.333×10⁻³
Cor Total 2.91 16
Carbopol 940, used as a thickener, surfactant, stabilizer, or thickener [38], plays an important role
in determining the spreadability of the gel preparations [37]. This effect is clearly seen in the results of
the ANOVA analysis and the 3D plots in Figure4. From the picture, it can be seen that carbopol 940 has
an effect on spreadability. The greater the concentration of carbopol 940, the smaller the spreadability
Figure 3. A 3D plot of the relationship between (a) carbopol 940 and TEA and the acidity degree, (b) TEA and nanoparticles and the acidity degree, and (c) carbopol 940 and nanoparticles and the acidity degree.
3.3. Spreadibility
The spreadability of gel preparations is defined as the ability of the gel to be spread on the surface of the skin [39]. The greater the scatter diameter, the greater the surface area that can be
Design-Expert® Software Factor Coding: Actual Acidity Degree (pH)
Design points above predicted value
Design points below predicted value
6,46667
5,2 X1 = A: Carbopol 940 X2 = B: TEA Actual Factor C: Nanoparticles = 2,25
0,40 0,45 0,50 0,55 0,60 0,50 0,60 0,70 0,80 0,90 1,00 5,2 5,4 5,6 5,8 6 6,2 6,4 6,6 A ci di ty D egr ee ( pH )
A: Carbopol 940 (%) B: TEA (%)
Design-Expert® Software Factor Coding: Actual Acidity Degree (pH)
Design points above predicted value
Design points below predicted value
6,46667
5,2 X1 = B: TEA X2 = C: Nanoparticles Actual Factor A: Carbopol 940 = 0,75
1,50 1,80 2,10 2,40 2,70 3,00 0,40 0,45 0,50 0,55 0,60 5,2 5,4 5,6 5,8 6 6,2 6,4 6,6 A ci dit y De gr ee (p H)
B: TEA (%) C: Nanoparticles (%)
Design-Expert® Software Factor Coding: Actual Acidity Degree (pH)
Design points above predicted value
Design points below predicted value
6,46667
5,2 X1 = A: Carbopol 940 X2 = C: Nanoparticles Actual Factor B: TEA = 0,50
1,50 1,80 2,10 2,40 2,70 3,00 0,50 0,60 0,70 0,80 0,90 1,00 5,2 5,4 5,6 5,8 6 6,2 6,4 6,6 A cid ity D eg re e ( p H )
A: Carbopol 940 (%)
C: Nanoparticles (%)
(
a
)
(
b
)
(
c
)
Figure 3. A 3D plot of the relationship between (a) carbopol 940 and TEA and the acidity degree,
(b) TEA and nanoparticles and the acidity degree, and (c) carbopol 940 and nanoparticles and the
Figure 4. 3D plot of the relationship between (a) carbopol 940 and TEA and the spreadability, (b) carbopol 940 and nanoparticles and the spreadability, and (c) TEA and nanoparticles and the spreadability.
3.5. Viscosity
Design-Expert® Software Factor Coding: Actual Spreadability (cm)
Design points above predicted value
Design points below predicted value
6,43
5,10
X1 = A: Carbopol 940 X2 = B: TEA
Actual Factor C: Nanoparticles = 2,25
0,40 0,45 0,50 0,55 0,60 0,50 0,60 0,70 0,80 0,90 1,00 5,00 5,20 5,40 5,60 5,80 6,00 6,20 6,40 6,60 S p re ada bil ity ( cm )
A: Carbopol 940 (%) B: TEA (%)
Design-Expert® Software Factor Coding: Actual Spreadability (cm)
Design points above predicted value
Design points below predicted value
6,43
5,10 X1 = A: Carbopol 940 X2 = C: Nanoparticles Actual Factor B: TEA = 0,50
1,50 1,80 2,10 2,40 2,70 3,00 0,50 0,60 0,70 0,80 0,90 1,00 5,00 5,20 5,40 5,60 5,80 6,00 6,20 6,40 6,60 S p re a d a b ili ty (c m )
A: Carbopol 940 (%) C: Nanoparticles (%)
Design-Expert® Software Factor Coding: Actual Spreadability (cm)
Design points above predicted value
Design points below predicted value
6,43
5,10
X1 = B: TEA X2 = C: Nanoparticles
Actual Factor A: Carbopol 940 = 0,75
1,50 1,80 2,10 2,40 2,70 3,00 0,40 0,45 0,50 0,55 0,60 5,00 5,20 5,40 5,60 5,80 6,00 6,20 6,40 6,60 S p read abilit y ( cm )
B: TEA (%) C: Nanoparticles (%)
(
c
)
(
b
)
(
a
)
Figure 4.3D plot of the relationship between (a) carbopol 940 and TEA and the spreadability, (b) carbopol
3.5. Viscosity
Viscosity is a measure of the thickness of a fluid; gel preparation refers to fluids that have high
a viscosity of 2000–4000 cps [39]. The viscosity test results for the gel preparations ranged from
3405.97–4604.96 cps (Table2). Viscosity is inversely proportional to spreadability; the greater the
viscosity, the smaller the spreadability.
Table6shows the ANOVA analysis for the quadratic model of the viscosity of the arabica coffee
ground nanoparticles gel preparations. The model shows significant results, with p-values<0.0001.
The significant factors on viscosity are A, C, AC, A2, and C2, with p-values of<0.0001,<0.0001, 0.0113,
<0.0001, and 0.0132. The “lack of fit” value shows insignificant results, with an F-value of 0.058 and
p-value of 97.93%. These results demonstrate that the quadratic design model is very appropriate for the analysis of the viscosity test data. The interaction between the viscosity of the gel preparation and
factor (x) can be seen from the coefficient value, as shown in Equation (5).
y=3965.01+505.12A+4.73B+97.22C+1.35AB−21.48AC−7.17BC+82.16A2−12.27B2−20.23C2 (5)
Table 6.ANOVA analysis of quadratic model for the viscosity of the arabica coffee ground nanoparticles gel preparations.
Source Sum of Squares df Mean Square F Value p-Value Prob>F Characterization
Model 2.149×10⁶ 9 2.388×10⁵ 1504.50 <0.0001 significant
A-Carbopol 940 2.041×10⁶ 1 2.041×10⁶ 12,862.08 <0.0001
B-TEA 178.67 1 178.67 1.13 0.3239
C-Nanopartikel 75,606.37 1 75,606.37 476.41 <0.0001
AB 7.28 1 7.28 0.046 0.8365
AC 1846.35 1 1846.35 11.63 0.0113
BC 205.87 1 205.87 1.30 0.2922
A2 28,424.39 1 28,424.39 179.11 <0.0001
B2 634.39 1 634.39 4.00 0.0857
C2 1722.34 1 1722.34 10.85 0.0132
Residual 1110.90 7 158.70
Lack of Fit 46.26 3 15.42 0.058 0.9793 not significant
Pure Error 1064.64 4 266.16
Cor Total 2.150×10⁶ 16
Viscosity increases by increasing the concentrations of carbopol 940 and arabica coffee ground
nanoparticles; However, increasing the TEA did not affect the viscosity of the gel preparations, as
seen in the 3D plot (Figure5). These results is consistent with the results of the ANOVA analysis,
which showed that carbopol 940 and the nanoparticles had a significant effect on gel viscosity, with
an indigo p-value<0.0001. Carbopol 940 is a synthetic polymer of acrylic acid, which is hygroscopic,
slightly acidic and very easily ionized. Carbopol 940 used as a gelling agent plays an important role
in regulating the viscosity of the gel preparations [38]. In acidic solutions (pH 3.5–4.0), the carbopol
940 dispersion shows low to medium viscosity, pH 5.0–10.0, and at temperatures above 75◦C, shows
Figure 5. A 3D plot of the relationship between (a) carbopol 940 and TEA and the viscosity, (b) carbopol 940 and nanoparticles and the viscosity, and (c) TEA and nanoparticles and the viscosity.
3.6. Total Phenolic
The total phenolic test used UV-Vis spectrophotometry at a wavelength of 725 nm. The total phenolic content was expressed as its gallic acid equivalent (GAE). The GAE is a reference for the
Design-Expert® Software Factor Coding: Actual Viscosity (cps)
Design points above predicted value
Design points below predicted value
4604,96
3405,97 X1 = A: Carbopol 940 X2 = B: TEA Actual Factor C: Nanoparticles = 2,25
0,40 0,45 0,50 0,55 0,60 0,50 0,60 0,70 0,80 0,90 1,00 3400,00 3600,00 3800,00 4000,00 4200,00 4400,00 4600,00 4800,00 V isc o si ty ( cp s)
A: Carbopol 940 (%) B: TEA (%)
Design-Expert® Software Factor Coding: Actual Viscosity (cps)
Design points above predicted value
Design points below predicted value
4604,96
3405,97 X1 = A: Carbopol 940 X2 = C: Nanoparticles Actual Factor B: TEA = 0,50
1,50 1,80 2,10 2,40 2,70 3,00 0,50 0,60 0,70 0,80 0,90 1,00 3000,00 3500,00 4000,00 4500,00 5000,00 V is cos ity ( cps )
A: Carbopol 940 (%) C: Nanoparticles (%)
Design-Expert® Software Factor Coding: Actual Viscosity (cps)
Design points above predicted value
Design points below predicted value
4604,96
3405,97 X1 = B: TEA X2 = C: Nanoparticles Actual Factor A: Carbopol 940 = 0,75
1,50 1,80 2,10 2,40 2,70 3,00 0,40 0,45 0,50 0,55 0,60 3000,00 3500,00 4000,00 4500,00 5000,00 V isco si ty (cp s)
B: TEA (%) C: Nanoparticles (%)
(
b
)
(
c
)
(
a
)
Figure 5.A 3D plot of the relationship between (a) carbopol 940 and TEA and the viscosity, (b) carbopol
3.6. Total Phenolic
The total phenolic test used UV-Vis spectrophotometry at a wavelength of 725 nm. The total phenolic content was expressed as its gallic acid equivalent (GAE). The GAE is a reference for the total
phenolic analysis contained in a phenolic substance [40]. Arabica coffee ground nanoparticles have a
phenolic content of 1246.897µg GAE/g. The phenolic compounds in coffee have some bioactivities, such
as antioxidant, antibacterial and anti-inflammatory activities [29,30,32,33,41–43]. The total phenolic
dosage of the coffee ground nanoparticles gel preparations ranged from 540.86 to 672.10µg GAE/g
(Table2).
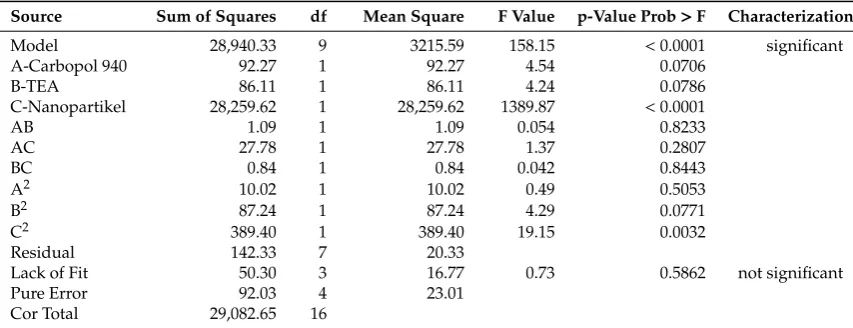
The ANOVA analysis for the quadratic model of the total phenolic content of the arabica coffee
ground nanoparticles gel preparations is shown in Table7. The analysis shows that the quadratic
model is appropriate for the analysis of the total phenolic test data, with a p-value<0.0001 (significant).
Significance factors for the total phenolic content were C and C2, with p-values<0.0001 and 0.0032.
The “lack of fit” is not significant, with an F-value of 0.73 and a p-value of 58.62%. The interaction
between the total phenolic gel preparation with a factor (x) can be seen from the coefficient value, as
shown in Equation (6).
Table 7.ANOVA analysis for the quadratic model of the total phenolic content of the arabica coffee ground nanoparticles gel preparations.
Source Sum of Squares df Mean Square F Value p-Value Prob>F Characterization
Model 28,940.33 9 3215.59 158.15 <0.0001 significant
A-Carbopol 940 92.27 1 92.27 4.54 0.0706
B-TEA 86.11 1 86.11 4.24 0.0786
C-Nanopartikel 28,259.62 1 28,259.62 1389.87 <0.0001
AB 1.09 1 1.09 0.054 0.8233
AC 27.78 1 27.78 1.37 0.2807
BC 0.84 1 0.84 0.042 0.8443
A2 10.02 1 10.02 0.49 0.5053
B2 87.24 1 87.24 4.29 0.0771
C2 389.40 1 389.40 19.15 0.0032
Residual 142.33 7 20.33
Lack of Fit 50.30 3 16.77 0.73 0.5862 not significant
Pure Error 92.03 4 23.01
Cor Total 29,082.65 16
Figure6shows the relationship between the factors and the total phenolic content of arabica coffee
ground nanoparticles gel preparations. The figure shows that an increase in the total phenolic content
is influenced by the concentration of nanoparticles, whereas carbopol 940 and TEA have no effect on
total phenolic content. This result is consistent with the p-value in the ANOVA analysis.
y=597.96−3.40A−3.28B+59.43C+0.52AB+2.64AC−0.46BC+1.54A2−4.55B2+9.62C2 (6)
3.7. Optimization of Gel Preparations
The optimization results using the Box-Behnken Design provides 17 formulation solutions for
arabica coffee ground nanoparticles gel formulations that can be selected to produce the optimal
response shown in Table8. Solution number 8 was chosen as the prediction for the optimum conditions
because it has a high value w/o interval (0.994) and a high desirability (0.981). Other solutions,
though they have the same w/o interval and desirability values, they produced lower total phenolic
content. Therefore, the optimum arabica coffee ground nanoparticles gel formulations are carbopol
940 (0.569%), TEA (0.468%), and nanoparticles (3.000%) that produce a response in the acidity degree
Figure 6. A 3D plot of the relationship between (a) carbopol 940 and TEA and the total phenolic content, (b) carbopol 940 and nanoparticles and the total phenolic content, and (c) TEA and nanoparticles and the total phenolic content.
3.7. Optimization of Gel Preparations
The optimization results using the Box-Behnken Design provides 17 formulation solutions for arabica coffee ground nanoparticles gel formulations that can be selected to produce the optimal
Design-Expert® Software Factor Coding: Actual Total Phenolic (mgGAE/g)
Design points above predicted value
Design points below predicted value
672,10
540,86 X1 = A: Carbopol 940 X2 = B: TEA Actual Factor C: Nanoparticles = 2,25
0,40 0,45 0,50 0,55 0,60 0,50 0,60 0,70 0,80 0,90 1,00 540,00 560,00 580,00 600,00 620,00 640,00 660,00 680,00 To ta l P he no lic ( m gG A E /g )
A: Carbopol 940 (%) B: TEA (%)
Design-Expert® Software Factor Coding: Actual Total Phenolic (mgGAE/g)
Design points above predicted value
Design points below predicted value
672,10
540,86 X1 = A: Carbopol 940 X2 = C: Nanoparticles Actual Factor B: TEA = 0,50
1,50 1,80 2,10 2,40 2,70 3,00 0,50 0,60 0,70 0,80 0,90 1,00 540,00 560,00 580,00 600,00 620,00 640,00 660,00 680,00 T ot al P hen ol ic ( m gG A E /g )
A: Carbopol 940 (%) C: Nanoparticles (%)
Design-Expert® Software Factor Coding: Actual Total Phenolic (mgGAE/g)
Design points above predicted value
Design points below predicted value
672,10
540,86 X1 = B: TEA X2 = C: Nanoparticles Actual Factor A: Carbopol 940 = 0,75
1,50 1,80 2,10 2,40 2,70 3,00 0,40 0,45 0,50 0,55 0,60 540,00 560,00 580,00 600,00 620,00 640,00 660,00 680,00 To ta l P he no lic ( m gG A E /g )
B: TEA (%) C: Nanoparticles (%)
(
c
)
(
b
)
(
a
)
Figure 6.A 3D plot of the relationship between (a) carbopol 940 and TEA and the total phenolic content,
(b) carbopol 940 and nanoparticles and the total phenolic content, and (c) TEA and nanoparticles and
Table 8.The solution of optimum formulation arabica coffee ground nanoparticles gel preparations.
No Carbopol 940 TEA Nanoparticles Acidity Degree Spreadability Viscosity Total Phenolic Desirability w/o Intervals
1 0.577 0.467 3.000 5.216 5.831 3746.158 669.138 0.981 0.993 2 0.575 0.468 3.000 5.217 5.826 3743.249 669.151 0.981 0.994 3 0.580 0.467 3.000 5.220 5.836 3750.518 669.098 0.981 0.993 4 0.577 0.468 3.000 5.219 5.840 3745.906 669.128 0.981 0.993 5 0.584 0.467 3.000 5.224 5.839 3757.318 669.044 0.981 0.993 6 0.582 0.466 3.000 5.220 5.832 3754.542 669.075 0.981 0.993 7 0.578 0.466 3.000 5.214 5.811 3747.527 669.138 0.981 0.993 8 0.569 0.468 3.000 5.212 5.850 3734.244 669.227 0.981 0.994 9 0.587 0.466 3.000 5.223 5.817 3760.642 669.027 0.981 0.993 10 0.582 0.470 3.000 5.228 5.805 3753.348 669.046 0.981 0.993 11 0.584 0.465 3.000 5.218 5.788 3756.707 669.069 0.981 0.993 12 0.591 0.467 3.000 5.229 5.792 3767.803 668.965 0.981 0.993 13 0.579 0.464 3.000 5.211 5.875 3749.066 669.142 0.981 0.993 14 0.599 0.467 3.000 5.235 5.853 3779.763 668.878 0.981 0.993 15 0.574 0.473 3.000 5.229 5.885 3741.851 669.094 0.981 0.993 16 0.578 0.474 3.000 5.236 5.772 3748.470 669.020 0.980 0.993 17 0.549 0.468 3.000 5.194 5.888 3705.619 669.495 0.980 0.994
4. Conclusions
Arabica coffee (Coffea arabicaL.) ground nanoparticles can be used as a source of active compounds
in anti-inflammatory gel preparations since it has a high total phenolic content. The quadratic model
in the Box-Behnken Design was used to produce the optimum formulation of an arabica coffee ground
nanoparticles gel, with a composition of: carbopol 940 (0.569%), TEA (0.468%), and nanoparticles (3.000%), which produce an acidity degree of (5.212), a spreadability of (5.850 cm), viscosity of (3734.244
cps), and total phenolic content of (669.227µg GAE/g).
Author Contributions:Conceptualization, S.N.; Methodology, R.Y.; Project administration, I.; Supervision, E.N. and T.C.S.
Funding:This study has been financially supported by the Directorate of Research and Community Services Directorate General of Strengthening Research and Development, Ministry of Research, Technology and Higher
Education, No. 235/SP2H/LT/DRPM/2019.
Conflicts of Interest:The authors declare no conflict of interest.
References
1. Mohanraj, V.J.; Chen, Y. Nanoparticles – A Review.Trop. J. Pharm. Res.2006,5, 561–573. [CrossRef]
2. Ariningsih, E. Prospects of Nanotechnology Application in Agriculture and Food Processing in Indonesia.
Forum Penelit. Agro Ekon.2016,34, 1–20. [CrossRef]
3. Sudibyo, A.; Hutajulu, T.F. Potensi penerapan polimer nanokomposit dalam kemasan pangan. J. Kim.
dan Kemasan2013,35, 6–19. [CrossRef]
4. Berekaa, M.M. Review Article Nanotechnology in Food Industry; Advances in Food processing, Packaging
and Food Safety.Int. J. Curr. Microbiol. Appl. Sci.2015,4, 345–357.
5. Liu, Y.; Niu, T.; Zhang, L.; Yang, J. Review on nano-drugs.Nat. Sci.2010,2, 41–48. [CrossRef]
6. Astruc, D. Introduction to Nanomedicine.Molecule2016,21, 4. [CrossRef]
7. Rizvi, S.A.A.; Saleh, A.M. Applications of Nanoparticle Systems in Drug Delivery Technology.Saudi Pharm. J.
2018,26, 64–70. [CrossRef]
8. Sawasdee, K.; Choksawad, P.; Pimcharoen, S.; Prapainop, K. Development of Size-Tunable Polymeric
Nanoparticles for Drug Delivery Applications.Glob. Heal. Manag. J.2017,1, 31–36. [CrossRef]
9. Prasetyo, Y.A.; Abdassah, M.; Rusdiana, T. Preparation and Characterization of Glucosamine Nanoparticle
by Ionic Gelation Method Using Chitosan and Alginate.Indones. J. Pharm.2019,1, 1–10. [CrossRef]
10. Hanutami, N.B.; Budiman, A. Review Artikel: Penggunaan Teknologi Nano pada Formulasi Obat Herbal.
Farmaka2017,15, 29–41.
11. Cruz, R.; Gomes, T.; Ferreie, A.; Mendes, E.; Baptista, P.; Cunha, S.; Pereira, J.A.; Ramalhosa, E.; Casal, S.
Antioxidant activity and bioactive compounds of lettuce improved by espresso coffee residues.Food Chem.
12. Sant’Anna, V.; Biondo, E.; Kolchinski, E.M.; da Silva, L.F.S.; Correa, A.P.F.; Bach, E.; Brandelli, A. Total
Polyphenols, Antioxidant, Antimicrobial and Allelopathic Activities of Spend Coffee Ground Aqueous
Extract.Waste and Biomass Valorization2017,8, 439–442. [CrossRef]
13. Yoo, D.E.; Jeong, K.M.; Han, S.Y.; Kim, E.M.; Jin, Y.; Lee, J. Deep eutectic solvent-based valorization of spent
coffee grounds.Food Chem.2018,255, 357–364. [CrossRef] [PubMed]
14. Jeon, J.; Kim, H.; Jeong, I.; Hong, S.; Oh, M.; Yoon, M. Contents of chlorogenic acids and caffeine in various
coffee-related products.J. Adv. Res. 2019,17, 85–94. [CrossRef] [PubMed]
15. Petrik, S.; Obruˇca, S.; Benešová, P.; Márová, I. Bioconversion of spent coffee grounds into carotenoids and
other valuable metabolites by selected red yeast strains.Biochem. Eng. J.2014,90, 307–315. [CrossRef]
16. Obruca, S.; Benesova, P.; Kucera, D.; Petrik, S.; Marova, I. Biotechnological conversion of spent coffee grounds
into polyhydroxyalkanoates and carotenoids.N. Biotechnol.2015,32, 569–574. [CrossRef]
17. Page, J.C.; Arruda, N.P.; Freitas, S.P. Crude ethanolic extract from spent coffee grounds: Volatile and functional
properties.Waste Manag.2017,69, 463–469. [CrossRef]
18. Passos, C.P.; Moreira, A.S.P.; Domingues, M.R.M.; Evtuguin, D.V.; Coimbra, M.A. Sequential microwave
superheated water extraction of mannans from spent coffee grounds.Carbohydr. Polym.2014,103, 333–338.
[CrossRef]
19. Passos, C.P.; Coimbra, M.A. Microwave superheated water extraction of polysaccharides from spent coffee
grounds.Carbohydr. Polym.2013,94, 626–633. [CrossRef]
20. Tuntiwiwattanapun, N.; Tongcumpou, C. Industrial Crops & Products Sequential extraction and reactive
extraction processing of spent coffee grounds: An alternative approach for pretreatment of biodiesel
feedstocks and biodiesel production.Ind. Crop. Prod.2018,117, 359–365.
21. Nurman, S.; Lamona, A.; Nasir, M. Optimization and Characterization of N-Hexane Extracts of Arabica
Coffee Ground ( Coffea arabica L.) from Gayo Plateau as Source of Natural Antioxidant. In Proceedings of
the International Conference on Education, Science and Technology (ICON-EST 2018) at Serambi Mekkah University, Banda Aceh, Indonesia, 17–18th October 2018; 2019; pp. 1–9.
22. Palupi, N.W.; Praptiningsih, Y. Oxidized Tapioca Starch As an Alginate Substitute for Encapsulation of
Antioxidant from Coffee Residue.Agric. Agric. Sci. Procedia2016,9, 304–308. [CrossRef]
23. Cheong, M.W.; Tong, K.H.; Ong, J.J.M.; Liu, S.Q.; Curran, P.; Yu, B. Volatile composition and antioxidant
capacity of Arabica coffee.Food Res. Int.2013,51, 388–396. [CrossRef]
24. Kasman, B.B.S.; Saputri, F.A. Artikel Review: Formulasi dan Evaluasi Sediaan Gel dari Ekstrak Seledri
Apium graveolens Linn Sebagai Anti-Inflamasi.Farmaka2018,16, 63–71.
25. Ulfa, M.; Hendrarti, W.; Muhram, P.N. Formulasi Gel Ekstrak Daun Kelor ( Moringa oleifera Lam.) Sebagai
Anti Inflamasi Topikal Pada Tikus ( Rattus novergicus ).J. Pharm. Med. Sci.2016,1, 30–35.
26. Oramahi, H.Optimasi dengan RSM dan Rancangan Percobaan (Aplikasi dengan SPSS dan SAS), 1st ed.; Gava
Media: Yogyakarta, Indonesia, 2016.
27. Getachew, A.T.; Cho, Y.J.; Chun, B.S. Effect of pretreatments on isolation of bioactive polysaccharides from
spent coffee grounds using subcritical water.Int. J. Biol. Macromol.2018,109, 711–719. [CrossRef]
28. Tekindal, M.A.; Bayrak, H.; Ozkaya, B.; Genc, Y. Box- Behnken Experimental Design in Factorial Experiments:
The Importance of Bread For Nutrition and Health.Turkish J. F. Crop.2012,17, 115–123.
29. Megha, M.A.; Unnma, U.; Rameshpathy, M.; Karikalan, K.; Vickram, S.; Kumar, S.V.; Sridharan, B. Formulation
of nano-encapsulated poly-herbal ointment for anti- inflammation.Der Pharm. Lett.2013,5, 164–170.
30. Ruiz-ruiz, J.C.; Matus-basto, A.J.; Acereto-escoffié, P.; Segura-Campos, M.R. Antioxidant and
anti-inflammatory activities of phenolic compounds isolated from Melipona beecheii honey.
Food Agric. Immunol.2017,28, 1424–1437. [CrossRef]
31. Shahidi, F.; Yeo, J. Bioactivities of Phenolics by Focusing on Suppression of Chronic Diseases: A Review.
Int. J. Mol. Sci.2018,19, 1573. [CrossRef]
32. Lamona, A.; Nurman, S. Studi Awal Komponen Minyak Biji Kopi Arabika ( Coffea arabica L.) dari Kabupaten
Bener Meriah, Provinsi Aeh Menggunakan GC-MS.Agriovet2018,1, 61–72.
33. Nurman, S.; Yulia, R. The Potency of Gayo Arabica Coffee Powder Oil ( Coffea arabica L.) as a Source of
Natural Antioxidants.J. Food, Agric. Environ.2019,17, 59–64.
34. Złotek, U.; Szymanowska, U.; Pecio, L.; Kozachok, S.; Jakubczyk, A. Antioxidative and Potentially
Anti-inflammatory Activity of Phenolics from Lovage Leaves Levisticum officinale Koch Elicited with
35. Irianto, H.E.; Muljanah, I. Proses dan Aplikasi Nanopartikel Kitosan Sebagai Penghantar Obat.Squalen2011,
6, 1–8.
36. Yulia, R.; Meilina, H.; Adisalamun, A.; Darmadi, D. Aplikasi Metode Advance Oxidation Process (AOP)
Fenton pada Pengolahan Limbah Cair Pabrik Kelapa Sawit Application of Advanced Oxidation Process
(AOP) Fenton on Palm Oil Mill Effluent Treatment.J. Rekayasa Kim. dan Lingkung.2016,11, 1–9. [CrossRef]
37. Saryanti, D.; Zulfa, I.N. Optimization Carbopol And Glycerol As Basis Of Hand Gel Antiseptics Extract
Ethanol Ceremai Leaf (Phyllantus Acidus (L.) Skeels) With Simplex Lattice Design.J. Pharm. Sci. Clin. Res.
2017,02, 35–43. [CrossRef]
38. Rowe, R.C.; Sheskey, P.J.; Quinn, M.E.Handbook of Pharmaceutical Excipients, 6th ed.; Pharmaceutical Press
and American Pharmacists Association: London, UK; Washington, DC, USA, 2009.
39. Danimayostu, A.A.; Shofiana, N.M.; Permatasari, D. Pengaruh Penggunaan Pati Kentang (Solanum
tuberosum) Termodifikasi Asetilasi- Oksidasi sebagai Gelling agent terhadap Stabilitas Gel Natrium
Diklofenak.Phamaceutical J. Indones.2017,3, 25–32. [CrossRef]
40. Pristiana, D.Y.; Susanti, S.; Nurwantoro, N. Antioksidan dan Kadar Fenol Berbagai Ekstrak Daun Kopi
(Coffea sp.): Potensi Aplikasi Bahan Alami untuk Fortifikasi Pangan.J. Apl. Teknol. Pangan2017,6, 89–92.
41. Gómez-Ruiz, J.Á.; Ames, J.M.; Leake, D.S. Antioxidant activity and protective effects of green and dark coffee
components against human low density lipoprotein oxidation.Eur. Food Res. Technol.2008,227, 1017–1024.
[CrossRef]
42. García, R.L.P.; Biasetto, C.R.; Araujo, A.R.; Luiz, V.; Bianchi, D. Enhanced Extraction of Phenolic Compounds
from Coffee Industry’s Residues Through Solid State Fermentation by Penicillium Purpurogenum.
Food Sci. Technol.2015,35, 704–711. [CrossRef]
43. Shang, Y.F.; Xu, J.L.; Lee, W.J.; Um, B.H. Antioxidative Polyphenolics Obtained from Spent Coffee Grounds
by Pressurized Liquid Extraction.South African J. Bot.2017,109, 75–80. [CrossRef]
©2019 by the authors. Licensee MDPI, Basel, Switzerland. This article is an open access
article distributed under the terms and conditions of the Creative Commons Attribution