https://doi.org/10.5194/dwes-12-31-2019 © Author(s) 2019. This work is distributed under the Creative Commons Attribution 4.0 License.
Raspberry Pi-based smart sensing platform for
drinking-water quality monitoring system: a Python
framework approach
Punit Khatri1, Karunesh Kumar Gupta1, and Raj Kumar Gupta2
1Department of Electrical and Electronics Engineering, Birla Institute of Technology and Science (BITS),
Pilani 333031, India
2Department of Physics, Birla Institute of Technology and Science (BITS), Pilani 333031, India
Correspondence:Punit Khatri ([email protected]) Received: 30 October 2018 – Discussion started: 7 February 2019 Revised: 29 May 2019 – Accepted: 9 June 2019 – Published: 25 June 2019
Abstract. This paper proposes the development of a Raspberry Pi-based hardware platform for drinking-water quality monitoring. The selection of water quality parameters was made based on guidelines of the Central Pollu-tion and Control Board (CPCB), New Delhi, India. A graphical user interface (GUI) was developed for providing an interactive human machine interface to the end user for ease of operation. The Python programming language was used for GUI development, data acquisition, and data analysis. Fuzzy computing techniques were employed for decision-making to categorize the water quality in different classes like “bad”, “poor”, “satisfactory”, “good”, and “excellent”. The system has been tested for various water samples from eight different locations, and the water quality was observed as being good, satisfactory, and poor for the measured water samples. Finally, the obtained results were compared with the benchmark for authentication.
1 Introduction
Drinking-water quality monitoring is essential before con-sumption in daily life, as it may affect human health directly or indirectly (Bhardwaj et al., 2018). As much as 80 % of ill-nesses are linked to poor quality water and sanitation condi-tions (Anan, 2003). The available water is severely polluted, and the situation may become worse in the future. Drinking water with pollutant concentrations exceeding BIS (Bureau of Indian Standards) limits is considered unsafe. The water quality is measured by different government agencies among 632 districts in India, which can be accessed by the IWT (In-dia Water Tool) visualization tool (World Resources Institute, 2016). Among 632 districts, 59 are above BIS limits. The yellow and red areas in Fig. 1 indicate places where chloride, fluoride, iron, arsenic, nitrate and/or electrical conductivity exceed national standards.
Traditional water quality measurement techniques involve sample collection on site and subsequent laboratory-based chemical analysis, which is both labor- and cost-intensive
(Korostynska et al., 2013). Also, the measurements are not in real time. Hence, to reduce the labor cost and time con-sumption, there is a need for real-time monitoring of water quality for drinking applications (Bhardwaj et al., 2015). The work presented in this paper aims to provide efficient real-time monitoring of water quality in drinking applications that can address the issues related to drinking-water quality for various natural resources, e.g., lakes, rivers, wells, etc.
simul-Figure 1.Groundwater quality (number of BIS-standard breaches; World Resources Institute, 2016).
taneously was required. In the third stage, a graphical user interface (GUI) was designed for the human machine inter-face (HMI) and fuzzy modeling in Python. The water stan-dard was defined based on calculated water quality param-eters using the fuzzy inference system (FIS), since FIS has the capability to absorb vagueness related to observed pa-rameters. The fuzzy approach reported in this paper has been used and discussed widely in many environmental applica-tions; this helps in decision-making in many real-life com-plex problems (Lermontov et al., 2009).
Many researchers, such as Ponsadailakshmi et al. (2018), Tiri et al. (2018), Raman et al. (2009), Jinturkar et al. (2010), and Icaga (2007), have implemented the fuzzy modeling in MATLAB for water quality index calculation. However, the process of modeling was offline, whereas in this paper we implemented the fuzzy approach in real-time calculation, af-ter the data collection, with the help of libraries in the Python framework.
2 Materials and methods
2.1 Water quality parameter selection criteria
The Central Pollution and Control Board (CPCB) suggested criteria of water quality parameters for different usage of the water. CPCB has decided on five different categories for the use of water in different applications such as irrigation, drinking, bathing, etc. In this work, category “C” parame-ters are considered, since we are targeting the drinking-water source after conventional treatment and disinfection.
2.2 Defining water quality
The fuzzy inference system (FIS) can include vagueness in decision-making and reasoning. Hence, techniques based on fuzzy logic have proved very useful, since they are less mathematically intensive than neural networks, genetic algo-rithms, etc., and they support approximate reasoning as well. In FIS, knowledge is presented as linguistic rules. The in-puts are converted from a crisp value to linguistic variable by the process of fuzzification, and these variables are fed to the inference system. This interference system gives a new set of a linguistic variable which is then converted to a crisp value with the help of defuzzification (MathWorks, 2018). The process to design fuzzy thus involves three necessary steps: (1) define the membership function for each variable, (2) perform fuzzy inference based on the inference method, and (3) select the defuzzification method to determine water quality.
by Eq. (1):
f(x;l, m, n)=
0 for x < l,
x−l
m−l for l≤x≤m,
n−x
n−m for m≤x≤n,
0 for x > n.
(1)
The logic operations used in the fuzzy logic are min, max, and complement, and these are defined by the Eqs. (2), (3), and (4) respectively.AandBare two subsets:
µA∪B(x)=max [µA(x), µB(x)], (2)
µA∩B(x)=min [µA(x), µB(x)], (3)
µA(x)=1−µA(x). (4)
After the logic operations, the “if–then” rule was applied. All the rules were applied in parallel, and the rule which did not affect the output was ignored. The outputs of all rules were then aggregated, and all fuzzy sets that affect the output were combined into a single fuzzy set. Finally, the fuzzy set was converted into a crisp set through defuzzification, in which a single number was generated. There are several methods for defuzzification, such as the centroid, maximum, mean of maxima, height, and modified height method. In this work, the centroid defuzzification method was used, which is the most popular method. The output was calculated by averag-ing individual centroids, weighted by their heights as given by Eq. (5) (Zadeh, 1988):
Uo= n P
i=1 uiµ(ui)
n P
i=1 µ(ui)
, (5)
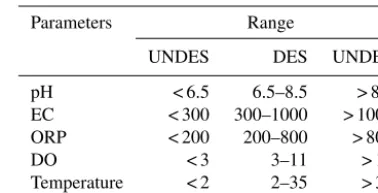
whereµ(ui) is the min and max value of the membership de-gree of the input values (depends on min and max operator). In this paper, we have assigned two groups to each wa-ter quality paramewa-ter, which are desirable (DES) and unde-sirable (UNDES), as described in Table 1. If the parameters are in the desirable range, then only fuzzy has been applied; otherwise it is not applied. For example, if the pH is in the range of 6.5 and 8.5, the assigned group is DES; similarly if pH < 6.5 or pH > 8.5, the assigned group is UNDES. In the same way, the group is checked for all five water quality pa-rameters. After checking the desirable group, the individual membership function is assigned to each parameter. Also, we have defined the membership function for water quality on the scale of 0 to 100. After assigning the membership func-tions, the if–then rule was applied and overall quality was defined based on adopted rule-based formulation.
3 Hardware platform design
The hardware platform plays a vital role in any system devel-opment since data acquisition, and data processing is done
Table 1.Groups defined for water quality parameters.
Parameters Range
UNDES DES UNDES
pH < 6.5 6.5–8.5 > 8.5 EC < 300 300–1000 > 1000 ORP < 200 200–800 > 800
DO < 3 3–11 > 11
Temperature < 2 2–35 > 35
UNDES is undesirable, and DES is desirable.
with the help of the hardware platform itself. The main task of the hardware platform design is MSA design and its inter-facing with the Raspberry Pi board followed by the Python framework. The details of the design are given below.
3.1 Multi-sensor array (MSA) design
For the proposed work, an MSA is designed using the indus-trially manufactured sensors from Atlas Scientific, USA. The individual sensors are arranged in an array form to make the MSA. The sensors used are a pH sensor, electrical conduc-tivity (EC) sensor, dissolved oxygen (DO) sensor, oxidation reduction potential (ORP) sensor, and a temperature sensor. The total dissolved solid (TDS) parameter was derived from EC.
3.2 Integration of MSA with Raspberry Pi board and interfacing with Python
Once the MSA is designed, it must be coupled with the Rasp-berry Pi for data acquisition and further data processing. The Raspberry Pi is a single-board credit-card-sized microcom-puter with an ARM Cortex-A53 processor (Raspberry Pi Foundation, 2014). It is open hardware with many onboard running components, like a CPU, graphics, memory, a USB controller, etc. Nowadays, the Raspberry Pi board is being used in many real-time applications (e.g., real-time video surveillance systems – Fawzi et al., 2018; real-time paper currency recognition of new Indian notes after demonetiza-tion – Anilkumar and Srikanth, 2018; automatic traffic con-trol systems – Talukder et al., 2017; smart traffic systems – Kumar et al., 2017; energy management systems based on real-time electricity pricing models – Qureshi et al., 2017; self-driving systems – Sumardi et al., 2018; 3-D wavelet transform – Bernabé et al., 2018; and air quality monitoring systems – Alkandari and Moein, 2018).
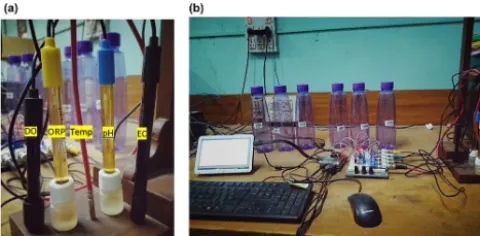
computa-Figure 2.(a)Multi-sensor array (MSA).(b)Raspberry Pi integra-tion with MSA and peripherals.
tional capabilities, the Raspberry Pi is bundled with an inbuilt Bluetooth and Wi-Fi module, an HDMI interface, a camera interface, a display slot, an SD card slot, a USB slot, etc.; all of these must be interfaced externally when using the Ar-duino platform, depending on the application.
For stand-alone applications, a display panel can be in-terfaced it with the Python framework. We have used a 7 in. touchscreen and interfaced it with Python programming. Python is an open-source programming platform that sup-ports data processing and computing. The only drawback that we are facing with the Raspberry Pi board is a limited num-ber of I2C channels, so we have interfaced an external serial port expander with the board to enhance the number of I2C channels. The experimental setup of the MSA integrated with the Raspberry Pi board is shown in Fig. 2. It includes the MSA connected to a serial port expander and a Raspberry board followed by Python programming.
4 Results and discussion
4.1 Experimental procedure
The proposed system has been tested for water samples from five different locations. To get accurate readings, each sen-sor node was calibrated before the measurement. The cali-bration was performed with the reference solution given for each sensor. Initially, the measurement iteration was carried out for at least 5 min so that sensor reading became stabilized because the original readings must be recorded only after the sensor attains stability in order to make any conclusive deci-sion out of data. The system was tested for a total duration of 21 h over 7 d. The average values of the experiment for all locations are shown in Table 2. Locations 1 to 5 are the drinking-water samples from the distribution networks, and the samples from the locations 6 to 8 are the simulated sen-sor readings. This was done to validate the sensen-sor readings, as the acquired results from the distribution networks are in real time, and hence sensor readings have not much varia-tion within the desirable range. All the targeted parameters were measured through the developed setup as well as from
Figure 3.Graphical user interface.
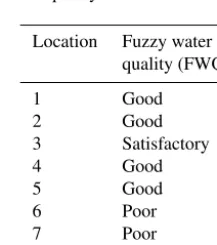
the commercial water quality monitoring system. The results obtained from MSA were accumulated through the fuzzy in-ference system implemented in Python framework. The wa-ter quality defined by the fuzzy model is shown in Table 3. The water quality is good for locations 1, 2, 4, and 5 in the distribution network and satisfactory for location 3. For loca-tions 6 to 8, the water quality is poor.
4.2 Interactive user interface
The graphical representation was provided for real-time data obtained from various sensors with the help of the GUI plat-form for the interactive HMI. An interactive GUI has been designed in the Python framework with a touch interface, as shown in Fig. 3. The touch interface is provided for the ease of operation for the operator. In the GUI, the operator can select the measurement from the menu, whether it is an in-dividual parameter or the overall water quality, with a single touch. The acquired data were kept for future use by saving them in a memory drive provided with Raspberry board. The live plotting of data is shown in Fig. 4. Thexaxis represents time, and theyaxis represents the sensor node reading.
4.3 Validation of sensor readings
To measure the accuracy of the developed system and for the authenticity of the results acquired, the proposed system was compared with the available benchmark equipment, the YSI EXO-1 sonde monitoring system, and the percentage relative error (PRE) was calculated (Lee, 2016). PRE expresses the error in percentage to determine the accuracy given by the following formula:
PRE=100×
actual−observed
actual
. (6)
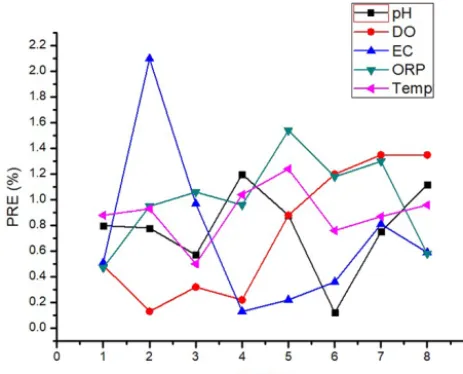
The calculated PRE is presented in Table 2 for all the sam-ples, and the graphical representation is shown in Fig. 5. The
Table 2.(a)Average values of samples for pH, DO, and EC and their calculated PRE.(b)Average values of samples for ORP and temperature and their calculated PRE.
(a)
Location pH DO (mg L−1) EC (µS cm−1)
MSA Commercial PRE MSA Commercial PRE MSA Commercial PRE
system (%) system (%) system (%)
1 7.45 7.51 0.8 8.20 8.16 0.49 385 387 0.51
2 7.62 7.68 0.78 7.90 7.89 0.13 435 426 2.1
3 6.95 6.99 0.57 9.50 9.47 0.32 510 515 0.97
4 8.1 8.2 1.2 9.23 9.21 0.22 390 385 0.13
5 7.8 7.87 0.88 8.05 7.98 0.88 445 455 0.22
6 8.2 8.21 0.12 7.8 7.7 1.2 1582 1576.2 0.36
7 8.1 8.04 0.75 7.5 7.4 1.35 1635 1621.8 0.81
8 8.1 8.01 1.12 7.5 7.4 1.35 1672 1662.1 0.59
(b)
Location ORP (mV) Temperature (◦C)
MSA Commercial PRE MSA Commercial PRE
system (%) system (%)
1 213 212 0.47 22.5 22.7 0.88
2 212 210 0.95 21.5 21.3 0.93
3 185 187 1.06 19.6 19.7 0.50
4 206 208 0.96 18.9 19.1 1.04
5 191 194 1.54 23.8 24.1 1.24
6 170.5 168.5 1.18 29.2 28.98 0.76
7 170.9 168.7 1.30 30.1 29.84 0.87
8 171.1 168.4 0.58 30.5 30.21 0.96
Figure 4.Temperature plot in GUI.
except EC, which is in the range of 0 % to 3 %, thus showing the good accuracy of the sensors used. Based on the results of the parameters obtained from MSA, water quality has been defined for all the locations using fuzzy libraries as shown in Table 3. The input and output membership functions were
Table 3.Fuzzy water quality for all locations.
Location Fuzzy water quality (FWQ)
1 Good
2 Good
3 Satisfactory
4 Good
5 Good
6 Poor
7 Poor
8 Poor
implemented in MATLAB. The same has been used for the validation of the fuzzy model implemented in Python.
4.4 Performance comparison with existing work
Figure 5.Percentage relative error (PRE) plot for different water quality parameters.
was developed in LabVIEW, which requires a PC. Salunke developed a smart sensor interface for water quality monitor-ing in the IoT environment, in which only two water quality parameters (pH and turbidity) can be measured (Salunke and Kate, 2017). Bhardwaj has developed the water quality mon-itoring system in which there was no GUI (Bhardwaj et al., 2018). Rahmat designed the real-time monitoring system for water pollution (Rahmat et al., 2017).
However, in this paper, the focus is on the drinking-water quality monitoring system. Also, we have developed the GUI in the Raspberry Pi board as an independent system which does not require any PC, and more than three water quality parameters can be observed from the developed system. The added value of the developed system in relation to standard monitoring is its development cost. The developed system costs us less than USD 1000 as compared to the benchmark, which costs approximately USD 11 000 .
5 Conclusions
Water quality monitoring is essential before consumption, and real-time monitoring will reduce the risk of illness in human beings. Traditional methods for water quality moni-toring are being replaced by online water quality monimoni-toring. In this paper, the design and development of a smart sens-ing platform for drinksens-ing-water quality measurement is pre-sented. The proposed system consists of a Raspberry Pi board integrated with a multi-sensor array, a 7 in. touchscreen, a keyboard, and a mouse. Unlike the used benchmark, the pro-posed system is low-cost, as discussed in the earlier sec-tion. A software panel is also developed for the interactive user interface. The developed user interface can help the end user to operate the system efficiently and make decisions based on the result displayed on the screen. The fuzzy
de-cision employed in this paper is an efficient way to detect drinking-water quality in real time, as compared to manual approaches.
In the future we plan to implement the system enabled with the internet of things (IoT) for online drinking-water quality monitoring in the distribution networks. At present, the cali-bration of the sensors is time-consuming and requires a spe-cific amount of time to be stabilized. Hence in the future, the focus will be on the auto-calibration of the sensors and the drift analysis and compensation of the sensors using differ-ent regression algorithms.
Data availability. No data sets were used in this article.
Author contributions. All authors contributed equally to the re-search, experimental setup design, and article preparation. All au-thors read and approve of the final paper.
Competing interests. The authors declare that they have no con-flict of interest.
Acknowledgements. The authors are pleased to acknowledge the Birla Institute of Technology and Science for providing an enabling environment to carry out the research work.
Financial support. This research has been supported by the De-partment of Science and Technology, government of India (grant no. DST/TM/WTI/2K16/103).
Review statement. This paper was edited by Luuk Rietveld and reviewed by two anonymous referees.
References
Alkandari, A. A. and Moein, S.: Implementation of Monitor-ing System for Air Quality usMonitor-ing Raspberry PI: Experimen-tal Study, Indones. J. Elec. Eng. Comput. Sci., 10, 43–49, https://doi.org/10.11591/ijeecs.v10.i1.pp43-49, 2018.
Anan, K.: ‘Water-Related Diseases Responsible For 80 Per Cent of All Illnesses, Deaths In Developing World’, Says Secretary-General In Environment Day Message, UN, 1, available at: http://www.un.org/press/en/2003/sgsm8707.doc.htm (last ac-cess: 6 February 2018), 2003.
Anilkumar, B. and Srikanth, K. R. J.: Design and development of real time paper currency recognition system of demonetization New Indian Notes by using raspberry Pi for visually challenged, Int. J. Mech. Eng. Technol., 9, 884–891, 2018.
Bernabé, G., Hernández, R., and Acacio, M. E.: Parallel implementations of the 3D fast wavelet transform on a Raspberry Pi 2 cluster, J. Supercomput., 74, 1765–1778, https://doi.org/10.1007/s11227-016-1933-2, 2018.
Bhardwaj, J., Gupta, K. K., and Gupta, R.: A review of emerging trends on water quality measurement sensors, in: 2015 Interna-tional Conference on Technologies for Sustainable Development (ICTSD), 4–6 February, Mumbai, 1–6, IEEE, 2015.
Bhardwaj, J., Gupta, K. K., and Gupta, R.: Towards a cyber-physical era: soft computing framework based multi-sensor array for water quality monitoring, Drink. Water Eng. Sci., 11, 9–17, https://doi.org/10.5194/dwes-11-9-2018, 2018.
Central Polution Control Board: Central Polution Control Board; Environmental Standards; Water Quality Criteria, avail-able at: https://cpcb.nic.in/water-quality-criteria/ (last access: 25 November 2017), 2007.
Fawzi, L. M., Ameen, S. Y., Alqaraawi, S. M., and Dawwd, S. A.: Embedded Real-Time Video Surveillance System based on Multi-Sensor and Visual Tracking, Appl. Math. Infor. Sci., 12, 345–359, https://doi.org/10.18576/amis/120209, 2018.
Icaga, Y.: Fuzzy evaluation of water qual-ity classification, Ecol. Indicat., 7, 710–718, https://doi.org/10.1016/j.ecolind.2006.08.002, 2007.
Jinturkar, A. M., Deshmukh, S. S., Agarkar, S. V., and Chavhan, G. R.: Determination of water quality index by fuzzy logic ap-proach: a case of ground water in an Indian town, Water Sci. Technol., 61, 1987–1994, https://doi.org/10.2166/wst.2010.095, 2010.
Korostynska, O., Mason, A., and Al-Shamma’a, A. I.: Monitoring pollutants in wastewater: Traditional lab based versus modern real-time approaches, in: Smart Sensors, Measurement and In-strumentation, vol. 4, 1–24, Springer, Berlin, Heidelberg, 2013. Kosko, B.: Fuzzy thinking?: the new science of fuzzy logic,
Hyper-ion, available at: https://books.google.co.in/books/about/Fuzzy_ Thinking.html?id=SdsQAQAAIAAJ (last access: 18 Septem-ber 2018), 1993.
Kumar, K. K., Durai, S., Vadivel, M. T., and Kumar, K. A.: Smart traffic system using raspberry pi by applying dynamic color changer algorithm, in: 2017 IEEE International Conference on Smart Technologies and Management for Computing, Commu-nication, Controls, Energy and Materials (ICSTM), 2–4 August, Chennai, 146–150, IEEE, 2017.
Lee, S.: PERCENTAGE ERROR, MathWorld, 1, available at: http://mathworld.wolfram.com/PercentageError.html (last ac-cess: 25 March 2018), 2016.
Lermontov, A., Yokoyama, L., Lermontov, M., and Machado, M. A. S.: River quality analysis using fuzzy water quality index: Ribeira do Iguape river watershed, Brazil, Ecol. Indicat., 9, 1188–1197, https://doi.org/10.1016/j.ecolind.2009.02.006, 2009.
MathWorks: Fuzzy Inference System Modeling – MATLAB & Simulink – MathWorks India, available at: https://in.mathworks. com/help/fuzzy/mamdani-fuzzy-inference-systems.html, last access: 14 March 2018.
Ponsadailakshmi, S., Sankari, S. G., Prasanna, S. M., and Mad-hurambal, G.: Evaluation of water quality suitability for drink-ing usdrink-ing drinkdrink-ing water quality index in Nagapattinam district, Tamil Nadu in Southern India, Ground. Sustain. Develop., 6, 43– 49, https://doi.org/10.1016/j.gsd.2017.10.005, 2018.
Qureshi, M. U., Girault, A., Mauger, M., and Grijalva, S.: Im-plementation of home energy management system with optimal load scheduling based on real-time electricity pricing models, in: 2017 IEEE 7th International Conference on Consumer Electron-ics – Berlin (ICCE-Berlin), 3–6 September, Berlin, vol. 2017-September, 134–139, IEEE, 2017.
Rahmat, R. F., Athmanathan, Syahputra, M. F., and Lydia, M. S.: Real time monitoring system for water pollution in Lake Toba, in 2016 International Conference on Informatics and Comput-ing, ICIC 2016, 28–29 October 2016, Mataram, 383–388, IEEE, 2017.
Raman, B. V, Bouwmeester, R., and Mohan, S.: Fuzzy Logic Water Quality Index and Importance of Water Qual-ity Parameters, Air Soil Water Res., 2, ASWR.S2156, https://doi.org/10.4137/ASWR.S2156, 2009.
Raspberry Pi Foundation: Raspberry Pi Documentation, 1, avail-able at: https://www.raspberrypi.org/documentation/ (last access: 15 March 2018), 2014.
Salunke, P. and Kate, J.: Advanced smart sensor interface in in-ternet of things for water quality monitoring, in: 2017 Interna-tional Conference on Data Management, Analytics and Innova-tion, ICDMAI 2017, 24–26, Pune, 298–302, IEEE, 2017. Sumardi, Taufiqurrahman, M., and Riyadi, M. A.:
Street mark detection using raspberry pi for self-driving system, Telkomnika, 16, 629–634, https://doi.org/10.12928/TELKOMNIKA.v16i2.4509, 2018. Talukder, M. Z., Towqir, S. S., Remon, A. R., and Zaman, H. U.: An
IoT based automated traffic control system with real-time update capability, in: 2017 8th International Conference on Computing, Communication and Networking Technologies (ICCCNT), 3–5 July, Delhi, 1–6, IEEE, 2017.
Taru, Y. K. and Karwankar, A.: Water monitoring system using ar-duino with labview, in: Proceedings of the International Con-ference on Computing Methodologies and Communication, IC-CMC 2017, 18–19 July, Erode, vol. 2018-January, 416–419, IEEE, 2018.
Tiri, A., Belkhiri, L., and Mouni, L.: Evaluation of sur-face water quality for drinking purposes using fuzzy in-ference system, Ground. Sustain. Develop., 6, 235–244, https://doi.org/10.1016/J.GSD.2018.01.006, 2018.
World Resources Institute: India Water Tool Version 2.1, available at: http://maps.indiawatertool.in/iwt/av/IWTUserGuide.pdf (last access: 5 December 2017), 2016.
Zadeh, L. A.: “Fuzzy logic”, Computer, 21, 83–93, https://doi.org/10.1109/2.53, 1988.