www.atmos-meas-tech.net/10/1139/2017/ doi:10.5194/amt-10-1139-2017
© Author(s) 2017. CC Attribution 3.0 License.
Collection efficiency of
α
-pinene secondary organic aerosol
particles explored via light-scattering single-particle
aerosol mass spectrometry
Ellis Shipley Robinson1,2, Timothy B. Onasch3, Douglas Worsnop3, and Neil M. Donahue1,2 1Carnegie Mellon University, Center for Atmospheric Particle Studies, Pittsburgh, PA, USA 2Department of Chemical Engineering, Carnegie Mellon University, Pittsburgh, PA, USA 3Aerodyne Research, Inc., Billerica, MA, USA
Correspondence to:Neil M. Donahue (nmd@andrew.cmu.edu) Received: 15 August 2016 – Discussion started: 12 September 2016
Revised: 6 February 2017 – Accepted: 14 February 2017 – Published: 21 March 2017
Abstract. We investigated the collection efficiency and ef-fective ionization efficiency for secondary organic aerosol (SOA) particles made fromα-pinene + O3using the
single-particle capabilities of the aerosol mass spectrometer (AMS). The mean count-based collection efficiency (CEp) for SOA
across these experiments is 0.30 (±0.04 SD), ranging from 0.25 to 0.40. The mean mass-based collection efficiency (CEm) is 0.49 (±0.07 SD). This sub-unit collection efficiency
and delayed vaporization is attributable to particle bounce in the vaporization region. Using the coupled optical and chem-ical detection of the light-scattering single-particle (LSSP) module of the AMS, we provide clear evidence that “delayed vaporization” is somewhat of a misnomer for these particles: SOA particles measured as a part of the AMS mass distribu-tion do not vaporize at a slow rate; rather, they flash-vaporize, albeit often not on the initial impact with the vaporizer but instead upon a subsequent impact with a hot surface in the vaporization region. We also find that the effective ionization efficiency (defined as ions per particle, IPP) decreases with delayed arrival time. CEp is not a function of particle size
(for the mobility diameter range investigated, 170–460 nm), but we did see a decrease in CEpwith thermodenuder
tem-perature, implying that oxidation state and/or volatility can affect CEpfor SOA. By measuring the mean ions per
parti-cle produced for monodisperse partiparti-cles as a function of sig-nal delay time, we can separately determine CEp and CEm
and thus more accurately measure the relative ionization
effi-ciency (compared to ammonium nitrate) of different particle types.
1 Introduction
Organic aerosol (OA) comprises a significant fraction of sub-micron atmospheric particulate mass, ranging from 20 to 90 % (Kanakidou et al., 2005; Jimenez et al., 2009). OA has been shown to have negative impacts on human health (e.g., Lozano et al., 2013) and remains highly uncertain in its effect on radiative climate forcing (e.g., Solomon et al., 2007). The physical and chemical characteristics of OA can vary dramat-ically and depend strongly on source, location, atmospheric age, and other factors. Despite the ubiquity and importance of OA, real-time measurements are technically challenging due to the wide range of chemical composition, particle size, and volatility represented by OA in the atmosphere.
The aerosol mass spectrometer (AMS, Aerodyne Re-search, Inc.) is used widely in both ambient and labora-tory measurements of OA. It has enabled significant ad-vances in our understanding of how organic aerosols form (Craven et al., 2012), age (Aiken et al., 2008), and mix (Robinson et al., 2013) by providing real-time measurements of size-resolved composition and mass for submicron, non-refractory particulate matter (NR-PM1). However, a
linger-ing challenge with full quantification of NR-PM1in the AMS
2007), which is the ratio of the measured AMS mass signal to the actual NR-PM1mass concentration. Another factor
influ-encing calibration of the AMS mass response is the species-specific relative ionization efficiency (RIE) of analyte; this is relative to a calibrant, typically ammonium nitrate. How-ever, an average RIE value is often applicable to most organic species (Canagaratna et al., 2007; Jimenez et al., 2016); there can be some variability in RIE for specific organic species. RIE is not believed to be subject to matrix effects.
To obtain quantitative agreement between the AMS and other collocated instruments in field campaigns, CEm is
usually applied to correct for the consistently lower AMS-measured mass. CEmcan be written as
CEm=
SAMS
SO
, (1)
whereSAMSis the signal from the AMS andSO is the
sig-nal of another (perfectly calibrated) instrument. Importantly, this calculation assumes ideal operating conditions for both instruments and the application of all other appropriate cor-rection factors. For example, Drewnick et al. (2003), in a sul-fate aerosol intercomparison study, applied a scaling factor of 2.41 (CEm=0.42) to the AMS-measured sulfate to achieve
good agreement with a collocated particle-into-liquid sam-pler (PILS) instrument. In another example, Middlebrook et al. (2012) recently reported parameterizations of CEmfor
ambient sulfate-containing particles that could be used to predict CEm based on particle acidity and mass fraction of
ammonium nitrate. High CEm values were consistent with
predicted liquid phase state at 298 K. Thus, CEmshould be
thought of as a sensitivity factor that varies for particle types with different compositions and phase states.
Huffman et al. (2005) define CEmas the product of three
size-dependent terms:
CEm(dva)=EL(dva)×ES(dva)×EB(dva), (2)
whereEL(dva) is the lens transmission efficiency as a
func-tion of vacuum aerodynamic diameter, (dva);ES(dva) is the
striking efficiency of particles on the AMS vaporizer trans-mitted through the lens to the time-of-flight chamber; and
EB(dva) is the vaporization efficiency of particles that strike
the vaporizer surface, also known as “bounce” because parti-cles can bounce away from the vaporizer surface and escape detection. Any particle that enters the instrument but is not detected by the mass spectrometer due to any of these three loss terms contributes to the mass discrepancy between the AMS and another (perfectly calibrated) mass measurement.
Previous measurements and models have characterized the loss of particles in the lens region and orifice, and have shown near-unit transmission efficiencies for particles in the size range of 60–600 nm. However, for particle populations whose distribution is significantly outside of the transmission window, especially for larger particles, EL can contribute
significantly to CEm (Quinn et al., 2006). The striking
ef-ficiency is a measurement of the divergence of the particle
beam upon expansion into the particle time-of-flight (PToF) chamber. While spherical particles can be narrowly focused on the 3.8 mm wide vaporizer over the distance of the PToF chamber, non-spherical particles can diverge from the fo-cused beam, causing sub-unit values ofES(Huffman et al.,
2005). Studies show this term accounts for very little parti-cle loss for ambient aerosol (Salcedo et al., 2007), as well as laboratory SOA and (NH4)2SO4(Docherty et al., 2013).ES
can be well characterized by the use of a beamwidth probe (Huffman et al., 2005).
In the majority of cases, the largest uncertainty and largest contributor to sub-unit CEmis the particle bounce term,EB.
Particle bounce has long been known to confound parti-cle measurements, such as impactors and surface-desorption mass spectrometers (e.g., Myers and Fite, 1975; Virtanen et al., 2010). A limited number of studies have investigated the nature and root cause of particle bounce for laboratory aerosols in the AMS. Alfarra (2004) identified particle phase state as a controller of particle bounce for a selection of labo-ratory organics, where particle phase state was inferred from the room temperature properties of the bulk materials. Liq-uid particles had near-unit CEm, while solid particles had
much lower efficiencies (CEm=0.2 to 0.5). Matthew et al.
(2008) found phase state to govern particle bounce as well. Ammonium nitrate particles, thought to be metastable liquids at their experimental conditions (Lightstone et al., 2000), dis-played high CEm, while dry ammonium sulfate particles had
CEm=0.22, which increased to 0.73 when the particles were
hydrated and deliquesced. Matthew et al. (2008) also found that CEmfor dry ammonium sulfate increased as the
thick-ness of a liquid dioctyl sebacate coating layer increased. In some chamber experiments, Bahreini et al. (2005) showed this same increase in CEm for dry ammonium sulfate
parti-cles with condensation of an SOA layer. However, for other SOA experiments, CEmfor ammonium sulfate seed particles
actually decreased with the condensation of SOA, implying that the SOA phase state was highly variable in their experi-ments and/or that other factors also govern particle bounce in the AMS, such as composition or volatility. Similarly, Robin-son et al. (2015) showed that CE of liquid squalane (CE∼1) particles decreased following SOA condensation. Docherty et al. (2013) report an inverse relationship between CEm
for chamber-generated SOA and the f44/f57 ratio (where m/z44 is comprised of CO+2, whilem/z57 is comprised of the less oxidized marker fragments C4H+9 and C3H5O+, and fi is the fraction of m/zi to the total organic signal). This
implicates oxidation state as either a factor influencing CEm
or a proxy variable for what makes a particle bouncy. An even smaller number of studies have used the light-scattering single-particle (LSSP) module of the AMS to in-vestigate collection efficiency, despite its ability to provide a real-time, particle-number-based measurement ofEB. When ES andEL∼1, collection efficiency is equal to the bounce
collec-tion efficiency as CEp for “particle collection efficiency”,
which is defined as
CEp=
Particles with ion signal above threshold
All particles detected by LS . (3) Cross et al. (2007) first introduced LSSP as a method to re-solve real-time densities of externally mixed aerosols. Cross et al. (2009) later described the ability of LSSP to measure CEpfor ambient particles from Mexico City and found that
a significant fraction of the optically detected particles were either undetected by the mass spectrometer due to bounce (hereto referred to as “null”) or exhibited signal at a time much later than would be expected based on their in situ mea-sured velocity (referred to as “delayed”). “Prompt” particles, those that gave an appreciable chemical ion signal when they were expected to do so, made up only 23 % of the measured aerosol, with the delayed fraction at 0.26 and the null frac-tion at 0.51. Liu et al. (2013) also report CEp for ambient
measurements taken in Bakersfield, CA (Cal-Nex). They re-port a 0.46 prompt fraction, 0.06 delayed, and 0.48 null, and found a slight size dependence in the campaign-average CEp,
which exhibited a maximum arounddva=600 nm (0.52) and
a minimum (0.42) for large particles. Slowik et al. (2009) compared CEm (density-corrected scanning mobility
parti-cle sizer (SMPS)–AMS comparison) and CEpfor an ambient
biogenic SOA event, and found them to be equal.
Here we further explore the use of LSSP to identify the na-ture of collection efficiency for lab- and chamber-generated aerosols. We quantify particle bounce for SOA from α -pinene ozonolysis, as well as ammonium nitrate, ammonium sulfate, and d62-squalane. We illustrate the difference
be-tween mass-based and number-based CE, which are not nec-essarily the same even for monodisperse aerosol, due both to decreasing effective ionization efficiencies for delayed parti-cles (defined as ions per particle, or IPP) and mass that regis-ters at the detector on timescales much longer than the chop-per cycle. We show that IPP decreases with delay time, that CEpis not a function of size for the SOA in this study, and
that low-volatility and/or high oxidation state decreases CEp
for SOA.
2 Methods
2.1 Particle generation and sampling
We prepared inorganic aerosols (ammonium nitrate, ammo-nium sulfate) by atomizing dilute solutions (1 g L−1) using
a constant output nebulizer (aerosol generator model 3076; TSI, Inc.). We sent these particles through a krypton neutral-izer (10 mCi) and then size-selected them using a differential mobility analyzer (DMA; classifier model 3080; TSI, Inc.) before sampling.
We sampled size-selected SOA in this same manner, but with a different preparation procedure. We injected a 1.2 µL
aliquot of α-pinene (Sigma Aldrich, >99 %) into a clean and dry (RH<3 %) 100 L Tedlar sample bag (SKC, Inc.) at an estimated mixing ratio of∼2 ppm and charged the bag with excess ozone. This SOA formed at a high concentra-tion (COA≈1500 µg m−3). This allowed us to study
homoge-neously nucleated SOA with the single-particle capability of the AMS, as the scattering laser requires large (dva≥180 nm)
particles. However, the composition of SOA is loading-dependent, as demonstrated by Shilling et al. (2009), and so preparing SOA at this necessarily high concentration is a po-tential limitation of this work, as is often the case for lab-oratory studies of SOA systems. See Fig. 1 for the general experimental schematic.
We producedd62-squalane aerosols directly in the 12 m3
Carnegie Mellon University smog chamber, described else-where in greater detail (e.g., Robinson et al., 2015). In brief, we flushed the smog chamber continuously for>12 h with clean, dry air (cleaned with HEPA, silica-gel, and activated-carbon filters in series) to ensure low background parti-cle, organic vapor, and water vapor concentrations. We pre-paredd62-squalane particles by an evaporation–condensation
process within the smog chamber, using a small, resistive stainless-steel heater in situ. We placed a small aliquot of
d62-squalane (0.75 µL) on the heater surface, which we then
inserted into the smog chamber. Clean dispersion air flowed over the the heater to carry and mix thed62-squalane vapor
plume into the chamber while we power-cycled the heater for 10 min. Pured62-squalane particles formed as the squalane
vapor plume cooled.
We measured ensemble particle volume and number con-centrations using a SMPS (TSI, Inc.). We measured ensem-ble composition and mass with the high-resolution time-of-flight aerosol mass spectrometer (HR-ToF-AMS; Aerodyne, Inc,) operated in single-reflectron V-mode, fully described by DeCarlo et al. (2006). We acquired single-particle mass spectra using the LSSP module coupled to the HR-ToF-AMS. We analyzed single-particle AMS data using Sparrow 1.04D1and ensemble AMS composition data using SQUIR-REL 1.512.
Thermodenuder experiments were conducted using the Aerodyne thermodenuder (TD), based on the design of Huff-man et al. (2008, and fully detailed therein). Briefly, the TD consists of a heating section followed by a cooling diffusion denuder section to prevent recondensation. The TD temper-ature is controlled by proportional–integral–derivative (PID) controllers that adjust the power of three different strips of
1Sparrow 1.04A, written by D. Sueper, Aerodyne
Re-search Inc. and University of Colorado at Boulder; available at http://cires1.colorado.edu/jimenez-group/ToFAMSResources/ ToFSoftware/#Sparrow
2SQUIRREL 1.51, written by D. Sueper, Aerodyne
D M A 100 L chamber 100-L Chamber
10 m3 Smog
Chamber
Large dia. xfer line
SMPS HR/LS-ToF-AMS Temp-controlled Room
Temperature and RH sensor O3 Monitor
Heated injector O3 generator O2 Heated injector O3 generator O2 HR/LS-ToF-AMS HR/LS-ToF-AMS Size selection SMPS D M A 100-L Chamber 100-L Chamber
10 m3 Smog
Chamber
Large dia. xfer line
SMPS HR/LS-ToF-AMS Temp-controlled Room
Temperature and RH sensor O3 Monitor
Heated injector O3 generator O2 O3 O2 HR/LS-ToF-AMS HR/LS-ToF-AMS Size-selection SMPS Bypass TD
Figure 1.Experimental setup for SOA CE experiments.
1.0 0.8 0.6 0.4 0.2 0.0 N orma lize d re qu en cy of LS eve nts
3 4 5 6 7 8 9
1000 2 D (nm) 2000 1500 1000 500 0 d M /dlog 10 dmo b ( µ g m -3 ) d M /dlog 10 dva ( µ g m -3 ) SMPS AMS LS
Figure 2. Ensemble mass distributions from SMPS (black trace,
adjusted for density) and AMS (green trace) of size-selected α -pinene-derived SOA particles with 370 nm mobility diameter for an example SOA experiment. Frequency of optically counted particles (from LSSP) as a function of size shown in blue. For this instance, CEm=0.39. The blue trace is normalized to 1 and plotted on the
right axis so as to have the same height as the SMPS trace, reflect-ing that optical detection in the AMS flight chamber is not affected by particle bounce.
heating tape according to temperature measurements from three thermocouples inserted into the center of the TD tube. The ramp program increased temperature linearly over 1 h from 27 to 130◦C, soaked at 130◦C for 10 min, and then re-turned back to 27◦C at the same rate. Residence time in the heating section (calculated based on plug flow through the TD tube at ambient temperature) was∼30 s, which was de-termined by the combined flow rates of the AMS and SMPS. 2.2 Operation of light-scattering module
The LSSP module has been described in detail elsewhere in the literature (Cross et al., 2009). Briefly, the LSSP mod-ule consists of a continuous-wave laser (405 nm, 50 mW; LC BCL-050-405; CrystaLaser) that crosses the collimated particle beam within the time-of-flight region of the AMS. Scattered light from sampled particles is collected by an
ellipsoidal mirror that focuses the light onto a photomulti-plier tube. This light-scattering signal constrains the parti-cle’s velocity between the opening of the AMS chopper and the laser, allowing for the calculation of the vacuum aero-dynamic diameter. It also prompts collection of individual mass spectra over the entire chopper cycle (e.g., 200 spec-tra/chopper), allowing for the identification of signals from individual particles within the full chopper cycle. Saving at this data rate without the laser triggering (meaning all chop-per cycles, not just ones containing particles) is not practi-cally useful, as it results in an unmanageable data load. For example, when Drewnick et al. (2005) collected ToF-AMS single-particle data without any triggering mechanism, of the 2.41 GB of data they collected, only 4 MB represented mean-ingful single-particle spectra after applying their threshold-ing algorithm. The LSSP enables continuous sthreshold-ingle-particle detection at a high duty cycle for the long timescales of chamber studies or ambient sampling.
For data processing, we used an operationally defined light-scattering threshold of five (signal-to-noise ratio, SNR) to identify particle events and a mass threshold of six ions to identify a detected particle to be further considered for particle classification, similar to Liu et al. (2013). For am-monium sulfate, amam-monium nitrate, and SOA, we used Spar-row’s default ion list (m/z15, 30, 35, 36, 41, 43, 46, 48, 55, 57, 64, 71, 73, 80, 81, 98) for identifying particle events in the mass spectra of each chopper cycle. We used a different list of deuterated ions (m/z48, 50, 66, 82, 98) to identify MS events ford62-squalane particles. We processed a subset
of SOA experiments with an adjusted ion list based on the 13 highest-signal ions for SOA that do not have significant background interferences identified with MS mode spectra (m/z15, 26, 27, 29, 41, 42, 43, 44, 53, 55, 65, 67, 69, 79), but our collection efficiency results were not sensitive to this change.
At the number concentrations of the high-COASOA
where the threshold was equal to 5SNR of the scattered light trace) using the Sparrow analysis program. Coincident par-ticles were not considered in our analysis or calculation of CEp. It should be noted that, in the case where two or more
particles enter the same chopper cycle and are also the exact same size, the LS data analysis program fails at identifying coincidence. However, even at the highest number concen-trations used in these experiments, we estimate the probabil-ity of failing to identify these particles as coincident to be 0.4 %. Thus, we do not expect these false negatives to effect the results stated in this paper. For low number concentra-tions, e.g., those of typical smog chamber experiments, the chance of failing to identify coincidence is essentially zero. 2.3 Calculation of collection efficiency
We classified individual particle events based on how they interacted with the vaporizer, in terms of both their effective ionization efficiency and vaporization quickness. Null par-ticles are those that do not exceed the six-ion mass thresh-old, despite being identified as a particle event by exceed-ing the light-scatterexceed-ing threshold. As defined in Cross et al. (2009), particles categorized as prompt arrive at the mass de-tector within a narrow time range after they would be ex-pected to arrive based on their measured velocity in the PToF region and assuming instantaneous vaporization/ionization. The operationally defined boundary between the prompt and delayed particles is when the actual arrival of the mass signal is greater than the expected arrival time by 20 % or more. In other words, we compared the measured arrival time at the detector (MS arrival) and the LS-estimated arrival time (LS arrival) based on the measured velocity between the chop-per and laser to draw the boundary between prompt particles (MS arrival/LS arrival < 1.2) and delayed particles (MS ar-rival/LS arrival > 1.2). As we shall show, this particular value for determining the boundary between prompt and delayed particles is arbitrary.
LSSP provides an internal number-based measure of the AMS collection efficiency (Cross et al., 2009). The wide laser beam (≈2 mm), relative to the width of the parti-cle beam (≈0.5 mm), allows for near-complete optical de-tection of particles above the dede-tection limit of the laser (dva> 180 nm). The LSSP-based CEpis the comparison
be-tween the optically detected particles (i.e., all particles that enter the PToF region and that will hit the vaporizer surface) and the number of particles that are chemically detected (i.e., give signal in the mass spectrometer). For all particles sam-pled here,ESandELare reasonably assumed to be 1. Thus,
in terms of the categories prompt, delayed, and null, the gen-eral definition of CEpfrom Eq. (3) can re-written as
CEp=
Nprompt+Ndelayed
Nprompt+Ndelayed+Nnull
, (4)
where, e.g.,Npromptis the number of prompt particles. In this
formulation, we consider both prompt and delayed particles
as those that give meaningful chemical signals at the detec-tor, though it may be of interest in other studies to look at the CEp from, e.g., only prompt particles. We are equating
CEpwithEB, a reasonable assumption for the aerosols
stud-ied here as they all fall within the lens transmission window (EL=1) and are spherical (Zelenyuk et al., 2008) and
there-fore do not exhibit significant divergence from the particle beam (ES=1). However, it is important to note this
collec-tion efficiency accounts only for whether or not a particle was observed in the mass spectrometer and does not account at all for signal strength above the detection threshold. Ad-ditionally, while null particles do not count as meaningful in the LSSP determination of collection efficiency, the sum of many very weak signals from many null particles can result in meaningful mass in the more typical bulk measurement mode (MS mode) of the AMS.
3 Results and discussion
3.1 Delayed vaporization PToF artifact
It is standard practice to present comparisons between the mass-weighted size distribution from the SMPS and the PToF mass distribution from the AMS to compute density and collection efficiency (DeCarlo et al., 2004; Kostenidou et al., 2007; Shilling et al., 2009). The SMPS size distribu-tion is multiplied by the density to align the mode diameters according to
dva= ρp ρ0
dve
χ , (5)
where ρp is particle density; ρ0 is standard density
(1 g cm−3); andχis the dynamic shape factor, which is equal to 1 for spherical particles and is assumed to be true in the case of SOA fromα-pinene ozonolysis (Zelenyuk et al., 2008). For spherical particles,dve, the volume-equivalent
di-ameter, is equal to mobility diameter.
For this example experiment, where 370 nm SOA parti-cles were size-selected using a DMA, shown in Fig. 2, we estimate the density to be 1.1 g cm−3from aligning the mode diameters of the SMPS-calculated mass distribution with that from the AMS mass distribution measured in PToF mode. The shaded blue area is the frequency of optically counted particles as a function of size, as measured by light scatter-ing in the AMS. Like the SMPS distribution, this histogram is tight, as we expect it to be for size-selected particles. How-ever, even after shifting the SMPS distribution by the density, the agreement between the SMPS and AMS PToF distribu-tions degrades considerably at large diameters.
800 600 400 200 0 M S si gn al (b it-ns ) 3 2 1 0
Time of flight (ms) 0.4 0.3 0.2 0.1 0.0 LS si gn al ( A .U ) δ Δt d(PToF) vLS Lase r scatte r D el ay ed M S ar riv al C hop pe r (0 .0 7 ms w id e) E xp ec te d M S ar riv al
A B C D
Figure 3.Illustration of LS and MS signals for a typical delayed single particle in AMS. Scattered light signal (teal) and mass spec-trometer signal (orange) as a function of particle time of flight for an example delayed particle. The particle velocity (vLS) is calculated by the measured time between the start of the chopper cycle (point A) and detection of the scattered light peak (B). The velocity is used to estimate an expected arrival time of the chemical ion signal at the mass spectrometer (C) assuming prompt evaporation and ionization of the particle at the vaporizer. The difference between the expected (C) and actual (D) arrival times is denoted byδand allows for the operational definition of prompt and delayed particle events.
the LSSP AMS in Fig. 3 (similar to Fig. 7 in Cross et al., 2009). The scattered light pulse (teal trace) triggers acquisi-tion of mass spectra over the entire chopper cycle. Individual extractions from the mass spectrometer, which are averaged together over tens of seconds to minutes in typical bulk mode operation, are resolved at∼30 µs (the ToF-MS pulser period) in single-particle mode (orange trace). Using the distance be-tween the chopper and the point of intersection bebe-tween the laser and particle beams, a flight velocity is calculated and used to predict the arrival of the particle’s ions at the mass de-tector, assuming instantaneous vaporization and ionization. We show the mass signal as a function of time of flight for the chopper cycle in orange. For some particles, the arrival of the ions at the detector is significantly offset (delayed) from the predicted arrival time. This offset (labeled “δ” in Fig. 3) is used to categorize particles into prompt and delayed cate-gories, further discussed in Sect. 2.3.
Figure 4 shows total ion signals from individual particles (gray circles) along with total summed signals of prompt (blue) and delayed (red) particles as a function of time of flight. We see that the large-diameter PToF tail (green) col-lected in AMS PToF mode matches the delayed particle dis-tribution. Additionally, none of the prompt particles have measured times-of-flight greater than 4 ms. As described in Cross et al. (2009) for ambient OOA measured in Mexico City, the physical basis for the broadened PToF distribution at
Si gn al (A. U .) 5x10⁻³ 4 3 2 1
Time of flight (s) AMS PToF signal
All LSSP events Binned delayed signal Binned prompt signal
Figure 4. Size distribution comparison between bulk PToF and
prompt and delayed single particles. Particle signal versus particle time of flight from the chopper to the mass detector is shown for en-semble mode (green trace) and for all detected single-particle events (gray circles) in a representative SOA experiment (DMA size-selecting SOA particles with mobility diameter=370 nm). Particles are sorted into either prompt or delayed categories based on their delay time. The mass signals for individual particles within each category are binned by flight time and summed to create the prompt (blue trace) and delayed (red trace) distributions.
large diameters is particles with delayed vaporization, which comprise a significant fraction of the measured single parti-cles in this SOA experiment (19 % of all partiparti-cles). However, the mechanism of the delayed vaporization has not yet been fully described for SOA fromα-pinene+O3.
3.2 Collection efficiency
The average CEp across all SOA experiments was 0.30
(±0.04), while the average CEmwas 0.49 (±0.07). We
calcu-lated CEmusing Eq. (1), whereSAMSis the AMS-measured
mass from MS mode andSOis the density-corrected
SMPS-measured mass. Like Cross et al. (2009), we see that CEm
> CEp, which likely reflects two differences between the
0.14
0.12
0.10
0.08
0.06
0.04
0.02
0.00
N
orma
lize
d
fre
qu
en
cy
(p
er
ca
te
go
ry
ba
si
s)
300 250 200 150 100 50 0
Ions per particle 1.0
0.8 0.6 0.4 0.2
Null Delayed Prompt Null IPP threshold
Figure 5. Histogram of ions per particle for null, delayed, and prompt SOA particles. Histogram of ions per particle for null (gray), delayed (red), and prompt (blue) particle categories for 370 nm SOA particles. Theyaxis is the frequency of single-particle events within each category (in other words, all data for each category sum to 1). The histogram bars for the delayed category are offset (by five ions) on thexaxis for clarity.
longer than the chopper cycle, as evinced by CEmbeing
sig-nificantly greater than CEp.
Secondly, some particles that would register mass above the LSSP threshold may be delayed such that their mass sig-nal registers at the detector just beyond the chopper cycle. As depicted in Fig. 4, the delay times for some particles are just beyond the chopper cycle window that we used for these experiments, as there are still mass signals arriving at the very right edge of the plot where the cycle ends. It should be noted that the length of the chopper cycle used in these experiments was not optimal and that a longer cycle would allow us to see the most-delayed particles. We recommend a long chopper cycle for ambient measurements and/or any experiments where delayed particles may be expected. For aerosol types with a high delayed fraction like this SOA, a longer chopper cycle would better accommodate these parti-cles with long (2 ms) delay times. Thus, while LSSP provides an in situ measurement of the AMS collection efficiency, it is important to distinguish between the LSSP-based (Eq. 4) and mass-based (Eq. 1) calculations of collection efficiency. 3.3 Delayed particle signal strengths
Despite nearly equal numbers of prompt (17 % of all par-ticles) and delayed particles (19 % of all parpar-ticles) for this SOA, these two particle categories do not contribute equal mass signal to the detector. As shown in Fig. 5, prompt par-ticles produce significantly more signal per particle than de-layed particles even though they are all the same nominal size. We plot in Fig. 5 a histogram of IPP, normalized so that the sum of the bins for each category is 1. This figure shows that the effective ionization efficiency for prompt
par-200
150
100
50
0
A
ve
ra
ge
io
ns
pe
r
pa
rt
ic
le
(
pe
r
bi
n)
15 10 5 0
Upper limit of distance bounced (cm)
2.0 1.5 1.0 0.5 0.0
Delay time (ms)
Prompt Delayed
Calculated (RIE = 1.4) Average (prompt & delayed)
Figure 6.Average ions per particle as a function of delay time for SOA. Ions per particle as a function of the delay time between the expected time of arrival for the chemical ion signal and the actual time of arrival for 370 nm SOA particles. The data points are the arithmetic mean IPP value for a given delay time bin. Error bars are the standard error of the mean for each bin, which represent the precision of the average IPP values. The gray shadow behind is the standard deviation of ions per particle within each bin, which re-flects the inherent spread of single-particle signals at a given delay time for monodisperse SOA. Dotted line shows the average IPP for the entire ensemble, while the solid line shows the calculated IPP based on an ionization efficiency (IE) of 5e-7 and an RIE of 1.4 for organics compared to ammonium nitrate. We also estimate the nominal distance bounced (topxaxis) for these particles, assum-ing completely elastic collisions with the vaporizer and surround-ing surfaces and the average velocity of the size-selected particles measured between the chopper and laser.
ticles is higher than that of delayed particles. Note that this “effective” ionization efficiency is not only a function of the ionization efficiency of the molecules being ionized by the 70 eV source (a molecular property), but it also convolves the instrument sensitivity to particles that may be vaporized in a sub-optimal location (for ion formation and extraction). If delayed and prompt particles had the same IPP, the de-layed vaporization tail in the AMS mass distribution for SOA shown in Fig. 2 would be even more pronounced.
Figure 7.Cumulative particle counts as a function of delay time for SOA, NH4NO3, (NH4)2SO4,d62-squalane, and SOA.(a)Cumulative
probability distributions of particle counts as a function of delay time for ammonium nitrate (blue),d62-squalane (purple), ammonium sulfate
(red), and SOA (green). All traces are normalized by the respective CEpvalues, which are the average value across all experiments for that
particle type.(b)Cumulative probability distributions for single-particle counts (dark green) and single-particle mass (light green) for an individual SOA experiment. The dark green trace is scaled by CEp. The light green trace, up to 2.5 ms delay time, is scaled by the mass
collection efficiency as determined by comparing the AMS-PToF-determined mass to the SMPS mass (denoted CEm’), according to Eq. (1).
The broken axis represents additional mass seen beyond the window of the chopper cycle, and that mass is scaled according to the mass collection efficiency determined by the AMS mass seen in MS mode compared to the SMPS mass (CEm).
600
400
200
0
Si
gn
al
(
A
.U
.)
1.5 1.0 0.5 0.0 -0.5
Time from maximum MS arrival (ms)
400
300
200
100
0
Si
gn
al
(A
.U
.)
Prompt SOA
PToF = 3.21 ms (N = 257 particles)
Delayed SOA
PToF = 4.05 ms (N = 82 particles)
30
25
20
15
10
5
0
Si
gn
al
(A
.U
.)
3.0 2.0 1.0 0.0
Time from maximum MS arrival (ms)
600
400
200
0
Si
gn
al
(
A
.U
.)
600 °C NH4NO3 PToF = 3.12 ms (N = 304 particles)
200 °C NH4NO3 PToF = 3.39 ms (N = 40 particles)
(a) (b)
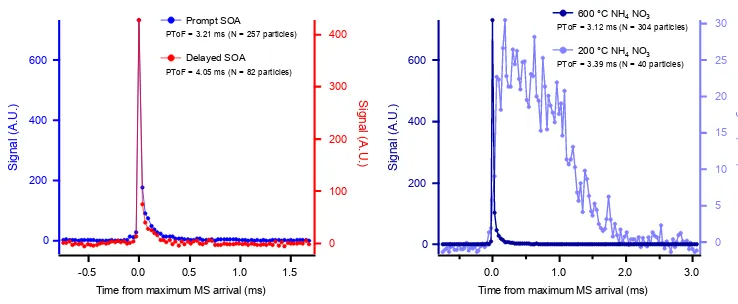
Figure 8.Mass spectral signal profiles for two (prompt and delayed) PToF arrival times for SOA. Profiles of single-particle mass arrival for SOA(a)and ammonium nitrate particles(b)under different vaporization scenarios.(a)Plot shows total chemical ion detection as a function of time from arrival of maximum signal for SOA. The traces represent the average signal for all particles with the same MS arrival time. The two arrival time bins shown correspond to either all prompt (PToF bin=3.21 ms, blue trace) or delayed (PToF bin=4.05 ms, red trace) particles. N is the number of particles used to make the average trace.(b)Similarly, average chemical signals as a function of arrival time are shown for ammonium nitrate particles at two different vaporizer temperatures. The arrival of mass at the detector (event length) is significantly longer for ammonium nitrate at 200 compared to 600◦C.
It should be noted here that, as is done in most analysis of AMS data, converting from the nitrate-equivalent mass to the absolute mass measurement for a given non-refractory species (e.g., organics, sulfate, chloride) requires the applica-tion of species-specific values of both CE and RIE (see, e.g., Eqs. 3.8 and 3.9 in Alfarra, 2004). Thus, any measurement of CE also has inherent value regarding understanding RIE for a given species. Figure 6 illustrates this, as the measured
well known. Given that LSSP measures CE inherently, easier and more routine measurements of species-specific RIE val-ues, especially in ambient datasets, should be made possible with application of the LSSP module.
Plotting the accumulated particle counts as a function of delay time shows how single-particle information from LSSP mode can be used to best understand the response of the AMS to different particle types, each with its own sensitiv-ity in the instrument (Fig. 7). We scale the traces in Fig. 7a by their measured CEp values (from Eq. 4). The effect of
delay time on IPP is absent for ammonium nitrate, the stan-dard mass calibrant for the AMS, because all particles arrive within the first few delay time bins. D62-squalane, a liquid at
room temperatures with a near-unit CEp, largely accumulates
its signal at small delay times as well but is slightly slower to do so than ammonium nitrate. We speculate that this differ-ence may be attributable both to the lower volatility ofd62
-squalane and to the larger molecular weight ofd62-squalane
(423 g mol−1) compared to ammonium nitrate (80 g mol−1). We estimate thed62-squalane vapor pressure using SIMPOL
(Pankow and Asher, 2008) and use the ammonium nitrate va-por pressure reva-ported by Richardson and Hightower (1987): ammonium nitrate is more volatile thand62-squalane (∼30
and ∼0.1 µg m−3, respectively). Saleh et al. (2016) calcu-lated the differences in evaporation timescales in the AMS vaporizer for species of different volatility, while Murphy (2015) discussed the molecular weight dependence on the movement of ions from the ion source to the ion optics re-gion in a free molecular regime. Unlike both ammonium ni-trate andd62-squalane, which accumulate signal at very short
delay times despite their differences, SOA exhibits substan-tial delayed vaporization and low CEp. The SOA in this study
behaves similarly to crystalline ammonium sulfate, a possi-ble indication of a solid or semi-solid phase state, extremely low-volatility material, or both.
Figure 7b shows how the total mass signal from single SOA particles accumulates faster than the particle counts as a function of delay time, as particles with low delay times contribute relatively more mass signal on average. The ac-cumulation of single-particle counts is scaled by CEp, while
the single-particle mass accumulation trace is scaled by CEm.
We use CE’m to denote the mass collection efficiency
cal-culated by comparing the AMS PToF vs. SMPS mass, and CEmto denote the mass collection efficiency calculated
ac-cording to Eq. (1). The difference between CE’mand CEmis
the amount of mass measured at timescales longer than the chopper cycle.
3.4 Nature of particle–vaporizer interactions
These results seem to indicate that, when an aerosol type ex-hibits bounce, it also exex-hibits delayed vaporization and thus lower effective ionization efficiency for some fraction of par-ticles. In investigating the offset between expected and ac-tual arrival times, we tested two ideas about how the signal
at the mass detector would arrive for SOA within the LSSP chopper cycle. If an SOA particle strikes and adheres to the vaporizer surface but does not promptly vaporize, it should show an accumulation of mass at the detector over time, be-ginning at the expected arrival time. However, if the particle bounces off the vaporizer without any significant evaporation and somehow returns to a hot surface at a later time, then the time-resolved arrival of ions should look similar to a prompt particle that vaporizes upon impact, albeit after some time associated with its bouncy journey.
Indeed, when the mass arrival signals for an ensemble of single-particle events are averaged together, we see that prompt and delayed SOA particles have the same peak shape (Fig. 8a). Here, we display the average single-particle mass signal for particles with the same arrival time. We chose two arrival-time bins with times-of-flight equal to 3.21 and 4.05 ms. All particles in each bin are categorized as prompt and delayed, respectively. The similar, sharp peak shape sug-gests that delayed particles are truly delayed in starting their vaporization process and not simply evaporating at a slower rate. Drewnick et al. (2015) present the vaporization “event length” quantity, which is the full width at half maximum (FWHM) of mass arrival signals from individual particles. In our study, the time resolution of the mass arrival trace (de-termined by the pulser period, 30 µs) is on the same order as the event length, which does not allow us to quantify the event length with any precision. It should be noted that the pulser period used in this work is a limitation; a faster pulser period should be used for future similar work, as it would al-low for proper quantification of the event length. However, qualitatively we can say that prompt and delayed particles for the SOA presented here have similar event lengths and are on the order of∼30 µs, similar to those measured by Drewnick et al. (2015) for ammonium sulfate aerosol. We found nearly identical event lengths for prompt versus de-layed ammonium sulfate as well, indicating that ammonium sulfate exhibits the same behavior of “flash vaporizing” even when the particles are delayed. The event length for ammo-nium nitrate aerosol at low vaporizer temperatures, however, is fundamentally different (see Fig. 8b); mass arrives over a much longer timescale (1 ms), indicating that particles are sticking to the vaporizer and slowly losing mass. Thus we conclude that delayed SOA, as well as ammonium sulfate, particles are bouncing around the ionization cage after ini-tially striking the front of the vaporizer before they finally land and flash-vaporize on one of the hot surfaces in the va-porization region (e.g., side of the vaporizer, ionization cage). Our conclusion is the same as that of Cross et al. (2009), who identified this mechanism acting on delayed particles in am-bient measurements in Mexico City.
The AMS vaporizer is a cylindrical tube furnace (r=3.81;
The front end of the vaporizer is set back∼10 mm from the front opening of the ion cage and∼2 mm from the ion ex-traction volume, maximizing the intersection of the vapor-ized particle plume, the electron beam from the filament, and the axis of ion extraction. Because of the long hot surface of the vaporizer, which is housed inside a sheet metal cage, this mechanistic picture of particles bouncing around this region before finally landing on a hot surface is plausible. Impor-tantly, for this SOA, the actual vaporization of the particle still can be thought of as rapid – when the particle finally does stick, it is vaporized and ionized on the same timescale as a prompt particle. Thus, the “PToF broadening” shown in Fig. 2 can be attributed to SOA particles bouncing around before vaporizing, not slowly boiling off adsorbed material over time, as discussed in Salcedo et al. (2010) for lead salts (e.g., PbCl+) and in Drewnick et al. (2015) for sea salt and other semi-refractory components (e.g., ZnI2). Furthermore,
this explanation is consistent with the decrease in IPP as a function of delay time: when particles vaporize on, e.g., the side of the vaporizer, they are in a sub-optimal position for ionization of the resulting vapor plume and thus detection of the full single-particle mass (Huffman et al., 2009). From Fig. 6, the decrease in IPP with delay times up to 1 ms indi-cates an increasingly sub-optimal average vaporization loca-tion for the particle with respect to the ionizaloca-tion region. For long delay times (> 1 ms), the likelihood of the particle land-ing near the ionization region becomes very low, but further delay does not influence the effective ionization efficiency. As indicated by a wide spread of IPP values for a given delay time in Fig. 6, it is very unlikely that a long-delayed particle can provide as many ions to the mass detector as the average prompt particle can.
In Fig. 6 we also show a secondary x axis of distance bounced based on the nominal particle velocity. This is the distance traveled after the initial particle impact on the va-porizer, assuming elastic scattering as the particle bounces. Work by Xu et al. (1993) and Miyakawa et al. (2013) shows that there are velocity losses for submicron particle collisions with surfaces, though the range of velocity loss appears to be a complex function of particle composition, incident angle of the collision, and other factors. Thus, while our assumption of completely elastic collisions is flawed, it does provide a back-of-the-envelope measure of the upper limit of distance bounced by these particles. This inferred distance is much longer than the length scales of the vaporizer and ionization cage. We thus conclude that the particles are probably lit-erally bouncing randomly around the ionization region, im-pelled by surfaces that are rough at the length scale of the particles. The topxaxis of Fig. 6 shows our upper-limit esti-mate for the nominal distance bounced for these 370 nm par-ticles. We used the average measured velocity of the prompt particles, as measured between the chopper and laser. When comparing the length scales (∼1 cm) of the ionization cage and vaporizer with our estimated distance bounced based on delay times, the most delayed particles experience many
col-lisions with ionizer/vaporizer surfaces before finally vaporiz-ing.
As a further check that the SOA particles measured in LSSP mode are rapidly vaporizing – just simply doing so at a time later than would be expected based on their mea-sured size and expected time of flight – we increased the temperature of the vaporizer from 600 to 800◦C. Were the particles sitting on the vaporizer surface and slowly boil-ing, we would expect this temperature increase to decrease the broadened PToF tail (Fig. 9a). We do not see this effect (note: the degradation in the organic PToF signal at 800◦C is due to low particle numbers at the end of our experiment due to wall loss). However, when we coated SOA particles withd62-squalane, a liquid at STP and a material that
ex-hibits essentially no particle bounce in the AMS (CEp∼1),
the broadened tail of the SOA mass distribution diminished, as shown in Fig. 9c. When we heated the chamber, causing thed62-squalane to evaporate, the broadened tail reappeared.
This further supports this idea that delayed SOA particles are bouncing around the vaporizer–ionizer region before finally flash-vaporizing (Fig. 9b).
On the other hand, the PToF distribution for ammonium nitrate can be broadened by decreasing the vaporizer tem-perature from 600 to 200◦C. Figure 9b shows the mass dis-tribution ofm/z46 (NO+2) for both vaporizer temperatures. The increase in PToF arrival times (which translates to the broadened mass distribution for the dominant mode of par-ticles) with decreased vaporizer temperature indicates that these particles do stick to the surface and have a reduced mass flux at lower temperatures, thus spreading the signal arrival out over time of flight (Fig. 9b). The secondary mode of ammonium nitrate particles shown in Fig. 9b is multiply charged, larger particles. Docherty et al. (2015), operating their vaporizer temperature on a programmed cycle between 200 and 600◦C, also see PToF broadening for nitrate in am-bient data. Mass arrival signals from individual ammonium nitrate particles at these low vaporizer temperatures (shown in Fig. 8b) are much longer (event lengths∼200 µs, con-sistent with those measured by Drewnick et al., 2015) than those shown for prompt and delayed SOA particles in Fig. 8a. There seem to be different mechanisms for particle delay both for different operating conditions of the AMS and for different particle types.
Figure 9.Ensemble mass distributions of different particle types.(a)Organic mass distributions forα-pinene-derived SOA particles at two different vaporizer temperatures with DMA-selected mobility diameter of 370 nm: 600 (green) and 800◦C (brown). Note: the degraded signal at 800◦C is due to low particle numbers due to smog chamber wall loss, as these data were taken at the end of an experiment where particle number was relatively low.(b) m/z46 PToF mass distributions for DMA-selected mobility diameter of 300 nm at the standard vaporizer temperature (600◦C, dark blue) and low temperature (200◦C, sky blue).(c)m/z43 mass distributions from SOA particles at three stages of a mixed-particle experiment: homogeneously nucleated SOA (teal), SOA particles coated withd62-squalane (red), and SOA/d62-squalane
particles after an increase in chamber temperature (purple). Note the disappearance of the delayed tail with the condensation ofd62-squalane
and the reappearance of the tail with heating despite the decrease in mode diameter.
-0.06 -0.04 -0.02 0.00 0.02 0.04 0.06
D
iff
ere
nce
MS
100 80 60 40 20 0
m/z
C4H7O +
C2H3O +
C5H7O +
C6H9O +
C3H3 +
C4H5 +
C5H7 +
C6H7 +
-0.04 -0.02 0.00 0.02 0.04
Differ
en
ce
MS
100 80 60 40 20 0
m/z
H2O
+ SO+
SO2 +
H2SO4 +
HSO3 +
NH3 +
(a) (b)
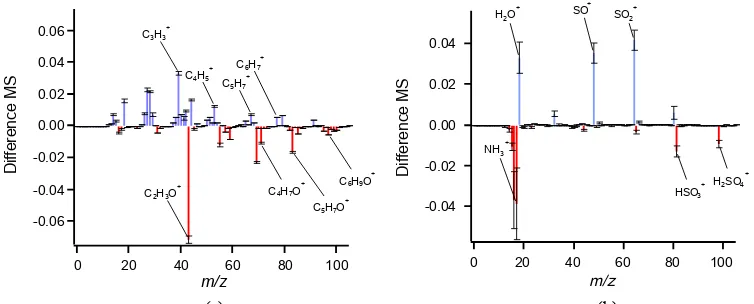
Figure 10.Difference plots between prompt and delayed average mass spectra for(a)SOA and(b)ammonium sulfate. Plot is prepared by first normalizing each spectrum by the total signal and then subtracting the normalized delayed MS from the normalized prompt MS. Thus, mass fragments with positive values (blue) are enriched in the prompt MS, and those with negative values (red) are enriched in the delayed MS. Error bars are the propagated standard errors of the mean for each population.
normalized delayed MS. Error bars indicate the propagated standard error of the mean at eachm/z.
Several fragments are more prominent in either the prompt or delayed mass spectra, colored by blue and red sticks, re-spectively. For instance,m/z43 (mostly C2H3O+) is higher
andm/z44 (CO+2) is lower for delayed SOA particles; the acidic fragmentsm/z81 (HSO+3) and 98 (H2SO+4) are higher
in the delayed MS for ammonium sulfate particles, while
m/z48 (SO+) and 64 (SO+2) are higher in the prompt MS for ammonium sulfate. The water ion (H2O+) is enhanced in
the prompt MS, while ammonia (NH+3) is enhanced in the de-layed MS for ammonium sulfate particles. We attribute these differences in mass spectra between prompt and delayed par-ticles to the wide range of possible temperatures experienced by delayed particles that have bounced away from the
cen-ter of the AMS vaporizer. The lower temperatures at these sub-optimal vaporization positions (e.g., side of the vapor-izer, on the ion cage) can lead to different thermal decom-position pathways, which could be important for interpreting ambient single-particle spectra.
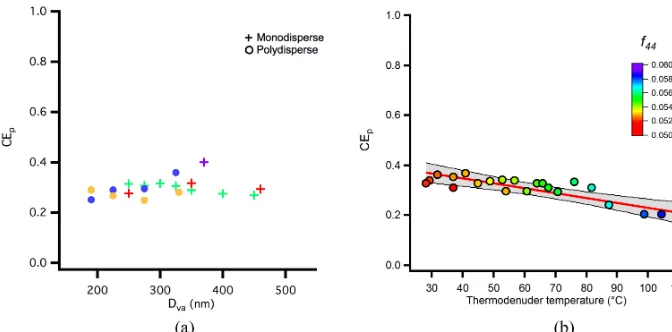
Figure 11.Collection efficiency of SOA as a function ofDvaand thermodenuder temperature.(a)Particle collection efficiency as a function
of Dvafor all SOA experiments. Data are from both size-selected experiments (crosses) and polydisperse SOA from a smog chamber (circles),
with each color representing a separate experiment.(b)Particle collection efficiency for 370 nm size-selected particles (colored markers) as a function of thermodenuder temperature for an example SOA experiment, colored by the fraction ofm/z44 (f44) to the total organic mass
measured in MS mode. Confidence intervals (95 % CI) for a linear fit are shown (slope:−0.0020◦C−1).
increased O : C. While f44 is slightly higher in our prompt
SOA MS, perhaps indicating that the prompt particles appear more oxidized, the rest of the mass spectrum shows that the delayed particles are enhanced in oxidized fragments, while the prompt particles are enhanced in reduced fragments. We see an enhancement in the delayed MS of CxHyO
frag-ments, such as m/z71 (C4H7O+),m/z83 (C5H7O+), and m/z97 (C6H9O+). Other studies have found thatf44 does
not change or even decreases with lower vaporizer temper-atures than the standard 600◦C; for example, Canagaratna et al. (2015) showed that f44 decreases in the MS of cis
-pinonic acid at 200◦C compared to the standard vaporizer temperature. Thus, the enhancement of these CxHyO+
frag-ments in the delayed MS is a more robust indicator thanf44
that our delayed SOA particles appear more oxidized than the prompt ones. Excludingf44, our data are consistent with
Docherty et al. (2015) and the hypothesis that our delayed particles are bouncing around the vaporization/ionization re-gion before landing on cooler surfaces and finally evaporat-ing. Importantly, these data show that particles delayed due to particle bounce, like ammonium sulfate and the SOA studied here, can have differences in their mass spectra that need to be considered when analyzing ambient single-particle data. 3.5 Collection efficiency as a function of size and
thermodenuder temperature
As reported previously in the literature, some studies have shown collection efficiency for OA to be size- (Liu et al., 2013) and composition-dependent (Docherty et al., 2013). To investigate any size-dependent collection efficiency that our SOA might have, we selected particles at different mobil-ity diameters with a DMA upstream of the AMS. Figure 11a shows CEpas a function of selected mobility diameter. LSSP
can also provide a size-resolved CEpfor polydisperse aerosol
(as in Liu et al., 2013), as each optically counted particle has an estimateddva, estimated from the time of flight between
the chopper and the laser. Importantly, this measure of size is unaffected by any vaporization delays and can be com-pared across LS particle categories (e.g., prompt, delayed, null). Figure 11a also shows CEpfor polydisperse SOA from
multiple smog chamber experiments, which agree well with the size-selected data. The CEp for SOA studied here was
not a strong function of size between in diameter range 170– 460 nm. The mean CEpacross all experiments for SOA was
0.3 (±0.04 SD) and ranged from as low as 0.25 to as high as 0.4. Mobility diameters for the monodisperse experiments were adjusted according to Eq. (5), so CEpvs. size data could
be on the same scale.
While CEpfor this SOA is independent of size, we do
ob-serve a decreasing trend in CEpby passing the SOA through
a thermodenuder. We sampled SOA alternately through a thermally denuded line, or through a bypass line of the same length held at the same temperature as the chamber. Fig-ure 11 shows CEp plotted against thermodenuder
tempera-ture for an experiment where SOA particles passed through a thermal denuder operating on a temperature ramp profile. Above 110◦C, almost all SOA evaporated in the thermode-nuder, making the CEpmeasurement impossible due to small
particle size. The CEp values in Fig. 11 are calculated for
particles with 200 nm > dva> 300 nm to isolate the effects of
volatility and/or oxidation state on CEp, instead of
measur-ing smaller particles less likely to provide enough detectable mass above the threshold.
more-volatile components removed, the amount of which in-creases with increasing temperature. We color data points in Fig. 11 byf44as measured from MS mode bulk mass
spec-tra, which is used in AMS analysis as both a direct measure-ment of oxidation state and a proxy for OA volatility (Ng et al., 2011). These data show that CEpis inversely related
to either the SOA oxidation state, volatility, or both. These results are consistent with the trend shown by Docherty et al. (2013), who saw decreasing CEmwith increasing oxidation
state, though they are within the range of scatter shown in Fig. 11a for all SOA experiments. It should be noted that this SOA is similarly oxidized (f44/f57≈6) and has similar CEm
values (CEm∼0.2–0.4) to much of the SOA in their study.
SOA sampled through the bypass line during this same time period did not have any decrease in CEp. It is not possible
to determine whether the decrease in CEpis attributable to
changes in volatility or oxidation state, as the two are cou-pled in our measurements. However, this example shows that LSSP can be used to verify whether this trend in CEpwith
these compositional changes exists for other types of NR-PM1.
4 Conclusions
In this study, we present LSSP AMS data that give further insights into the nature of collection efficiency for the com-mon laboratory system of SOA from αpinene+O3. SOA
generated in these experiments exhibited an artificial tail in the PToF distribution at large diameters, which we show to be an artifact of delayed vaporization. By studying the ar-rival of mass signals for these delayed SOA particles using LSSP data, we see that the signals cannot be attributed to adsorption on the AMS vaporizer followed by slow evapo-ration. Rather, particles bounce off the vaporizer after pri-mary impact and vaporize on some subsequent impact with a hot surface in the vaporization and/or ionization region. This causes the mass arrival at the detector to be delayed relative to the estimated speed from optical detection but is funda-mentally different than slow evaporation from the vaporizer surface. A significant fraction of SOA and ammonium sulfate exhibited this type of delayed vaporization, while ammonium nitrate and d62-squalane exhibited none. For delayed
parti-cles, the measured per-particle mass signal is reduced, which we report as ions per particle as a function of delay time. The artificially broadened PToF distributions would be even more prominent if the delayed particles had the same effec-tive ionization efficiency as prompt particles. Some of the SOA particles counted as null evidently evaporate on very long timescales relative to the chopper cycle, as indicated by CEm> CEp. Null particles register no mass signal in LSSP
mode, though what fraction of them will result in detectable mass on the long timescale of MS mode is not discernible us-ing these data. CEmfor SOA across all experiments was 0.49
(±0.07 SD), while CEpwas 0.30 (±0.04 SD). We were
un-able to explain the reason for the variability in CEpbetween
different experiments.
The reduced number of ions per particle of delayed parti-cles means that the AMS PToF signal for polydisperse distri-butions will be dominated by prompt particles, because larger prompt particles with high IPP will overwhelm smaller de-layed particles with lower mass and few ions per unit mass. However, the large diameter tail in AMS PToF distributions should be regarded with caution. Lastly, we use the LSSP to show that particle collection efficiency is not a function of size for the size range of SOA explored (170< dm<460 nm)
but is related to SOA oxidation state and or volatility. Rather than being viewed as a limitation, collection ef-ficiency should be viewed as a sensitivity within the AMS that simply needs to be understood for a given system and that may provide additional useful information. We demon-strate here that using the LSSP capabilities of the AMS al-lows users to gain further insight into a given aerosol system, such as SOA fromα-pinene ozonolysis. Further work should be conducted to better understand any compositional artifacts that may be attributable to delayed vaporization for other sys-tems. Data of this kind may also possibly be used for design improvements to the vaporization region.
Data availability. Data used in this study can be made available
upon request to the author.
Competing interests. The authors declare that they have no conflict
of interest.
Acknowledgements. This research was supported by grant
CHE1412309 from the National Science Foundation. The high-resolution aerosol mass spectrometer was purchased with Major Research Instrumentation funds from grant CBET0922643 through the National Science Foundation and generous support of the Wallace Research Foundation. The authors would like to thank Rawad Saleh, Manjula Canagaratna, John Jayne, and Eben Cross for useful discussions regarding data analysis. Thanks to John-Charles Baucom for his help with the design and construction of the vaporizer used to prepare squalane aerosol.
Edited by: P. Herckes
Reviewed by: two anonymous referees
References
Primary, Secondary, and Ambient Organic Aerosols with High-Resolution Time-of-Flight Aerosol Mass Spectrometry, Environ. Sci. Technol., 42, 4478–4485, 2008.
Alfarra, M. R.: Insights Into Atmospheric Organic Aerosols Using an Aerosol Mass Spectrometer, PhD thesis, University of Manch-ester, 2004.
Bahreini, R., Keywood, M. D., Ng, N. L., Varutbangkul, V., Gao, S., Flagan, R. C., Seinfeld, J. H., Worsnop, D. R., and Jimenez, J. L.: Measurements of Secondary Organic Aerosol from Oxidation of Cycloalkenes, Terpenes, and m-Xylene Using an Aerodyne Aerosol Mass Spectrometer, Environ. Sci. Technol., 39, 5674– 5688, 2005.
Canagaratna, M. R., Jayne, J., Jimenez, J. L., Allan, J. D., Alfarra, M. R., Zhang, Q., Onasch, T. B., Drewnick, F., Coe, H., middle-brook, A., Delia, A., Williams, L. R., Trimborn, A. M., North-way, M. J., DeCarlo, P. F., Kolb, C., davidovits, P., and Worsnop, D. R.: Chemical and microphysical characterization of ambi-ent aerosols with the aerodyne aerosol mass spectrometer, Mass Spectrom. Rev., 26, 185–222, 2007.
Canagaratna, M. R., Jimenez, J. L., Kroll, J. H., Chen, Q., Kessler, S. H., Massoli, P., Hildebrandt Ruiz, L., Fortner, E., Williams, L. R., Wilson, K. R., Surratt, J. D., Donahue, N. M., Jayne, J. T., and Worsnop, D. R.: Elemental ratio measurements of organic compounds using aerosol mass spectrometry: characterization, improved calibration, and implications, Atmos. Chem. Phys., 15, 253–272, doi:10.5194/acp-15-253-2015, 2015.
Craven, J. S., Yee, L. D., Ng, N. L., Canagaratna, M. R., Loza, C. L., Schilling, K. A., Yatavelli, R. L. N., Thornton, J. A., Ziemann, P. J., Flagan, R. C., and Seinfeld, J. H.: Analysis of secondary organic aerosol formation and aging using positive matrix fac-torization of high-resolution aerosol mass spectra: application to the dodecane low-NOxsystem, Atmos. Chem. Phys., 12, 11795–
11817, doi:10.5194/acp-12-11795-2012, 2012.
Cross, E. S., Onasch, T. B., Canagaratna, M., Jayne, J. T., Kimmel, J., Yu, X.-Y., Alexander, M. L., Worsnop, D. R., and Davidovits, P.: Single particle characterization using a light scattering mod-ule coupled to a time-of-flight aerosol mass spectrometer, At-mos. Chem. Phys., 9, 7769–7793, doi:10.5194/acp-9-7769-2009, 2009.
Cross, E. S., Slowik, J. G., Davidovits, P., Allan, J. D., Worsnop, D. R., Jayne, J. T., Lewis, D. K., Canagaratna, M., and Onasch, T. B.: Laboratory and Ambient Particle Density Determinations using Light Scattering in Conjunction with Aerosol Mass Spec-trometry, Aerosol Sci. Tech., 41, 343–359, 2007.
DeCarlo, P. F., Slowik, J. G., Worsnop, D. R., Davidovits, P., and Jimenez, J. L.: Particle Morphology and Density Characteriza-tion by Combined Mobility and Aerodynamic Diameter Mea-surements, Part 1: Theory, Aerosol Sci. Tech., 38, 1185–1205, 2004.
DeCarlo, P. F., Kimmel, J. R., Trimborn, A., Northway, M. J., Jayne, J. T., Aiken, A. C., Gonin, M., Fuhrer, K., Horvath, T., Docherty, K. S., Worsnop, D. R., and Jimenez, J. L.: Field-Deployable, High-Resolution, Time-of-Flight Aerosol Mass Spectrometer, Anal. Chem., 78, 8281–8289, 2006.
Docherty, K. S., Jaoui, M., Corse, E., Jimenez, J. L., Offen-berg, J. H., Lewandowski, M., and Kleindienst, T. E.: Collec-tion Efficiency of the Aerosol Mass Spectrometer for Chamber-Generated Secondary Organic Aerosols, Aerosol Sci. Tech., 47, 294–309, 2013.
Docherty, K. S., Lewandowski, M., and Jimenez, J. L.: Effect of Vaporizer Temperature on Ambient Non-Refractory Submicron Aerosol Composition and Mass Spectra Measured by the Aerosol Mass Spectrometer, Aerosol Sci. Tech., 3811–3830, 2015. Drewnick, F., Schwab, J. J., Hogrefe, O., Peters, S., Husain, L.,
Dia-mond, D., Weber, R., and Demerjian, K. L.: Intercomparison and evaluation of four semi-continuous PM2.5 sulfate instruments, Atmos. Environ., 37, 3335–3350, 2003.
Drewnick, F., Hings, S. S., DeCarlo, P., Jayne, J. T., Gonin, M., Fuhrer, K., Weimer, S., Jimenez, J. L., Demerjian, K. L., Bor-rmann, S., and Worsnop, D. R.: A New Time-of-Flight Aerosol Mass Spectrometer (TOF-AMS) – Instrument Description and First Field Deployment, Aerosol Sci. Tech., 39, 637–658, 2005. Drewnick, F., Diesch, J.-M., Faber, P., and Borrmann, S.: Aerosol
mass spectrometry: particle-vaporizer interactions and their con-sequences for the measurements, Atmos. Meas. Tech., 8, 3811– 3830, doi:10.5194/amt-8-3811-2015, 2015.
Huffman, J. A., Jayne, J. T., Drewnick, F., Aiken, A. C., Onasch, T., Worsnop, D. R., and Jimenez, J. L.: Design, Modeling, Optimiza-tion, and Experimental Tests of a Particle Beam Width Probe for the Aerodyne Aerosol Mass Spectrometer, Aerosol Sci. Tech., 39, 1143–1163, 2005.
Huffman, J. A., Ziemann, P. J., Jayne, J. T., Worsnop, D. R., and Jimenez, J. L.: Development and Characterization of a Fast-Stepping/Scanning Thermodenuder for Chemically-Resolved Aerosol Volatility Measurements, Aerosol Sci. Tech., 42, 395– 407, 2008.
Huffman, J. A., Docherty, K. S., Aiken, A. C., Cubison, M. J., Ul-brich, I. M., DeCarlo, P. F., Sueper, D., Jayne, J. T., Worsnop, D. R., Ziemann, P. J., and Jimenez, J. L.: Chemically-resolved aerosol volatility measurements from two megacity field studies, Atmos. Chem. Phys., 9, 7161–7182, doi:10.5194/acp-9-7161-2009, 2009.
Jimenez, J. L., Canagaratna, M. R., Donahue, N. M., Prevot, A. S. H., Zhang, Q., Kroll, J. H., DeCarlo, P. F., Allan, J. D., Coe, H., Ng, N. L., Aiken, A. C., Docherty, K. S., Ulbrich, I. M., Grieshop, A. P., Robinson, A. L., Duplissy, J., Smith, J. D., Wil-son, K. R., Lanz, V. A., Hueglin, C., Sun, Y. L., Tian, J., Laakso-nen, A., RaatikaiLaakso-nen, T., RautiaiLaakso-nen, J., Vaattovaara, P., Ehn, M., Kulmala, M., Tomlinson, J. M., Collins, D. R., Cubison, M. J., E., Dunlea, J., Huffman, J. A., Onasch, T. B., Alfarra, M. R., Williams, P. I., Bower, K., Kondo, Y., Schneider, J., Drewnick, F., Borrmann, S., Weimer, S., Demerjian, K., Salcedo, D., Cottrell, L., Griffin, R., Takami, A., Miyoshi, T., Hatakeyama, S., Shi-mono, A., Sun, J. Y., Zhang, Y. M., Dzepina, K., Kimmel, J. R., Sueper, D., Jayne, J., Herndon, S. C., Trimborn, A. M., Williams, L. R., Wood, E. C., Middlebrook, A. M., Kolb, C., Baltensperger, U., and Worsnop, D. R.: Evolution of Organic Aerosols in the At-mosphere, Science, 326, 1525–1529, 2009.
Jimenez, J. L., Canagaratna, M. R., Drewnick, F., Allan, J. D., Al-farra, M. R., Middlebrook, A. M., Slowik, J. G., Zhang, Q., Coe, H., Jayne, J. T., and Worsnop, D. R.: Comment on “The effects of molecular weight and thermal decomposition on the sensitiv-ity of a thermal desorption aerosol mass spectrometer”, Aerosol Sci. Tech., 50, I–XV, 2016.
L., Tsigaridis, K., Vignati, E., Stephanou, E. G., and Wilson, J.: Organic aerosol and global climate modelling: a review, At-mos. Chem. Phys., 5, 1053–1123, doi:10.5194/acp-5-1053-2005, 2005.
Kostenidou, E., Pathak, R. K., and Pandis, S. N.: An Algorithm for the Calculation of Secondary Organic Aerosol Density Combin-ing AMS and SMPS Data, Aerosol Sci. Tech., 41, 1002–1010, 2007.
Lightstone, J. M., Onasch, T. B., Imre, D., and Oatis, S.: Deliques-cence, EffloresDeliques-cence, and Water Activity in Ammonium Nitrate and Mixed Ammonium Nitrate/Succinic Acid Microparticles, J. Phys. Chem. A, 104, 9337–9346, 2000.
Liu, S., Russell, L. M., Sueper, D. T., and Onasch, T. B.: Organic particle types by single-particle measurements using a time-of-flight aerosol mass spectrometer coupled with a light scattering module, Atmos. Meas. Tech., 6, 187–197, doi:10.5194/amt-6-187-2013, 2013.
Lozano, R., Naghavi, M., Foreman, K., Lim, S., Shibuya, K., Aboy-ans, V., Abraham, J., Adair, T., Aggarwal, R., and Ahn, S. Y.: Global and regional mortality from 235 causes of death for 20 age groups in 1990 and 2010: a systematic analysis for the Global Burden of Disease Study 2010, Lancet, 380, 2095–2128, 2013. Matthew, B. M., Middlebrook, A. M., and Onasch, T. B.:
Collec-tion efficiencies in an Aerodyne Aerosol Mass Spectrometer as a function of particle phase for laboratory generated aerosols, Aerosol Sci. Tech., 42, 884–898, 2008.
Mensah, A. A., Buchholz, A., Mentel, T. F., Tillmann, R., and Kiendler-Scharr, A.: Aerosol mass spectrometric measurements of stable crystal hydrates of oxalates and inferred relative ioniza-tion efficiency of water, J. Aerosol Sci., 42, 11–19, 2011. Middlebrook, A. M., Bahreini, R., Jimenez, J. L., and Canagaratna,
M. R.: Evaluation of Composition-Dependent Collection Effi-ciencies for the Aerodyne Aerosol Mass Spectrometer using Field Data, Aerosol Sci. Tech., 46, 258–271, 2012.
Miyakawa, T., Matsuzawa, R., and Katayama, M.: Reconsider-ing Adhesion and Bounce of Submicron Particles Upon High-Velocity Impact, Aerosol Sci. Tech., 47, 472–481, 2013. Murphy, D. M.: The effects of molecular weight and thermal
de-composition on the sensitivity of a thermal desorption aerosol mass spectrometer, Aerosol Sci. Tech., 50, 118–125, 2015. Myers, R. L. and Fite, W. L.: Electrical detection of airborne
par-ticulates using surface ionization techniques, Environ. Sci. Tech-nol., 9, 334–336, 1975.
Ng, N. L., Canagaratna, M. R., Jimenez, J. L., Chhabra, P. S., Se-infeld, J. H., and Worsnop, D. R.: Changes in organic aerosol composition with aging inferred from aerosol mass spectra, At-mos. Chem. Phys., 11, 6465–6474, doi:10.5194/acp-11-6465-2011, 2011.
Pankow, J. F. and Asher, W. E.: SIMPOL.1: a simple group contribution method for predicting vapor pressures and en-thalpies of vaporization of multifunctional organic compounds, Atmos. Chem. Phys., 8, 2773–2796, doi:10.5194/acp-8-2773-2008, 2008.
Quinn, P. K., Bates, T. S., Coffman, D., Onasch, T. B., Worsnop, D., Baynard, T., de Gouw, J. A., Goldan, P. D., Kuster, W. C., Williams, E., Roberts, J. M., Lerner, B., Stohl, A., Petters-son, A., and Lovejoy, E. R.: Impacts of sources and aging on submicrometer aerosol properties in the marine boundary
layer across the Gulf of Maine, J. Geophys. Res., 111, D23S36, doi:10.1029/2006JD007582, 2006.
Richardson, C. B. and Hightower, R. L.: Evaporation of ammonium nitrate particles, Atmos. Environ., 21, 971–975, 1987.
Robinson, E. S., Saleh, R., and Donahue, N. M.: Organic Aerosol Mixing Observed by Single-Particle Mass Spectrometry, J. Phys. Chem. A, 117, 13935–13945, 2013.
Robinson, E. S., Saleh, R., and Donahue, N. M.: Probing the Evap-oration Dynamics of Mixed SOA/Squalane Particles Using Size-Resolved Composition and Single-Particle Measurements, Envi-ron. Sci. Technol., 49, 9724–9732, 2015.
Salcedo, D., Onasch, T. B., Canagaratna, M. R., Dzepina, K., Huff-man, J. A., Jayne, J. T., Worsnop, D. R., Kolb, C. E., Weimer, S., Drewnick, F., Allan, J. D., Delia, A. E., and Jimenez, J. L.: Technical Note: Use of a beam width probe in an Aerosol Mass Spectrometer to monitor particle collection efficiency in the field, Atmos. Chem. Phys., 7, 549–556, doi:10.5194/acp-7-549-2007, 2007.
Salcedo, D., Onasch, T. B., Aiken, A. C., Williams, L. R., de Foy, B., Cubison, M. J., Worsnop, D. R., Molina, L. T., and Jimenez, J. L.: Determination of particulate lead using aerosol mass spec-trometry: MILAGRO/MCMA-2006 observations, Atmos. Chem. Phys., 10, 5371–5389, doi:10.5194/acp-10-5371-2010, 2010. Saleh, R., Robinson, E. S., Ahern, A. T., Donahue, N. M.,
Robin-son, E. S., Ahern, A. T., and Donahue, N. M.: Evaporation rate of particles in the vaporizer of the Aerodyne aerosol mass spec-trometer, Aerosol Sci. Tech., 0, 1–8, 2016.
Shilling, J. E., Chen, Q., King, S. M., Rosenoern, T., Kroll, J. H., Worsnop, D. R., DeCarlo, P. F., Aiken, A. C., Sueper, D., Jimenez, J. L., and Martin, S. T.: Loading-dependent elemental composition ofα-pinene SOA particles, Atmos. Chem. Phys., 9, 771–782, doi:10.5194/acp-9-771-2009, 2009.
Silva, P. J., Erupe, M. E., Price, D., Elias, J., G J Malloy, Q., Li, Q., Warren, B., and Cocker, D. R.: Trimethylamine as Precursor to Secondary Organic Aerosol Formation via Nitrate Radical Reac-tion in the Atmosphere, Environ. Sci. Technol., 42, 4689–4696, 2008.
Slowik, J. G., Stroud, C., Bottenheim, J. W., Brickell, P. C., Chang, R. Y.-W., Liggio, J., Makar, P. A., Martin, R. V., Moran, M. D., Shantz, N. C., Sjostedt, S. J., van Donkelaar, A., Vlasenko, A., Wiebe, H. A., Xia, A. G., Zhang, J., Leaitch, W. R., and Ab-batt, J. P. D.: Characterization of a large biogenic secondary or-ganic aerosol event from eastern Canadian forests, Atmos. Chem. Phys., 10, 2825–2845, doi:10.5194/acp-10-2825-2010, 2010. Solomon, S., Qin, D., Manning, M., Alley, R. B., Berntsen, T.,
Bindoff, N. L., Chen, Z., Chidthaisong, A., Gregory, J. M., and Hegerl, G. C.: Climate change 2007: The physical science basis, contribution of working group 1 to the fourth assessment report of the Intergovernmental Panel on Climate Change, 2007. Virtanen, A., Joutsensaari, J., Koop, T., Kannosto, J., Yli-Pirilä, P.,
Leskinen, J., Mäkelä, J. M., Holopainen, J. K., Pöschl, U., Kul-mala, M., Worsnop, D. R., and Laaksonen, A.: An amorphous solid state of biogenic secondary organic aerosol particles, Na-ture, 467, 824–827, 2010.