www.atmos-meas-tech.net/9/4843/2016/ doi:10.5194/amt-9-4843-2016
© Author(s) 2016. CC Attribution 3.0 License.
Evaluation of column-averaged methane in models and TCCON
with a focus on the stratosphere
Andreas Ostler1, Ralf Sussmann1, Prabir K. Patra2, Sander Houweling3,4, Marko De Bruine3, Gabriele P. Stiller5, Florian J. Haenel5, Johannes Plieninger5, Philippe Bousquet6,7, Yi Yin6,7, Marielle Saunois6,7, Kaley A. Walker8, Nicholas M. Deutscher9,10, David W. T. Griffith9, Thomas Blumenstock6, Frank Hase6, Thorsten Warneke10, Zhiting Wang10, Rigel Kivi11, and John Robinson12
1Karlsruhe Institute of Technology, IMK-IFU, 82467 Garmisch-Partenkirchen, Germany 2Research Institute for Global Change, JAMSTEC, Yokohama, 236-0001, Japan
3Institute for Marine and Atmospheric Research Utrecht, Utrecht University, 3584 CC Utrecht, the Netherlands 4SRON Netherlands Institute for Space Research, 3584 CA Utrecht, the Netherlands
5Karlsruhe Institute of Technology, IMK-ASF, 76021 Karlsruhe, Germany
6Laboratoire des Sciences du Climat et de l’Environnement, IPSL-LSCE, CEA-CNRS-UVSQ,
UMR8212, 91191 Gif-sur-Yvette, France
7Université de Versailles Saint Quentin en Yvelines, 78000 Versaille, France 8Department of Physics, University of Toronto, Toronto, Ontario M5S 1A7, Canada 9School of Chemistry, University of Wollongong, Wollongong, NSW 2522, Australia 10Institute of Environmental Physics, University of Bremen, 28334 Bremen, Germany 11Finnish Meteorological Institute, Arctic Research Center, 99600 Sodankylä, Finland
12Department of Atmospheric Research, National Institute of Water and Atmospheric Research (NIWA) Ltd,
Wellington 6021, New Zealand
Correspondence to:Ralf Sussmann ([email protected])
Received: 14 March 2016 – Published in Atmos. Meas. Tech. Discuss.: 11 May 2016
Revised: 12 September 2016 – Accepted: 15 September 2016 – Published: 28 September 2016
Abstract. The distribution of methane (CH4)in the
strato-sphere can be a major driver of spatial variability in the dry-air column-averaged CH4mixing ratio (XCH4), which is
be-ing measured increasbe-ingly for the assessment of CH4
sur-face emissions. Chemistry-transport models (CTMs) there-fore need to simulate the tropospheric and stratospheric frac-tional columns of XCH4 accurately for estimating surface
emissions from XCH4. Simulations from three CTMs are
tested against XCH4 observations from the Total Carbon
Column Network (TCCON). We analyze how the model– TCCON agreement in XCH4 depends on the model
repre-sentation of stratospheric CH4 distributions. Model
equiva-lents of TCCON XCH4are computed with stratospheric CH4
fields from both the model simulations and from satellite-based CH4 distributions from MIPAS (Michelson
Interfer-ometer for Passive Atmospheric Sounding) and MIPAS CH4
fields adjusted to ACE-FTS (Atmospheric Chemistry
Ex-periment Fourier Transform Spectrometer) observations. Us-ing MIPAS-based stratospheric CH4fields in place of model
simulations improves the model–TCCON XCH4agreement
for all models. For the Atmospheric Chemistry Transport Model (ACTM) the average XCH4bias is significantly
re-duced from 38.1 to 13.7 ppb, whereas small improvements are found for the models TM5 (Transport Model, version 5; from 8.7 to 4.3 ppb) and LMDz (Laboratoire de Météorolo-gie Dynamique model with zooming capability; from 6.8 to 4.3 ppb). Replacing model simulations with MIPAS strato-spheric CH4fields adjusted to ACE-FTS reduces the average
XCH4 bias for ACTM (3.3 ppb), but increases the average
XCH4bias for TM5 (10.8 ppb) and LMDz (20.0 ppb). These
findings imply that model errors in simulating stratospheric CH4contribute to model biases. Current satellite instruments
cannot definitively measure stratospheric CH4 to sufficient
diag-nostics to the models indicates that model-to-model differ-ences in the simulation of stratospheric transport, notably the age of stratospheric air, can largely explain the inter-model spread in stratospheric CH4 and, hence, its contribution to
XCH4. Therefore, it would be worthwhile to analyze how
in-dividual model components (e.g., physical parameterization, meteorological data sets, model horizontal/vertical resolu-tion) impact the simulation of stratospheric CH4and XCH4.
1 Introduction
The column-averaged dry-air mixing ratio of methane (CH4),
denoted as XCH4, is an integrated measure of CH4with
con-tributions from the troposphere and the stratosphere. Obser-vations of XCH4contain source/sink information on a global
to regional scale. They are provided by the ground-based net-works NDACC (Network for the Detection of Atmospheric Composition Change, http://www.ndacc.org/; Kurylo, 1991; for XCH4retrievals see, e.g., Sussmann et al., 2011, 2012,
2013) and TCCON (Total Carbon Column Observing Net-work, http://www.tccon.caltech.edu/; Wunch et al., 2011), and also by satellite-based observation platforms like SCIA-MACHY (Scanning Imaging Absorption Spectrometer for Atmospheric Cartography; Burrows et al., 1995; Franken-berg et al., 2011) and GOSAT (Greenhouse Gases Observing Satellite; Kuze et al., 2009; Yokota et al., 2009). Satellite-inferred XCH4 observations are increasingly used in
atmo-spheric inverse modeling because of their beneficial spa-tiotemporal data coverage (Bergamaschi et al., 2013; Fraser et al., 2013, 2014; Monteil et al., 2013; Houweling et al., 2014; Wecht et al., 2014; Cressot et al., 2014; Alexe et al., 2015; Turner et al., 2015; Locatelli et al., 2015). Given the high accuracy of ground-based XCH4 TCCON retrievals,
these observations are typically used for the evaluation of both chemistry-transport model (CTM) simulations (Saito et al., 2012; Belikov et al., 2013; Monteil et al., 2013; Fraser et al., 2014; Alexe et al., 2015; Turner et al., 2015) and satellite-retrieved XCH4 (Parker et al., 2011, 2015; Schepers et al.,
2012; Dils et al., 2014; Houweling et al., 2014; Parker et al., 2015; Kulawik et al., 2016; Pandey et al., 2016; Inoue et al., 2016).
Because of the various influences on XCH4, however, the
interpretation of residual XCH4 differences with TCCON
may be difficult. For example, a good agreement between XCH4simulations and observations may suggest that a CTM
is able to represent atmospheric conditions in a realistic way. However, it could also be the case that systematic model and satellite data errors in the troposphere and the strato-sphere compensate each other. For this reason, it is neces-sary to extend model validations with additional atmospheric CH4 observations that are complementary to XCH4
obser-vations, like surface or airborne in situ measurements, or balloon-based vertical profiles (Karion et al., 2010). In the
context of a refined model comparison, it is also possible to separate ground-based XCH4observations into tropospheric
and stratospheric partial columns (Washenfelder et al., 2003; Sepúlveda et al., 2012, 2014; Wang et al., 2014; Saad et al., 2014).
Model–measurement XCH4 residuals are minimized by
atmospheric inversions in order to constrain CH4 emission
fluxes. Inversion models are also able to make use of in situ measurements and XCH4 observations at the same time in
order to adjust prior emission fluxes. Nevertheless, such in-verse models still have to deal with ill-defined XCH4
bi-ases, which, in contrast to well-quantified bibi-ases, can only be attributed to errors in the model or the observations with an ambiguous assignment (Houweling et al., 2014). Cur-rently, there are various approaches to optimize bias correc-tion funccorrec-tions within the inverse model or to construct bias corrections as ad hoc functions of latitude or air mass. Ad hoc bias corrections, like removing a latitudinal background pattern in XCH4 model–observation differences, are
com-mon, even though they bear the risk of obscuring real sig-nals from emissions on the Earth’s surface. Given the fact that the stratospheric contribution relative to the CH4 total
column increases from∼5 % at the tropics up to∼25 % at midlatitudes and high latitudes, model errors in the repre-sentation of stratospheric CH4mixing ratios are expected to
give rise to a latitudinal varying bias (Turner et al., 2015). Although it is known that CTMs differ by up to∼50 % in the simulation of lower stratospheric CH4distributions
(Pa-tra et al., 2011), an atmospheric region with a steep methane gradient of∼ −50 ppb km−1, the impact of model errors in stratospheric CH4 on XCH4has not been rigorously
quan-tified up to now. In this context, the goal of this study is to better understand the sensitivity of XCH4model–observation
differences to the model representation of stratospheric CH4.
Our XCH4model–observation analysis is based on
opti-mized model simulations from three well-established CTMs on the one side and accurate XCH4 observations from
TC-CON on the other. The impact of model stratospheric CH4
distributions on XCH4 is estimated by replacing modeled
stratospheric CH4 fields with monthly mean CH4
distribu-tions observed by MIPAS (Michelson Interferometer for Pas-sive Atmospheric Sounding) and by ACE-FTS (Atmospheric Chemistry Experiment Fourier Transform Spectrometer). In addition to this, we briefly evaluate the model characteristics of stratospheric transport in order to understand differences between simulated and observed CH4distributions. The
pa-per has the following structure: After introducing the models (Sect. 2) and the observations (Sect. 3), we present both a di-rect model–TCCON comparison and a comparison with re-fined model data using satellite data products of stratospheric CH4 in Sect. 4. The transport characteristics of the models
Table 1.Overview of CTMs used for model–TCCON comparison.
Resolution
Model name Institution Horizontala Verticalb Output CH4 Mean age derived from Reference
ACTM JAMSTEC ∼2.8×2.8◦ 67σ 1-hourly, idealized transport Patra et al. (2016) monthly tracer simulations
TM5 SRON ∼6×4◦ 25η daily SF6simulations Pandey et al. (2016)
LMDz LSCE ∼3.75×1.875◦ 39η monthly SF6simulations Locatelli et al. (2015)
aLongitude×latitude.bVertical coordinates in sigma-pressureσ(pressure divided by surface pressure) and hybrid sigma-pressureη.
2 Model simulations
The focus of this study is the assessment of the impact of stratospheric CH4on XCH4. Therefore, we try to ensure that
model simulations represent tropospheric CH4mixing ratios
as well as possible. For this purpose, we use optimized CH4
model simulations that have been constrained by surface ob-servations. Our model analysis comprises simulations from three well-established CTMs that have already been part of the chemistry-transport model intercomparison experiment TransCom-CH4(Patra et al., 2011) and used in inverse
mod-eling of CH4 emissions. Furthermore, we use model
simu-lations of stratospheric mean age for an evaluation of model transport characteristics in Sect. 5. Basic model features are given in Table 1.
2.1 ACTM
The Atmospheric Chemistry Transport Model (ACTM) model (Patra et al., 2009a) is an atmospheric general cir-culation model (AGCM)-based CTM from the Center for Climate System Research/National Institute for Environ-mental Studies/Frontier Research Center for Global Change (CCSR/NIES/FRCGC). Here, we use optimized ACTM sim-ulations presented in Patra et al. (2016) as inversion case 2 (CH4ags). The ACTM horizontal resolution is∼2.8◦×2.8◦
(T42 spectral truncations) with 67 sigma-pressure vertical levels. The meteorological fields of ACTM are nudged with reanalysis data from the Japan Meteorological Agency, ver-sion JRA-25 (Onogi et al., 2007). ACTM uses an optimized OH field (Patra et al., 2014) based on a scaled version of the seasonally varying OH field from Spivakovsky et al. (2000). The concentration fields that are relevant for stratospheric CH4 loss – OH, O(1D), and chlorine (Cl) radicals – are
based on simulations by the ACTM’s stratospheric model run (Takigawa et al., 1999). ACTM mean age is derived from the simulation of an idealized transport tracer with uniform surface fluxes, linearly increasing trend, and no loss in the atmosphere (Patra et al., 2009b). The ACTM simulates the observed CH4 interhemispheric gradient in the troposphere
and individual in situ measurements generally within 10 ppb (Patra et al., 2016).
2.2 TM5
The global chemistry Tracer Model, version 5 (TM5) has been described in Krol et al. (2005) and used as an atmo-spheric inversion model for CH4 emissions (Bergamaschi
et al., 2005; Meirink et al., 2008; Houweling et al., 2014). Here, we use TM5 simulations of CH4optimized with
sur-face measurements only (Pandey et al., 2016). TM5 is run with a horizontal resolution of 6◦×4◦and a vertical grid of 25 layers. TM5 meteorology is driven by the reanalysis data set ERA-Interim (Dee et al., 2011) from the European Cen-tre for Medium Range Weather Forecasts (ECMWF). The simulation of the chemical CH4 sink uses OH fields from
Spivakovsky et al. (2000), which have been scaled to match methyl chloroform measurements. In addition to that, strato-spheric CH4loss via Cl and O(1D) radicals is simulated
us-ing their concentration fields based on the 2-D photochem-ical Max Planck Institute (MPI) model (Brühl and Crutzen, 1993). Known deficiencies in the TM5 simulation of inter-hemispheric mixing have been corrected by extending the model with a horizontal diffusion parameterization that is adjusted to match SF6simulations with SF6 measurements
(Monteil et al., 2013).
TM5 simulations of sulfur hexafluoride (SF6)were used
to derive stratospheric mean age data. SF6mixing ratios are
monotonically increasing with time, showing higher mixing ratios in the troposphere than in the stratosphere, given the transport time from SF6surface sources to higher altitudes.
This implies that tropospheric and stratospheric SF6mixing
ratios of equal size are separated from each other by a time lag, which is commonly defined as mean age of air. In order to derive mean age from SF6 model simulations, the same
tropospheric SF6 reference time series was used as for the
derivation of MIPAS mean age data (see Stiller et al., 2012)
2.3 LMDz
The LMDz (Laboratoire de Météorologie Dynamique model with zooming capability) is a general circulation model (Hourdin et al., 2006), which has been used to investigate the impact of transport model errors on inverted CH4emissions
by surface measurements from background sites (Locatelli et al., 2015). These model simulations are nudged with the ERA-Interim reanalysis data set for horizontal winds (u,v). LMDz has a horizontal resolution of 3.75◦×1.875◦, and 39 hybrid sigma-pressure layers. The chemical destruction of CH4 by OH and O(1D) is based on prescribed
concentra-tion fields simulated by the chemistry–climate model LMDz-INCA (Szopa et al., 2013). No Cl-based CH4destruction is
prescribed in this version of the model. Besides CH4, LMDz
simulations of SF6were used to derive mean age data
simi-larly to the method used for TM5.
3 Intercomparison strategy and observations 3.1 Intercomparison strategy
We want to quantify the dependence of the XCH4 model–
observation agreement on the model representation of strato-spheric CH4mixing ratios. For this purpose, we apply
orig-inal CH4model fields and two corrected CH4model fields,
where we have replaced the modeled stratospheric CH4 by
satellite data sets of stratospheric CH4 mixing ratios. The
first satellite data set consists of MIPAS CH4observations,
whereas the second satellite data set contains MIPAS CH4
observations that are adjusted to ACE-FTS-observed CH4
levels. This allows us to represent an uncertainty range for the satellite-based model correction. Finally, our XCH4
model–observation comparison deals with a triplet of model CH4fields for each CTM.
Using TCCON XCH4 observations as validation
refer-ence, we evaluate the impact of correcting the modeled stratospheric CH4 on XCH4. Consequently, modeled
verti-cal profiles of CH4were extracted for each TCCON site and
subsequently converted to XCH4by accounting for the
TC-CON retrieval a priori and vertical sensitivity. This means that model CH4 profiles are adjusted to the actual surface
pressure measured at the time of a single TCCON observa-tion. In addition to that, model profiles are convolved with the daily TCCON retrieval a priori profiles of CH4, which have
been converted from wet air into dry air units by subtracting a daily water vapor profile provided by NCEP (National Cen-ters for Environmental Prediction) and the averaging kernel depending on the actual solar zenith angle. Thereby, monthly mean CH4profiles from LMDz also receive a daily
compo-nent depending on the surface pressure, the TCCON a pri-ori profiles and averaging kernels. The statistical analysis of XCH4model–TCCON differences is then based on the daily
mean time series for the year 2010.
3.2 TCCON observations of column-averaged methane
Solar absorption measurements in the near-infrared are per-formed via ground-based Fourier transform spectrometers (FTSs) at TCCON sites across the globe. TCCON-type mea-surements are analyzed with the GGG software package,
in-cluding the spectral fitting code GFIT to derive total column abundances of several trace gases (Wunch et al., 2011). The CH4total column is inverted from the spectra in three
differ-ent spectral windows cdiffer-entered at 5938, 6002, and 6076 cm−1. The spectral fitting method is based on iteratively scaling a priori profiles to provide the best fit to the measured spec-trum. The general shape of the a priori profiles has been in-ferred from aircraft, balloon and satellite profiles (ACE-FTS profiles measured in the 30–40◦N latitude range from 2003 to 2007). In addition, the shape of the daily a priori profile is vertically squeezed/stretched depending on tropopause alti-tude and the latialti-tude of the measurement site. This means that the tropopause altitude is used as a proxy for stratospheric ascent/descent to represent the origin of the air mass in the a priori profile. XCH4is calculated by dividing the CH4
num-ber density by the simultaneously measured O2number
den-sity (a proxy for the dry-air pressure column).
These XCH4 retrievals are corrected a posteriori for
known air-mass-dependent biases and calibrated to account for air-mass-independent biases, which can, among other er-rors, arise from spectroscopic uncertainties (Wunch et al., 2011). The air-mass-independent calibration factor, which is determined by comparisons with coincident airborne or balloon-borne in situ measurements over TCCON sites (Wunch et al., 2010; Messerschmidt et al., 2011; Geibel et al., 2012), allows for a calibration of TCCON XCH4retrievals
to in situ measurements on the WMO scale. Furthermore, the quality of the retrievals is continuously improved by correcting the influence of systematic instrumental changes over time. As a result of these improvements there are dif-ferent versions of the GGG software package. In this study we use TCCON retrievals performed with version GGG2014 (for details see https://tccon-wiki.caltech.edu/). The TCCON measurement precision (2σ )for XCH4is<0.3 % (<5 ppb)
for single measurements. For the year 2010, XCH4
observa-tions are available from 11 TCCON sites, listed in Table 2. Knowing that TCCON XCH4 accuracy can be affected by
a strong polar vortex (Ostler et al., 2014), we exclude high-latitude observations at Sodankylä within the early spring pe-riod (March, April, May) from the analysis. TCCON data were obtained from the TCCON Data Archive, hosted by the Carbon Dioxide Information Analysis Center (CDIAC: http://cdiac.ornl.gov/). The individual data sets of the TC-CON sites used in this study are available from this database.
3.3 Satellite-based data sets of stratospheric methane
In order to correct modeled stratospheric CH4 fields,
Table 2.Overview of TCCON measurement sites used for the evaluation of chemical transport models. Abbreviations of the site names, information about geographical location, and number of measurement days in 2010 are provided.
TCCON site Abbreviation Altitude Latitude Longitude Days Reference
Sodankylä (Finland) SOD 188 m 67.4◦N 26.6◦E 78 Kivi et al. (2014) Białystok (Poland) BIA 180 m 53.2◦N 23.0◦E 120 Deutscher et al. (2014) Karlsruhe (Germany) KAR 110 m 49.1◦N 8.4◦E 79 Hase et al. (2014) Orléans (France) ORL 130 m 48.0◦N 2.1◦E 91 Warneke et al. (2014) Garmisch (Germany) GAR 743 m 47.5◦N 11.1◦E 120 Sussmann et al. (2014) Park Falls (USA) PAR 440 m 46.0◦N 90.3◦W 155 Wennberg et al. (2014a) Lamont (USA) LAM 320 m 36.6◦N 97.5◦W 299 Wennberg et al. (2014b) Izaña (Tenerife) IZA 2370 m 28.3◦N 16.5◦W 50 Blumenstock et al. (2014) Darwin (Australia) DAR 30 m 12.4◦S 130.9◦E 64 Griffith et al. (2014a) Wollongong (Australia) WOL 30 m 34.4◦S 150.9◦E 142 Griffith et al. (2014b) Lauder (New Zealand) LAU 370 m 45.0◦S 169.7◦E 142 Sherlock et al. (2014a, b)
Technology, Institute of Meteorology and Climate Research (KIT IMK) and the Instituto de Astrofísica de Andalucía (CSIC) (von Clarmann et al., 2003). The MIPAS CH4data
set comprises zonal monthly means with a horizontal grid resolution of 5◦latitude. In the vertical, the resolution of the MIPAS CH4 fields range from 2.5 to 7 km; see Plieninger
et al. (2015) for more details. As an additional quality cri-terion, we only select MIPAS data points that are averaged over more than 300 profile measurements. As a result, our MIPAS CH4 data set typically covers altitudes higher than ∼10 km at midlatitudes and heights above∼15 km in the tropics. This implies that we do not use a thermal or chemi-cal tropopause definition, but use the MIPAS data where they are available. Therefore, we cannot exclude that our MIPAS-based CH4 fields contain some upper tropospheric MIPAS
values; i.e., our definition of stratospheric CH4 is not strict
from a meteorological point of view.
The corrected model CH4profiles rely on original model
CH4 fields that are merged with MIPAS-based zonal CH4
fields (monthly means) interpolated to the model grid. Merg-ing original model CH4 fields/profiles with zonal monthly
means implies that we lose some spatial and temporal vari-ability in the corrected model CH4fields. For example,
ver-tical shifts of the tropopause can cause significant variations in XCH4of∼25 ppb even within a day (Ostler et al., 2014).
As these XCH4 changes can be positive but also negative
(tropopause shifted upwards and downwards), we expect that dynamically induced XCH4 variations should be negligible
from a statistical point of view as used in this study. For our aim – investigating the overall impact of model stratospheric CH4 fields on the quantity XCH4– a monthly mean
repre-sentation of stratospheric CH4in the corrected model fields
is sufficient.
In our study we use the strongly revised MIPAS CH4
data product for the MIPAS reduced-resolution period from January 2005 to April 2012. This new data set (version V5R_CH4_224/V5R_CH4_225) was recently introduced by Plieninger et al. (2015) with an emphasis on retrieval
charac-teristics. Plieninger et al. (2015) showed that CH4mixing
ra-tios are reduced in the lowermost stratosphere when using the new retrieval settings. This finding implies that the high bias of the older CH4data version in the lowermost stratosphere,
which was determined by Laeng et al. (2015), has been par-tially alleviated. Nevertheless, a recent comparison study by Plieninger et al. (2016) suggests a remaining positive bias (100–200 ppb) relative to other satellite measurements such as ACE-FTS observations.
For this reason, a second satellite CH4data set was
con-structed by adjusting MIPAS stratospheric CH4 mixing
ra-tios to ACE-FTS (Boone et al., 2013) measurements of CH4.
Given the sparse data coverage of ACE-FTS observations for the year 2010, we did not use ACE-FTS measurements di-rectly. Instead, the MIPAS CH4fields were adjusted by
off-sets relative to ACE shown in Fig. 1, yielding the second satellite-based CH4 data set abbreviated by MIPAS_ACE.
We used collocated pairs of CH4profiles from MIPAS and
ACE-FTS to derive a CH4offset as a function of altitude and
latitude for the year 2010. The collocation criteria are based on a maximum radius of 500 km and a maximum temporal deviation of 5 h, which is identical to Plieninger et al. (2016). Furthermore, the MIPAS averaging kernels were applied to ACE-FTS CH4profiles. ACE-FTS operates in solar
occulta-tion mode (Bernath et al., 2005) and also provides retrievals of several trace gases including CH4. Here, we use ACE-FTS
data from a research version of the 3.5 retrieval described in Buzan et al. (2016).
Figure 1 shows the CH4 offset functions computed as
Mean CH4 difference: MIPAS - ACE
-50 0 50 100 150 200 250 CH4 vmr [ppb]
10 20 30 40 50
Altitude [km]
90° S − 60° S 60° S − 30° S
30° S − EQ
EQ − 30° N
30° N − 60° N 60° N − 90° N
Figure 1.Mean CH4 differences between collocated MIPAS and
ACE-FTS CH4profiles measured in the year 2010. Mean CH4
dif-ferences in parts per billion (ppb) are derived for 30◦latitudinal bands indicated by different colors.
3.4 MIPAS-observed mean age
Besides MIPAS CH4observations, we also use MIPAS data
sets of stratospheric mean age inferred from SF6
measure-ments. Here, we use the new MIPAS mean age data set pre-sented by Haenel et al. (2015). This new mean age data set contains several improvements compared to the previous ver-sion introduced by Stiller et al. (2012). For MIPAS, the mean age is calculated as the average transport time from the tropi-cal troposphere to a certain location in the stratosphere using NOAA (National Oceanic and Atmospheric Administration) observations as reference. The mean age of stratospheric air is of special interest for climate research because the dis-tributions of greenhouse gases like ozone critically depend on possible changes in the stratospheric transport pathways (Engel et al., 2009). Mean age can be inferred from observa-tions of clock tracers (concentraobserva-tions monotonically increas-ing with time) like SF6 or CO2, and can also be simulated
by models. For this reason, it is a well-known diagnostic for stratospheric transport and is very suitable for the eval-uation of model transport characteristics (Waugh and Hall, 2002). The combined MIPAS data set of stratospheric CH4
and mean age is used for the evaluation of model transport characteristics in Sect. 5.1.
ACTM
−
TCCON
60° S 40° S 20° S EQ 20° N 40° N 60° N -30
-20 -100 10 20 30 40 50
TM5
−
TCCON
60° S 40° S 20° S EQ 20° N 40° N 60° N -30
-20 -100 10 20 30 40 50
LMDz
−
TCCON
60° S 40° S 20° S EQ 20° N 40° N 60° N -30
-20 -100 10 20 30 40 50
Model original
Model corrected with MIPAS Model corrected with MIPAS_ACE (a)
XCH
4
bias [ppb]
(b)
XCH
4
bias [ppb]
(c)
XCH
4
bias [ppb]
Figure 2.Site-specific model XCH4biases with respect to TCCON
observations in parts per billion (ppb) for the year 2010. Different colors indicate different stratospheric CH4fields used for the
calcu-lation of model XCH4.
4 Model–TCCON comparison of column-averaged methane
Figure 2 shows model biases in XCH4 with respect to
TC-CON observations, where each TCTC-CON site is represented by its geographical latitude. For each CTM a triplet of model CH4 fields (uncorrected, MIPAS and MIPAS_ACE
corrected) yields a triplet of model XCH4 biases. All
site-specific XCH4 model biases are individually listed in
Ta-ble 3. In addition, TaTa-ble 4 provides an average XCH4 bias
for each model data set, computed as the mean of absolute site-specific biases.
The original XCH4bias for ACTM lies between 18.8 and
51.3 ppb (see Fig. 2a and Table 3). This high bias is signif-icantly reduced when ACTM stratospheric CH4 fields are
replaced by satellite-based CH4 fields. The model
correc-tion with MIPAS CH4 reduces the average ACTM XCH4
bias from 38.1 to 13.7 ppb (see Table 4). Site-specific XCH4
Table 3.Site-specific model XCH4biases with respect to TCCON observations in 2010. The model–TCCON agreement in XCH4is evaluated with different stratospheric CH4model fields: the original model distribution (orig), the MIPAS-based stratospheric CH4(MIPAS), and the
MIPAS-based stratospheric CH4adjusted to ACE-FTS observations (MIPAS_ACE). XCH4biases and corresponding 2σ standard errors (in
brackets) are in parts per billion (ppb).
ACTM TM5 LMDz
Site Orig MIPAS MIPAS_ACE Orig MIPAS MIPAS_ACE Orig MIPAS MIPAS_ACE
SOD 51.3 (±2.7) 19.9 (±2.9) 1.8 (±2.8) −3.7 (±1.7) 8.1 (±2.6) −8.0 (±2.5) 13.0 (±3.0) 9.1 (±3.2) −15.0 (±3.6) BIA 43.9 (±1.7) 12.8 (±1.7) −5.0 (±1.9) −10.5 (±1.3) 1.4 (±1.6) −14.1 (±1.6) 4.0 (±1.7) 1.2 (±1.8) −20.9 (±2.1) KAR 47.0 (±2.0) 19.7 (±1.8) 3.5 (±1.9) −4.0 (±1.4) 5.7 (±1.5) −7.7 (±1.6) 9.8 (±2.0) 8.8 (±2.1) −13.8 (±2.2) ORL 47.2 (±1.7) 19.8 (±2.2) 3.5 (±2.3) −7.0 (±1.5) 4.8 (±1.6) −9.2 (±1.7) 5.4 (±2.1) 5.3 (±2.0) −15.7 (±2.1) GAR 45.6 (±1.8) 15.4 (±1.8) −0.9 (±2.0) −6.1 (±1.3) 4.7 (±1.5) −8.1 (±1.5) 6.1 (±1.8) 7.3 (±1.8) −15.7 (±1.8) PAR 39.2 (±1.5) 13.5 (±1.6) −1.3 (±1.6) −9.7 (±1.2) 1.2 (±1.2) −11.0 (±1.2) 4.4 (±1.4) 5.9 (±1.6) −16.0 (±1.6) LAM 31.1 (±1.3) 11.8 (±1.2) 1.8 (±1.1) −4.4 (±0.8) 2.6 (±0.9) −3.7 (±0.8) −2.0 (±1.1) 1.7 (±1.1) −20.4 (±1.2) IZA 34.6 (±2.0) 12.6 (±2.2) −1.6 (±2.2) −11.4 (±1.5) −5.0 (±1.5) −12.6 (±1.5) −4.8 (±1.9) 1.9 (±2.2) −31.1 (±2.2) DAR 18.8 (±1.6) 8.9 (±1.7) 0.1 (±1.8) −8.1 (±1.0) −3.1 (±1.1) −8.8 (±1.1) −9.2 (±1.6) −2.9 (±2.6) −15.0 (±1.4) WOL 25.8 (±1.5) 4.8 (±1.6) −6.6 (±1.6) −17.6 (±1.4) −11.1 (±1.4) −17.9 (±1.3) −11.9 (±1.8) 0.4 (±1.7) −29.6 (±1.9) LAU 34.8 (±1.0) 11.4 (±1.2) −9.9 (±1.3) −12.7 (±1.2) 0.0 (±1.3) −18.3 (±1.3) −4.0 (±1.4) 3.2 (±1.4) −26.6 (±1.6)
Range 32.5 15.1 13.4 13.9 19.2 14.6 24.9 12.0 17.3
Table 4.Average model XCH4bias with respect to TCCON
obser-vations in 2010 computed as mean of absolute site-specific biases (see Table 3). Average XCH4biases in ppb are derived for different model stratospheric CH4fields.
Mean XCH4bias
Model stratospheric CH4field ACTM TM5 LMDz
Original model 38.1 8.7 6.8
MIPAS 13.7 4.3 4.3
MIPAS_ACE 3.3 10.8 20.0
model correction with MIPAS_ACE reduces the average ACTM XCH4bias further from 38.1 to 3.3 ppb (see Table 4),
with values in an interval between−9.9 and 3.5 ppb (see Ta-ble 3); values similar to that were expected from the com-parison with ACTM simulations with tropospheric measure-ments (Patra et al., 2016).
For the original TM5 we detect negative site-specific XCH4biases with values between−17.6 and−3.7 ppb (see
Fig. 2b and Table 3). When TM5 CH4 fields are corrected
with MIPAS observations, this negative XCH4 bias is
re-duced from−8.7 to−4.3 ppb on average (see Table 3). The corresponding site-specific XCH4 biases are then between −11.1 and 8.1 ppb (Table 3). If the MIPAS_ACE is applied to TM5 then the site-specific TM5 XCH4biases are shifted
further to the negative direction with values between−18.3 and−3.7 ppb. In this case the average XCH4bias increased
from 8.7 to 10.8 ppb (Table 4).
With respect to TCCON observations LMDz produces both negative and positive XCH4 biases ranging from −11.9 ppb (Wollongong) to 13.0 ppb (Sodankylä); see Fig. 2c and Table 3. The average LMDz XCH4bias is slightly
reduced from 6.8 to 4.3 ppb if LMDz is corrected with
MI-ACTM − MIPAS
0 0
60° S 40° S 20° S EQ 20° N 40° N 60° N
10 50 100 150 200 250
Pressure [hPa]
TM5 − MIPAS
0
0
0 0
60° S 40° S 20° S EQ 20° N 40° N 60° N
10 50 100 150 200 250
Pressure [hPa]
LMDz − MIPAS
0
0 0
0 0
0
60° S 40° S 20° S EQ 20° N 40° N 60° N
10 50 100 150 200 250
Pressure [hPa]
(a)
-200 -100 0 100 200 300 400
CH
4
vmr (ppb)
(b)
-200 -100 0 100 200 300 400
CH
4
vmr (ppb)
(c)
-200 -100 0 100 200 300 400
CH
4
vmr (ppb)
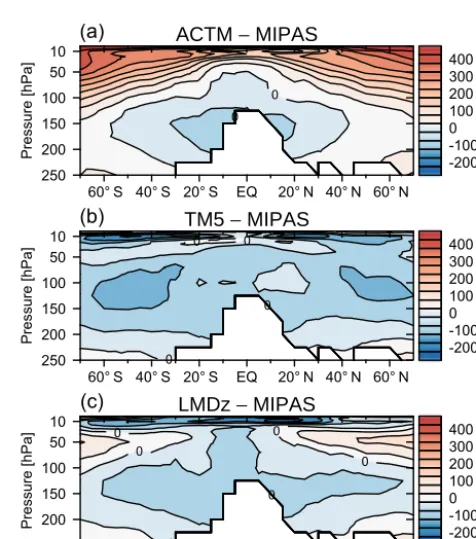
Figure 3.Model–MIPAS differences of stratospheric CH4volume
mixing ratios (vmr) in parts per billion (ppb). Zonally averaged CH4
vmr differences are annual means for the year 2010.
PAS CH4 fields (see Table 4). After this correction,
site-specific LMDz XCH4biases lie between−2.9 and 9.1 ppb.
Using MIPAS_ACE CH4 fields for the LMDz model
cor-rection produces LMDz XCH4 biases between −13.8 and −31.1 ppb. At the same time, the average LMDz XCH4bias
Overall, our results confirm that the model–TCCON agreement in XCH4 depends very much on the model
rep-resentation of stratospheric CH4. It is obvious that the XCH4
offset between ACTM and TCCON is significantly reduced with stratospheric CH4fields based on satellite data. In
con-trast, for TM5 and LMDz, the impact of the model correc-tion on the model–TCCON agreement is ambiguous, in that the model–TCCON agreement can be improved (with MI-PAS), but can also be reduced (with MIPAS_ ACE). In or-der to unor-derstand this inter-model spread we look at the dif-ferences between modeled and satellite-retrieved CH4fields.
Figure 3 shows zonal and annual averaged CH4mixing
ra-tio differences between MIPAS and each CTM. Figure 3a illustrates that stratospheric CH4 mixing ratios are
gener-ally much higher in ACTM than in MIPAS. The ACTM– MIPAS differences in CH4 are increasing from negligible
values within the lowermost stratosphere up to 450 ppb in the upper stratosphere. Furthermore, the ACTM–MIPAS differ-ence in CH4also shows a latitudinal dependence, with
mid-dle and upper stratospheric values increasing towards higher latitudes. The positive bias in stratospheric ACTM CH4
mix-ing ratios causes a positive ACTM bias in XCH4. In contrast
to that, we find negative model–MIPAS differences in strato-spheric CH4mixing ratios for TM5 (Fig. 3b), resulting in a
small negative XCH4bias. We identify two altitude regions,
where TM5 modeled CH4mixing ratios are smaller than
MI-PAS CH4 mixing ratios: the lower stratosphere with
differ-ences in CH4mixing ratios of up to−100 ppb, and the upper
stratosphere (>30 hPa) with maximum CH4 differences of ∼ −150 ppb. Figure 3c shows the CH4mixing ratio
differ-ences between LMDz and MIPAS with noticeable negative CH4 differences of up to−200 ppb within the tropical
up-per stratosphere. Negative CH4differences (∼ −100 ppb) are
also visible in the upper stratosphere of the midlatitude and high-latitude region. In contrast to this, we identify positive CH4 differences of up to 100 ppb within the middle
strato-sphere (∼50 hPa) of the midlatitudes and high latitudes. The negative and positive CH4 differences partially cancel out
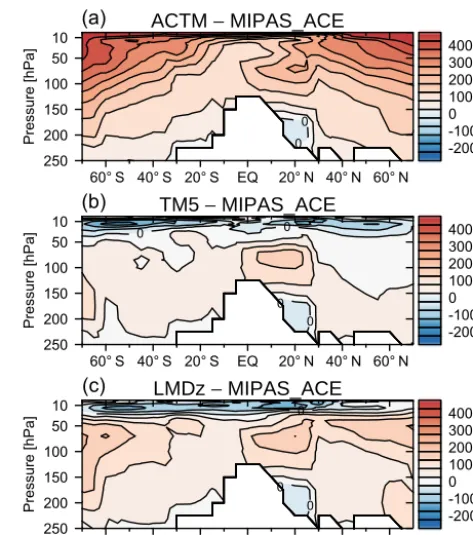
in XCH4. Similarly to Fig. 3, the CH4differences between
model and MIPAS_ACE fields are illustrated in Fig. 4. Given the offset adjustment of MIPAS to ACE-FTS (see Fig. 1), the MIPAS_ACE CH4fields comprise lower CH4mixing
ra-tios compared to MIPAS, mostly in the lower stratosphere. Hence, the ACTM–satellite CH4difference is larger for
MI-PAS_ACE fields than for MIPAS fields. For TM5 and LMDz, model–satellite CH4differences are shifted into the positive
direction (Fig. 4b and c). In other words, modeled strato-spheric CH4mixing ratios appear to be too high when
com-pared to MIPAS and too low in comparison to MIPAS_ACE. The zonal difference fields between model and satellite-based CH4data sets have also been converted to XCH4
dif-ferences and are shown in Fig. 5. Two main features can be found in Fig. 5: (i) the XCH4difference range between
the two satellite-based data sets MIPAS (dark red) and MI-PAS_ACE (light red), which is∼27 ppb (1σ standard
devia-ACTM − MIPAS_ACE
0 0
60° S 40° S 20° S EQ 20° N 40° N 60° N
10 50 100 150 200 250 Pressure [hPa]
TM5 − MIPAS_ACE
0 0 0 0
60° S 40° S 20° S EQ 20° N 40° N 60° N
10 50 100 150 200 250 Pressure [hPa]
LMDz − MIPAS_ACE
0 0 0
60° S 40° S 20° S EQ 20° N 40° N 60° N
10 50 100 150 200 250 Pressure [hPa] (a) -200 -100 0 100 200 300 400 CH 4 vmr (ppb) (b) -200 -100 0 100 200 300 400 CH 4 vmr (ppb) (c) -200 -100 0 100 200 300 400 CH 4 vmr (ppb)
Figure 4.Model–MIPAS_ACE differences of stratospheric CH4
volume mixing ratios (vmr) in parts per billion (ppb). Zonally aver-aged CH4vmr differences are annual means for the year 2010.
tion (SD)=4 ppb) on annual mean basis; and (ii) the model– satellite XCH4differences, which indicate the latitudinal
de-pendence of ACTM (Fig. 1a) and LMDz (Fig. 1c). For exam-ple, ACTM–satellite XCH4 differences are clearly
increas-ing toward higher latitudes. In contrast to this, the TM5– satellite XCH4 difference does not show a latitudinal
de-pendence. These findings on the latitudinal dependence of model–satellite XCH4differences are supported by Table 5,
which provides some statistical results. For example, the SDs and the minimum–maximum ranges of model–satellite XCH4differences are much smaller for TM5 compared to the
other models. Besides that, Fig. 5 also shows that the model– satellite XCH4 differences for the year 2010 only slightly
depend on season. A noticeable seasonal variation in the model–satellite XCH4differences can be found in the
tropi-cal/subtropical region of the Northern Hemisphere. However, in order to analyze seasonal variations, a more thorough anal-ysis is needed, including model and satellite-based XCH4
data sets with a larger time period than used in this study. Furthermore, in the context of seasonality the role of TC-CON station elevation needs to be considered in more detail. Since we only apply 1 year of model and satellite data, the focus of this study is not on the seasonal agreement between model and satellite-based XCH4data sets.
Modeled stratospheric CH4 fields have been directly
Table 5.Average XCH4differences between model simulations and model CH4fields with satellite-based stratospheric CH4fields. Annual mean differences as XCH4bias (with 1σSD) and minimum–maximum range of zonal XCH4differences are in ppb.
ACTM TM5 LMDz
Satellite data Bias Min–max Bias Min–max Bias Min–max
MIPAS 22.3 (±14.1) 45.2 −13.9 (±3.4) 12.8 −4.3 (±9.4) 29.3 MIPAS_ACE 48.7 (±11.0) 35.4 13.6 (±3.5) 14.8 23.2 (±6.8) 22.3
ACTM
−
Satellite
60° S 40° S 20° S EQ 20° N 40° N 60° N
0 20 40 60 80
XCH
4
[ppb]
TM5
−
Satellite
60° S 40° S 20° S EQ 20° N 40° N 60° N
-30 -20 -10 0 10 20 30
XCH
4
[ppb]
LMDz
−
Satellite
60° S 40° S 20° S EQ 20° N 40° N 60° N
-20 -10 0 10 20 30 40 50
XCH
4
[ppb]
MIPAS (JJA) MIPAS (DJF)
MIPAS_ACE (JJA) MIPAS_ACE (DJF)
(a)
(b)
(c)
Figure 5.Zonal XCH4differences resulting from model–satellite
differences of stratospheric CH4 volume mixing ratios. Mean
XCH4differences are shown as solid lines for the summer period
(June, July, and August) and as dashed lines for the winter period (December, January, and February).
where the lowest satellite-based CH4mixing ratios strongly
deviate from the original modeled CH4mixing ratios. In
or-der to quantify the impact of these discontinuities on the XCH4data sets, we have also performed a smoother
replace-ment method. For this purpose we defined a vertical transi-tion range of 75 hPa, starting at the lowest vertical MIPAS data grid point. From this position the model vertical pro-file of CH4 mixing ratios was linearly interpolated to the
satellite-based CH4mixing ratio profile, starting at the upper
boundary of this transition range. This method was applied
ACTM
−
Satellite
60° S 40° S 20° S EQ 20° N 40° N 60° N
0 20 40 60
XCH
4
[ppb]
TM5
−
Satellite
60° S 40° S 20° S EQ 20° N 40° N 60° N
-30 -20 -10 0 10 20 30
XCH
4
[ppb]
LMDz
−
Satellite
60° S 40° S 20° S EQ 20° N 40° N 60° N
-20 -10 0 10 20 30 40 50
XCH
4
[ppb]
MIPAS MIPAS_ACE
MIPAS interpolated MIPAS_ACE interpolated
(a)
(b)
(c)
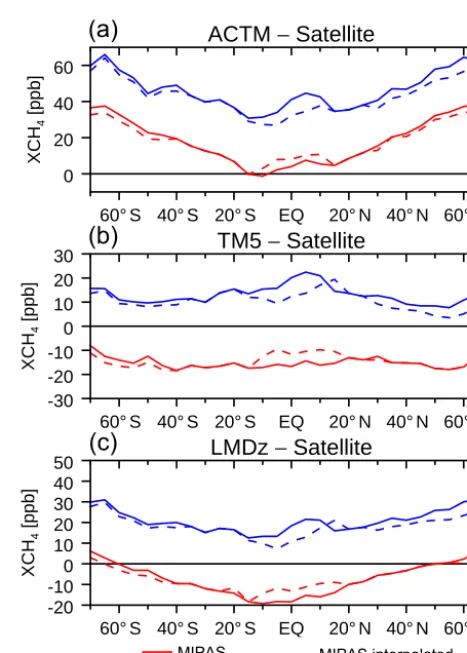
Figure 6.Zonal XCH4 differences as a result of model–satellite
differences of stratospheric CH4volume mixing ratios. Solid lines
refer to the merged model–satellite CH4fields, including
disconti-nuities at the model–satellite transition zone around the tropopause. Dashed lines refer to merged model–satellite CH4fields that have
been smoothly interpolated at the model–satellite transition zone.
to each latitudinal MIPAS grid point corresponding to a ver-tical profile of CH4mixing ratios. The method was not used
if the model–satellite difference of CH4 mixing ratios was
smaller than 30 ppb at the lower boundary of the transition range. Consequently, we also computed XCH4 differences
between the original model and the smoothed satellite-based data sets. Figure 6 then shows model–satellite XCH4
From Fig. 6 it is obvious that the impact of the smoothly interpolated replacement on the model–satellite XCH4
dif-ferences is small; i.e., difdif-ferences between solid and dashed lines are typically smaller than 4 ppb. For this reason we ex-pect that the impact of discontinuities in the merged model– satellite CH4 fields on the results of the XCH4 validation
against TCCON is negligible.
5 Discussion
Our analysis shows that the model–TCCON agreement in XCH4 critically depends on the model representation of
stratospheric CH4, which is diverse for the presented CTMs.
In the following we discuss possible causes for the inter-model spread in stratospheric CH4. In addition to that, we
evaluate the findings of our XCH4model–TCCON
compari-son with respect to satellite data uncertainty.
5.1 Model transport characteristics as possible cause for inter-model spread in stratospheric methane
An inter-model spread in stratospheric CH4fields has already
been detected by Patra et al. (2011) despite applying uni-form fields of OH, Cl, and O1D for all models. Their find-ings, therefore, suggested a predominant role of transport in the simulation of CH4vertical distributions. For this reason,
here we tested whether differences in the modeling of strato-spheric transport are noticeable. To do this, we follow the approach of Strahan et al. (2011) who sought to understand chemistry–climate model ozone simulations using transport diagnostics. This method is based on the compact relation-ship between a long-lived stratospheric tracer and mean age in the lower stratosphere. In their work, they compared simu-lations and air-borne observations of N2O/mean age
correla-tions, in order to evaluate the model transport characteristics. Here, we use the MIPAS data of CH4and mean age as a
refer-ence to identify model-to-model differrefer-ences in the simulation of stratospheric transport. The MIPAS data are not used to evaluate whether modeled stratospheric circulations are real-istic or not, given the uncertainties of MIPAS CH4and mean
age data. For example, the MIPAS mean age range may be too large because MIPAS mean age can be up to 0.8 years too old due to the impact of mesospheric SF6loss (Stiller et al.,
2012). This loss process was not included in the models used for this study. Moreover, the MIPAS CH4data significantly
differ from ACE-FTS CH4data within the lower stratosphere
(see Fig. 1).
In analogy to Strahan et al. (2011) the model transport di-agnostics are focused on the tropical domain because trop-ical diagnostics quantities allow a better assessment of the individual transport processes’ ascent and mixing. Annual means of age for modeled as well as MIPAS-observed fields were calculated for the lower stratosphere (30–100 hPa) of the tropical domain (10◦S–10◦N), and of the northern
hemi-Tropical mean age
-1.5 -1.0 -0.5 0.0 0.5 1.0 1.5
Model-obs tropical mean age [yr] 30
50
70
100
Pressure [hPa]
ACTM TM5 LMDZ
Figure 7.Model–MIPAS differences of mean age for the tropical
lower. Mean age data in years (yr) are calculated as annual means on the MIPAS pressure–latitude grid.
spheric midlatitude region (35–50◦N), respectively. Subse-quently, vertical profiles of mean model–MIPAS differences were calculated to provide insight into the tropical transport characteristics. Figure 7 illustrates that the model–MIPAS difference of tropical mean age is almost identical for all models; i.e. the model simulations produce similar mean ages that are younger than MIPAS-observed mean ages. Knowing that mean age represents the combined effects of ascent and mixing, we separately look at the tropical ascent rate, which is assessed by the horizontal mean age gradient, calculated as the difference between midlatitude and tropical mean ages. The model–MIPAS difference of the tropical ascent rate is shown in Fig. 8, indicating that ACTM and LMDz simulate tropical ascent in a similar way. The TM5-modeled tropical ascent is faster compared to ACTM and LMDz. Finally, these model transport diagnostics indicate model-to-model differ-ences in the simulation of tropical ascent, which are likely to cause an inter-model spread in model stratospheric CH4
fields.
Tropical ascent
-2 -1 0 1 2
Model-obs age gradient [yr] 30
50
70
100
Pressure [hPa]
ACTM TM5 LMDZ
Figure 8.Model–MIPAS differences of the mean age gradient as a
transport diagnostics for tropical ascent. The mean age gradient was calculated as the difference between the lower stratospheric mean ages averaged over 35–50◦N and 10◦S–10◦N. Mean age data in years (yr) are calculated as annual means on the MIPAS pressure– latitude grid.
the JRA-25 reanalysis data (Onogi et al., 2007), which are known to have several deficiencies compared to the newer JRA-55 data (Ebita et al., 2011). However, testing ACTM with both ERA-Interim/40 and JRA-25/55 has not produced significant differences in CH4simulations (P. Patra, personal
communication, 2016). Besides that, we do not expect that the poor representation of stratospheric CH4by ACTM (with
67 vertical levels) is impacted by a coarse vertical model grid resolution, as seen for an older version of LMDz (Locatelli et al., 2015).
5.2 Significance of satellite data range
The model correction with satellite-based CH4 fields has
an impact on the XCH4 model–TCCON agreement, but
the significance of this impact is diverse for the models. For ACTM, both satellite-based CH4 fields, in particular
MIPAS_ACE, clearly yield an improved model–TCCON agreement. For TM5 and LMDz, the model–TCCON agree-ment can be slightly improved (with MIPAS), but also re-duced (with MIPAS_ACE). Thereby, we assert that orig-inal XCH4 simulations from TM5 and LMDz lie inside
the range that is spanned by the two satellite-based CH4
fields. The most prominent feature of the satellite data range lies within the lower stratosphere where MIPAS-retrieved CH4mixing ratios are up to 200 ppb higher than
ACE-FTS-retrieved CH4 mixing ratios. Plieninger et al. (2016) also
found a similar high bias for MIPAS CH4data in comparison
to satellite-based CH4 observations from SCIAMACHY or
HALOE (HALogen Occultation Experiment). Furthermore, they showed that surface measurements provide CH4
mix-ing ratios with slightly lower values than MIPAS-retrieved CH4 mixing ratios of the upper troposphere, a finding that
is against expectation. For these reasons, it is likely that our satellite data range is dominated by high biased lower strato-spheric MIPAS CH4 data. Thus, the model correction with
ACE-FTS-based CH4fields seems more reliable. However, a
definite assessment of the satellite data accuracies is not pos-sible yet due to the lack of an extensive observational data set based on stratospheric in situ measurements.
6 Summary and conclusions
This study analyzed the importance of uncertainties in strato-spheric CH4 in comparisons of modeled and TCCON
ob-served XCH4. Modeled stratospheric CH4fields were
substi-tuted by satellite-retrieved CH4fields from MIPAS and
ACE-FTS. Original and satellite-corrected model CH4fields were
converted to XCH4 and subsequently evaluated by
compar-ison to TCCON XCH4observations from 11 sites. This
ap-proach and the statistical analysis of XCH4model–TCCON
residuals were conducted with three well-established CTMs: ACTM, TM5 and LMDz.
Our model–TCCON XCH4 intercomparison reveals an
inter-model spread in XCH4 bias caused by an inter-model
spread in stratospheric CH4. For ACTM we find a large
av-erage XCH4 bias of 38.1 ppb, in contrast to small average
XCH4 biases of 8.7 ppb for TM5 and 6.8 ppb for LMDz.
The ACTM XCH4bias is reduced by the model correction to
13.7 ppb with MIPAS, and to 3.3 ppb with MIPAS adjusted to ACE-FTS, respectively. For TM5 and LMDz the impact of the model correction with satellite-based CH4 fields is
ambiguous, in that the model XCH4bias can be slightly
re-duced to 4.3 ppb with MIPAS, but can also be increased to 10.8 ppb for TM5 and 20.0 ppb for LMDz with MIPAS ad-justed to ACE-FTS. This implies that for TM5 and LMDz the model representation of stratospheric CH4is located within
the satellite data range mapped by MIPAS and ACE-FTS observations. The annual mean differences between the two satellite-based stratospheric CH4 fields yield a global XCH4
difference range of∼27 ppb.
Possible causes for the inter-model spread in stratospheric CH4have been discussed with an emphasis on model
trans-port characteristics. Applying tropical transtrans-port diagnostics suggests that the poor representation of stratospheric CH4
on model-to-model differences in the simulation of strato-spheric transport (physical parameterizations, reanalysis data sets, vertical/horizontal resolution); e.g., model simulations could be performed with different reanalysis data sets, and/or different physical parameterizations, resulting in a model en-semble for each CTM or a multi-model enen-semble consisting of multiple CTM data sets. This would allow the individual model errors in stratospheric CH4to be assessed more
pre-cisely.
Overall we state that there is a need for improvement in modeling of stratospheric CH4and, thus, XCH4. At the same
time, a better quantification of model errors in stratospheric CH4is limited by the uncertainty of satellite data products as
used in this study. This implies that more stratospheric CH4
in situ observations are required to validate both satellite-retrieved and modeled CH4data. A more accurate evaluation
of modeled stratospheric CH4 fields is particularly
reason-able as these CTMs are used to invert CH4emissions from
XCH4data. As surface emission signals in XCH4are small
compared to co-resident XCH4atmospheric background
lev-els, it is necessary to identify minor XCH4 biases in the
model as done in this study. Of course, an analogous quality requirement is also needed for ground-based and satellite-borne XCH4data. Indeed, as long as unallocated and poorly
understood differences of several parts per billion remain be-tween satellite-borne XCH4data and optimized model fields,
it is difficult to make full benefit of satellite XCH4data to
ro-bustly retrieve regional methane emissions.
7 Data availability
TCCON data are publicly available at http://www.tccon. caltech.edu/; please follow the data use policy described there. For obtaining the model data used in this work, con-tact Prabir Patra ([email protected]) for ACTM, Sander Houweling ([email protected]) for TM5, and Philippe Bousquet ([email protected]) for LMDz. MI-PAS and ACE satellite data are available from the official websites after signing a data protocol.
Acknowledgements. We thank H. P. Schmid (KIT/IMK-IFU) for his continual interest in this work. Our work has been performed as part of the ESA GHG-cci project via subcontract with the University of Bremen. In addition we acknowledge funding by the EC within the InGOS project. A part of work at JAXA was supported by the En-vironment Research and Technology Development Fund (A-1102) of the Ministry of the Environment, Japan. From 2004 to 2011 the Lauder TCCON program was funded by the New Zealand Foun-dation of Research Science and Technology contracts CO1X0204, CO1X0703 and CO1X0406. Since 2011 the program has been funded by NIWA’s Atmosphere Research Program 3 (2011/13 Statement of Corporate Intent). The Darwin and Wollongong TC-CON sites are funded by NASA grants NAG5-12247 and NNG05-GD07G, and Australian Research Council grants DP140101552, DP110103118, DP0879468, LE0668470, and LP0562346. We are
grateful to the DOE ARM program for technical support at the Darwin TCCON site. The Białystok and Orléans TCCON sites are funded by the EU projects InGOS and ICOS-INWIRE, and by the Senate of Bremen. Nicholas Deutscher was supported by an Aus-tralian Research Council fellowship, DE140100178. We are also grateful to P. O. Wennberg for providing TCCON data.
The Atmospheric Chemistry Experiment (ACE), also known as SCISAT, is a Canadian-led mission mainly supported by the Canadian Space Agency and the Natural Sciences and Engineering Research Council of Canada.
The article processing charges for this open-access publication were covered by a Research
Centre of the Helmholtz Association.
Edited by: H. Worden
Reviewed by: C. Frankenberg and one anonymous referee
References
Alexe, M., Bergamaschi, P., Segers, A., Detmers, R., Butz, A., Hasekamp, O., Guerlet, S., Parker, R., Boesch, H., Frankenberg, C., Scheepmaker, R. A., Dlugokencky, E., Sweeney, C., Wofsy, S. C., and Kort, E. A.: Inverse modelling of CH4 emissions for 2010–2011 using different satellite retrieval products from GOSAT and SCIAMACHY, Atmos. Chem. Phys., 15, 113–133, doi:10.5194/acp-15-113-2015, 2015.
Belikov, D. A., Maksyutov, S., Sherlock, V., Aoki, S., Deutscher, N. M., Dohe, S., Griffith, D., Kyro, E., Morino, I., Nakazawa, T., Notholt, J., Rettinger, M., Schneider, M., Sussmann, R., Toon, G. C., Wennberg, P. O., and Wunch, D.: Simulations of column-averaged CO2and CH4using the NIES TM with a hybrid
sigma-isentropic (σ–θ) vertical coordinate, Atmos. Chem. Phys., 13, 1713–1732, doi:10.5194/acp-13-1713-2013, 2013.
Bergamaschi, P., Krol, M., Dentener, F., Vermeulen, A., Meinhardt, F., Graul, R., Ramonet, M., Peters, W., and Dlugokencky, E. J.: Inverse modelling of national and European CH4emissions
us-ing the atmospheric zoom model TM5, Atmos. Chem. Phys., 5, 2431–2460, doi:10.5194/acp-5-2431-2005, 2005.
Bergamaschi, P., Houweling, S., Segers, A., Krol, M., Frankenberg, C., Scheepmaker, R. A., Dlugokencky, E., Wofsy, S. C., Kort, E. A., Sweeney, C., Schuck, T., Brenninkmeijer, C., Chen, H., Beck, V., and Gerbig, C.: Atmospheric CH4in the first decade of
the 21st century: inverse modeling analysis using SCIAMACHY satellite retrievals and NOAA surface measurements, J. Geophys. Res., 118, 7350–7369, doi:10.1002/jgrd.50480, 2013.
Geophys. Res. Lett., 32, L15S01, doi:10.1029/2005GL022386, 2005.
Blumenstock, T., Hase, F., Schneider, M., García, O. E., and Sepúlveda, E.: TCCON data from Izana, Tenerife, Spain, release GGG2014R0, TCCON data archive, hosted by the Carbon Dioxide Information Analysis Center, Oak Ridge National Laboratory, Oak Ridge, Tennessee, USA, doi:10.14291/tccon.ggg2014.izana01.R0/1149295, 2014. Boone, C. D., Walker, K. A., and Bernath, P. F.: Version 3 Retrievals
for the Atmospheric Chemistry Experiment Fourier Transform Spectrometer (ACE-FTS), in: The Atmospheric Chemistry Ex-periment ACE at 10: A Solar Occultation Anthology, edited by: Bernath, P. F., A. Deepak Publishing, Hampton, Virginia, USA, 103–127, 2013.
Brühl, C. and Crutzen, P. J.: The MPIC 2D model, in: NASA Ref. Publ. 1292, 1, 103–104, 1993.
Burrows, J. P., Hölzle, E., Goede, A. P. H., Visser, H., and Fricke, W.: SCIAMACHY – Scanning Imaging Absorption Spectrome-ter for Atmospheric Chartography, Acta Astronautica, 35, 445– 451, 1995.
Cressot, C., Chevallier, F., Bousquet, P., Crevoisier, C., Dlugo-kencky, E. J., Fortems-Cheiney, A., Frankenberg, C., Parker, R., Pison, I., Scheepmaker, R. A., Montzka, S. A., Krummel, P. B., Steele, L. P., and Langenfelds, R. L.: On the consistency between global and regional methane emissions inferred from SCIA-MACHY, TANSO-FTS, IASI and surface measurements, Atmos. Chem. Phys., 14, 577–592, doi:10.5194/acp-14-577-2014, 2014. Buzan, E. M., Beale, C. A., Boone, C. D., and Bernath, P. F.: Global stratospheric measurements of the isotopologues of methane from the Atmospheric Chemistry Experiment Fourier transform spectrometer, Atmos. Meas. Tech., 9, 1095–1111, doi:10.5194/amt-9-1095-2016, 2016.
Dee, D. P., Uppala, S. M., Simmons, A. J., Berrisford, P., Poli, P., Kobayashi, S., Andrae, U., Balmaseda, M. A., Balsamo, G., Bauer, P. Bechtold, P., Beljaars, A. C. M., van de Berg, L., Bid-lot, J., Bormann, N., Delsol, C., Dragani, R., Fuentes, M., Geer, A. J., Haimberger, L., Healy, S. B., Hersbach, H., Hólm, E. V., Isaksen, L., Kållberg, P., Köhler, M., Matricardi, M., McNally, A. P., Monge-Sanz, B. M., Morcrette, J.-J., Park, B.-K., Peubey, C., de Rosnay, P., Tavolato, C., Thépaut, J.-N., and Vitart, F.: The ERA-Interim reanalysis: configuration and performance of the data assimilation system, Q. J. Roy. Meteor. Soc., 137, 553–597, doi:10.1002/qj.828, 2011.
Deutscher, N., Notholt, J., Messerschmidt, J., Weinzierl, C., Warneke, T., Petri, C., Gruppe, P., and Katrynski, K.: TCCON data from Bialystok, Poland, Release GGG2014R0, TCCON data archive, hosted by the Carbon Dioxide Information Analysis Center, Oak Ridge National Laboratory, Oak Ridge, Tennessee, USA, doi:10.14291/tccon.ggg2014.bialystok01.R0/1149277, 2014.
Diallo, M., Legras, B., and Chédin, A.: Age of stratospheric air in the ERA-Interim, Atmos. Chem. Phys., 12, 12133–12154, doi:10.5194/acp-12-12133-2012, 2012.
Dils, B., Buchwitz, M., Reuter, M., Schneising, O., Boesch, H., Parker, R., Guerlet, S., Aben, I., Blumenstock, T., Burrows, J. P., Butz, A., Deutscher, N. M., Frankenberg, C., Hase, F., Hasekamp, O. P., Heymann, J., De Mazière, M., Notholt, J., Suss-mann, R., Warneke, T., Griffith, D., Sherlock, V., and Wunch, D.: The Greenhouse Gas Climate Change Initiative (GHG-CCI):
comparative validation of GHG-CCI SCIAMACHY/ENVISAT and TANSO-FTS/GOSAT CO2 and CH4 retrieval algorithm
products with measurements from the TCCON, Atmos. Meas. Tech., 7, 1723–1744, doi:10.5194/amt-7-1723-2014, 2014. Ebita, A., Kobayashi, S., Ota, Y., Moriya, M., Kumabe, R., Onogi,
K., Harada, Y., Yasui, S., Miyaoka, K., Takahashi, K., Kama-hori, H., Kobayashi, C., Endo, H., Soma, M., Oikawa, Y., and Ishimizu, T.: The Japanese 55-year Reanalysis “JRA-55”: An interim report, SOLA, 7, 149–152, doi:10.2151/sola.2011-038, 2011.
Engel, A., Möbius, T., Bönisch, H., Schmidt, U., Heinz, R., Levin, I., Atlas, E., Aoki, S., Nakazawa, T., Sugawara, S., Moore, F., Hurst, D., Elkins, J., Schauffler, S., Andrews, A., and Boering, K.: Age of stratospheric air unchanged within un-certainties over the past 30 years, Nature Geosci., 2, 28–31, doi:10.1038/ngeo388, 2009.
Fischer, H., Birk, M., Blom, C., Carli, B., Carlotti, M., von Clar-mann, T., Delbouille, L., Dudhia, A., Ehhalt, D., EndeClar-mann, M., Flaud, J. M., Gessner, R., Kleinert, A., Koopman, R., Langen, J., López-Puertas, M., Mosner, P., Nett, H., Oelhaf, H., Perron, G., Remedios, J., Ridolfi, M., Stiller, G., and Zander, R.: MIPAS: an instrument for atmospheric and climate research, Atmos. Chem. Phys., 8, 2151–2188, doi:10.5194/acp-8-2151-2008, 2008. Frankenberg, C., Aben, I., Bergamaschi, P., Dlugokencky, E. J., van
Hees, R., Houweling, S., van der Meer, P., Snel, R., and Tol, P.: Global column-averaged methane mixing ratios from 2003 to 2009 as derived from SCIAMACHY: Trends and variability, J. Geophys. Res., 116, D04302, doi:10.1029/2010JD014849, 2011. Fraser, A., Palmer, P. I., Feng, L., Boesch, H., Cogan, A., Parker, R., Dlugokencky, E. J., Fraser, P. J., Krummel, P. B., Langen-felds, R. L., O’Doherty, S., Prinn, R. G., Steele, L. P., van der Schoot, M., and Weiss, R. F.: Estimating regional methane sur-face fluxes: the relative importance of sursur-face and GOSAT mole fraction measurements, Atmos. Chem. Phys., 13, 5697–5713, doi:10.5194/acp-13-5697-2013, 2013.
Fraser, A., Palmer, P. I., Feng, L., Bösch, H., Parker, R., Dlugo-kencky, E. J., Krummel, P. B., and Langenfelds, R. L.: Estimat-ing regional fluxes of CO2and CH4using space-borne
observa-tions of XCH4: XCO2, Atmos. Chem. Phys., 14, 12883–12895,
doi:10.5194/acp-14-12883-2014, 2014.
Geibel, M. C., Messerschmidt, J., Gerbig, C., Blumenstock, T., Chen, H., Hase, F., Kolle, O., Lavric, J. V., Notholt, J., Palm, M., Rettinger, M., Schmidt, M., Sussmann, R., Warneke, T., and Feist, D. G.: Calibration of column-averaged CH4over Eu-ropean TCCON FTS sites with airborne in-situ measurements, Atmos. Chem. Phys., 12, 8763–8775, doi:10.5194/acp-12-8763-2012, 2012.
Griffith, D. W. T., Deutscher, N., Velazco, V. A., Wennberg, P. O., Yavin, Y., Keppel Aleks, G., Washenfelder, R., Toon, G. C., Blavier, J.-F., Murphy, C., Jones, N., Kettlewell, G., Con-nor, B., Macatangay, R., Roehl, C., Ryczek, M., Glowacki, J., Culgan, T., and Bryant, G.: TCCON data from Dar-win, Australia, Release GGG2014R0, TCCON data archive, hosted by the Carbon Dioxide Information Analysis Center, Oak Ridge National Laboratory, Oak Ridge, Tennessee, USA, doi:10.14291/tccon.ggg2014.darwin01.R0/1149290, 2014a. Griffith, D. W. T., Velazco, V. A., Deutscher, N., Murphy, C.,
Wollon-gong, Australia, Release GGG2014R0, TCCON data archive, hosted by the Carbon Dioxide Information Analysis Cen-ter, Oak Ridge National Laboratory, Oak Ridge, Tennessee, USA, doi:10.14291/tccon.ggg2014.wollongong01.R0/1149291, 2014b.
Haenel, F. J., Stiller, G. P., von Clarmann, T., Funke, B., Eckert, E., Glatthor, N., Grabowski, U., Kellmann, S., Kiefer, M., Lin-den, A., and Reddmann, T.: Reassessment of MIPAS age of air trends and variability, Atmos. Chem. Phys., 15, 13161–13176, doi:10.5194/acp-15-13161-2015, 2015.
Hase, F., Blumenstock, T., Dohe, S., Groß, J., and Kiel, M.: TCCON data from Karlsruhe, Germany, Release GGG2014R0, TCCON data archive, hosted by the Carbon Dioxide Information Analysis Center, Oak Ridge National Laboratory, Oak Ridge, Tennessee, USA, doi:10.14291/tccon.ggg2014.karlsruhe01.R0/1149270, 2014.
Hourdin, F., Musat, I., Bony, S., Braconnot, P., Codron, F., Dufresne, J., Fairhead, L., Filiberti, M., Friedlingstein, P., Grand-peix, J., Krinner, G., Levan, P., Li, Z., and Lott, F.: The LMDz4 general circulation model: climate performance and sensitivity to parametrized physics with emphasis on tropical convection, Clim. Dynam., 27, 787–813, doi:10.1007/s00382-006-0158-0, 2006.
Houweling, S., Krol, M., Bergamaschi, P., Frankenberg, C., Dlugo-kencky, E. J., Morino, I., Notholt, J., Sherlock, V., Wunch, D., Beck, V., Gerbig, C., Chen, H., Kort, E. A., Röckmann, T., and Aben, I.: A multi-year methane inversion using SCIAMACHY, accounting for systematic errors using TCCON measurements, Atmos. Chem. Phys., 14, 3991–4012, doi:10.5194/acp-14-3991-2014, 2014.
Inoue, M., Morino, I., Uchino, O., Nakatsuru, T., Yoshida, Y., Yokota, T., Wunch, D., Wennberg, P. O., Roehl, C. M., Grif-fith, D. W. T., Velazco, V. A., Deutscher, N. M., Warneke, T., Notholt, J., Robinson, J., Sherlock, V., Hase, F., Blumenstock, T., Rettinger, M., Sussmann, R., Kyrö, E., Kivi, R., Shiomi, K., Kawakami, S., De Mazière, M., Arnold, S. G., Feist, D. G., Bar-row, E. A., Barney, J., Dubey, M., Schneider, M., Iraci, L. T., Podolske, J. R., Hillyard, P. W., Machida, T., Sawa, Y., Tsuboi, K., Matsueda, H., Sweeney, C., Tans, P. P., Andrews, A. E., Biraud, S. C., Fukuyama, Y., Pittman, J. V., Kort, E. A., and Tanaka, T.: Bias corrections of GOSAT SWIR XCO2and XCH4
with TCCON data and their evaluation using aircraft measure-ment data, Atmos. Meas. Tech., 9, 3491–3512, doi:10.5194/amt-9-3491-2016, 2016.
Karion, A., Sweeney, C., Tans, P., and Newberger, T.: Aircore: an in-novative atmospheric sampling system, J. Atmos. Ocean. Tech., 27, 1839–1853, doi:10.1175/2010JTECHA1448.1, 2010. Kivi, R., Heikkinen, P., and Kyro, E.: TCCON data from
So-dankyla, Finland, Release GGG2014R0, TCCON data archive, hosted by the Carbon Dioxide Information Analysis Center, Oak Ridge National Laboratory, Oak Ridge, Tennessee, USA, doi:10.14291/tccon.ggg2014.sodankyla01.R0/1149280, 2014. Krol, M., Houweling, S., Bregman, B., van den Broek, M., Segers,
A., van Velthoven, P., Peters, W., Dentener, F., and Bergamaschi, P.: The two-way nested global chemistry-transport zoom model TM5: algorithm and applications, Atmos. Chem. Phys., 5, 417– 432, doi:10.5194/acp-5-417-2005, 2005.
Kulawik, S., Wunch, D., O’Dell, C., Frankenberg, C., Reuter, M., Oda, T., Chevallier, F., Sherlock, V., Buchwitz, M., Osterman, G.,
Miller, C. E., Wennberg, P. O., Griffith, D., Morino, I., Dubey, M. K., Deutscher, N. M., Notholt, J., Hase, F., Warneke, T., Sussmann, R., Robinson, J., Strong, K., Schneider, M., De Maz-ière, M., Shiomi, K., Feist, D. G., Iraci, L. T., and Wolf, J.: Consistent evaluation of ACOS-GOSAT, BESD-SCIAMACHY, CarbonTracker, and MACC through comparisons to TCCON, Atmos. Meas. Tech., 9, 683–709, doi:10.5194/amt-9-683-2016, 2016.
Kurylo, M. J.: Network for the detection of stratospheric change, Proc. SPIE, 1491, 168–174, doi:10.1117/12.46658, 1991. Kuze, A., Suto, H., Nakajima, M., and Hamazaki, T.: Thermal and
near infrared sensor for carbon observation Fourier-transform spectrometer on the Greenhouse Gases Observing SATellite for greenhouse gases monitoring, Appl. Opt., 48, 6716–6733, doi:10.1364/AO.48.006716, 2009.
Laeng, A., Plieninger, J., von Clarmann, T., Grabowski, U., Stiller, G., Eckert, E., Glatthor, N., Haenel, F., Kellmann, S., Kiefer, M., Linden, A., Lossow, S., Deaver, L., Engel, A., Hervig, M., Levin, I., McHugh, M., Noël, S., Toon, G., and Walker, K.: Validation of MIPAS IMK/IAA methane profiles, Atmos. Meas. Tech., 8, 5251–5261, doi:10.5194/amt-8-5251-2015, 2015.
Locatelli, R., Bousquet, P., Chevallier, F., Fortems-Cheney, A., Szopa, S., Saunois, M., Agusti-Panareda, A., Bergmann, D., Bian, H., Cameron-Smith, P., Chipperfield, M. P., Gloor, E., Houweling, S., Kawa, S. R., Krol, M., Patra, P. K., Prinn, R. G., Rigby, M., Saito, R., and Wilson, C.: Impact of transport model errors on the global and regional methane emissions es-timated by inverse modelling, Atmos. Chem. Phys., 13, 9917– 9937, doi:10.5194/acp-13-9917-2013, 2013.
Locatelli, R., Bousquet, P., Saunois, M., Chevallier, F., and Cres-sot, C.: Sensitivity of the recent methane budget to LMDz sub-grid-scale physical parameterizations, Atmos. Chem. Phys., 15, 9765–9780, doi:10.5194/acp-15-9765-2015, 2015.
Meirink, J. F., Bergamaschi, P., and Krol, M. C.: Four-dimensional variational data assimilation for inverse modelling of atmospheric methane emissions: method and comparison with synthesis inversion, Atmos. Chem. Phys., 8, 6341–6353, doi:10.5194/acp-8-6341-2008, 2008.
Messerschmidt, J., Geibel, M. C., Blumenstock, T., Chen, H., Deutscher, N. M., Engel, A., Feist, D. G., Gerbig, C., Gisi, M., Hase, F., Katrynski, K., Kolle, O., Lavric, J. V., Notholt, J., Palm, M., Ramonet, M., Rettinger, M., Schmidt, M., Suss-mann, R., Toon, G. C., Truong, F., Warneke, T., Wennberg, P. O., Wunch, D., and Xueref-Remy, I.: Calibration of TCCON column-averaged CO2: the first aircraft campaign over
Euro-pean TCCON sites, Atmos. Chem. Phys., 11, 10765–10777, doi:10.5194/acp-11-10765-2011, 2011.
Monge-Sanz, B. M., Chipperfield, M. P., Simmons, A. J., and Up-pala, S. M.: Mean age of air and transport in a CTM: compar-ison of different ECMWF analyses, Geophys. Res. Lett., 340, L04801, doi:10.1029/2006GL028515, 2007.
Monge-Sanz, B. M., Chipperfield, M. P., Dee, D. P., Simmons, A. J., and Uppala, S. M.: Improvements in the stratospheric trans-port achieved by a chemistry transtrans-port model with ECMWF (re)analyses: identifying effects and remaining challenges, Q. J. Roy. Meteor. Soc., 139, 654–673, doi:10.1002/qj.1996, 2013. Monteil, G., Houweling, S., Butz, A., Guerlet, S., Schepers, D.,