www.nonlin-processes-geophys.net/15/999/2008/ © Author(s) 2008. This work is distributed under the Creative Commons Attribution 3.0 License.
Nonlinear Processes
in Geophysics
Granulometric characterization of sediments transported by surface
runoff generated by moving storms
J. L. M. P. de Lima1,2, C. S. Souza2, and V. P. Singh3
1Department of Civil Engineering, Faculty of Science and Technology – Campus 2, University of Coimbra, 3030-788 Coimbra, Portugal
2Institute of Marine Research – Coimbra Interdisciplinary Centre, Coimbra, Portugal
3Department of Biological and Agricultural Engineering, Texas A and M University, Scoates Hall, 2117 TAMU, College Station, Texas 77843-2117, USA
Received: 8 May 2008 – Revised: 22 October 2008 – Accepted: 4 November 2008 – Published: 16 December 2008
Abstract. Due to the combined effect of wind and rain, the
importance of storm movement to surface flow has long been recognized, at scales ranging from headwater scales to large basins. This study presents the results of laboratory experi-ments designed to investigate the influence of moving rain-fall storms on the dynamics of sediment transport by surface runoff. Experiments were carried out, using a rain simulator and a soil flume. The movement of rainfall was generated by moving the rain simulator at a constant speed in the up-stream and downup-stream directions along the flume. The main objective of the study was to characterize, in laboratory con-ditions, the distribution of sediment grain-size transported by rainfall-induced overland flow and its temporal evolution. Grain-size distribution of the eroded material is governed by the capacity of flow that transports sediments. Granulomet-ric curves were constructed using conventional hand sieving and a laser diffraction particle size analyser (material below 0.250 mm) for overland flow and sediment deliveries col-lected at the flume outlet. Surface slope was set at 2%, 7% and 14%. Rainstorms were moved with a constant speed, upslope and downslope, along the flume or were kept static. The results of laboratory experiments show that storm move-ment, affecting the spatial and temporal distribution of rain-fall, has a marked influence on the grain-size characteristics of sediments transported by overland flow. The downstream-moving rainfall storms have higher stream power than do other storm types.
Correspondence to: J. L. M. P. de Lima ([email protected])
1 Introduction
The soil material transported by overland flow is important for water quality management, environmental decision mak-ing, urban management and sustainability of ecosystems. The objective of this study is to enhance the understanding of water erosion factors and processes.
1000 J. L. M. P. de Lima et al.: Sediments transported by runoff generated by moving storms of rainfall over basins, particularly upstream or downstream.
They have found a significant influence of the direction of rainfall on runoff and sediment transport.
Erosion of soil by water is a natural phenomenon that in-fluences the origin and dynamics of landscapes; it thus plays an important role in the evolution of ecosystems. Under-standing the factors that affect water erosion are fundamental for planning and designing measures for soil conservation, particularly where the intensive use of soil has been degrad-ing land and water. Erosion of soil by water is caused by the combined and the simultaneous effect of the processes of dis-aggregating soil aggregates by the impact of rain drops and runoff and then the transport of these aggregates by runoff (e.g., R¨omkens et al., 1997; Meyer, 1981). Any factor that influences runoff characteristics consequently affects the ero-sion of soil by water.
Although processes such as infiltration, runoff and wa-ter erosion have been extensively studied using rain simu-lators, the great majority of these studies used constant rain-fall intensities, thus differing considerably from the charac-teristics of natural rainfall, which is highly variable in both time and space (e.g., Huff, 1967; Eagleson, 1978; Sharon, 1980; Willems, 2001). The spatial and temporal distribu-tion of rainfall is one of the main factors affecting runoff on slopes.
This study attempts to characterize the grain-size distribu-tion of sediments carried by runoff, allowing for the evalua-tion of the influence of rainfall storm movement (upstream, downstream or static) and of the soil flume gradient (which varied as 2%, 7% and 14%) on the grain-size. This evolution, evaluated by grain-size distribution curves, was then related to the respective runoff hydrographs, thus identifying the part of the hydrograph with greater erosive impact on soil; this part could be the rising or falling limb or the peak discharge of the runoff hydrograph.
2 Methodology
The methodology used to conduct the experiments was di-vided into two phases: (i) Simulation of rainfall events and obtaining the hydrographs of direct runoff; and (ii) character-ization of the transported sediments by runoff (e.g., temporal evolution and granulometry analysis).
2.1 Rainfall simulator
Erosion of soil by water has been studied extensively, both in the field and in laboratory, with rain simulators (e.g., Mor-gan, 1995). The rain simulator (Fig. 2) comprises a constant level reservoir, a pump, a system of hoses, a stand, 2 elec-tric engines, 1 automatic control panel to control the speed at which the apparatus moves, and a sprinkler (nozzles from Spraying Systems Co.) fixed on a connecting rod in the stand 2.20 m above the surface of the flume.
The rainfall used in the laboratory experiments had the spatial distribution presented in Fig. 1 as a consequence of a constant pressure of 2 bar, corresponding to a discharge of 12 l/min. To measure the rainfall intensity distribution under the rainfall simulator, 70 gauges were used in a 0.3×0.3 m2 square grid of covering an area of 2.7 m long and 1.8 m wide. Given the flume area and the pre-established duration of rain-fall, this discharge is the equivalent of a rainfall intensity of 138 mm/h, which, for Coimbra (Portugal), can be related to a return period of about 2 years. As in other natural situations, the spatial distribution of simulated rainfall is not uniform: in the catchment area affected by rainfall the intensity is higher in some parts and lower in others. This characteristic of rain-fall has been described by Bras and Rodrigues-Iturbe (1976), Sivapalan and Wood (1986) and Willems (2001), and others. Rainfall moving upstream and downstream at a constant speed was simulated over a laboratory soil flume. The rain-fall movement was achieved by moving the wheeled stand holding the nozzle over the flume. The static rainfall had the nozzle mounted on the vertical line that contains the geomet-ric centre of the flume.
The experimental apparatus was moved on wheels on a steel rail, powered by 2 electric motors. The speed of the rain simulator was kept at a constant speed of 1.97 m/min, which corresponds to a total of 3.3 litres of water falling on the flume surface. The duration of the static rainfall was de-termined so as to guarantee a rainfall volume equal to the moving rain events. It should also be noted that the labora-tory experiments were performed without wind, and there-fore do not entirely represent the real wind-driven rain con-ditions (no added horizontal wind component). This paper deals mainly with the spatial and temporal distribution of the rainfall, as a consequence of the movement of the rainfall simulators, which is one of the main factors affecting runoff on slopes.
2.2 Soil flume
The soil flume was made of zinc-coated iron and was 3.00 m long, 0.30 m wide and 0.10 m deep. The structure allowed the channel slope to be altered by means of adjustable screws. The surface flow was collected at the lower end of the flume. In this study both the type of rainstorm and the soil flume gra-dient were varied, the latter by using the following gragra-dients: 2%, 7% and 14%. The slope gradient is one of the critical factors controlling soil erosion caused by runoff (e.g., Bryan and Poesen, 1989).
Figure 1
Figure 2
Dista
nce (
cm)
-90 -60 -30 0 30 60 90
-140 -110 -80 -50 -20 10 40 70 100 130
0 20 40 60 80 100 120 140 160 180 200 220 240 260
20 40 60 80 100 120 140 160 180 200 220 240
Distance (cm)
Rainfall intensity (mm/h)
Dista
nce (
cm)
-90 -60 -30 0 30 60 90
-140 -110 -80 -50 -20 10 40 70 100 130
0 20 40 60 80 100 120 140 160 180 200 220 240 260
20 40 60 80 100 120 140 160 180 200 220 240
Distance (cm)
Rainfall intensity (mm/h)
Nozzle
Hose Support structure
for rainfall simulator
Soil flume
Reservoir
Pump
Track Electric
motor
Collection of runoff
Fig. 1. Spatial distribution of rainfall under a nozzle: Left: 2-D representation and Right: 3-D distribution. •Location of vertical that
contains the nozzle.
Figure 1
Figure 2
Dista nce (
cm)
-90 -60 -30 0 30 60 90
-140 -110 -80 -50 -20 10 40 70 100 130
0 20 40 60 80 100 120 140 160 180 200 220 240 260
20 40 60 80 100 120 140 160 180 200 220 240
Distance (cm)
Rainfall intensity (mm/h)
Dista nce (
cm)
-90 -60 -30 0 30 60 90
-140 -110 -80 -50 -20 10 40 70 100 130
0 20 40 60 80 100 120 140 160 180 200 220 240 260
20 40 60 80 100 120 140 160 180 200 220 240
Distance (cm)
Rainfall intensity (mm/h)
Nozzle
Hose Support structure
for rainfall simulator
Soil flume
Reservoir
Pump
Track Electric
motor
Collection of runoff
Fig. 2. Laboratory set-up.
clay, 9% silt and 84% sand and gravel. The soil texture in-formation is listed in Table 1.
2.3 Laboratorial procedure
During experimentation, it was observed that there was al-ways a larger quantity of fine particles transported in the first simulated rains; so each rainfall type was repeated 4 times for observing differences in granulometric characteristics. To ensure identical initial conditions, the soil material placed in the flume was replaced with original soil before each rain
Table 1. Particle size distribution of the experimental soil.
Material Particle Size (mm) Distribution (%)
Clay 0–0.0062 6.64
Silt 0.0062–0.0233 3.23
0.0233–0.1500 6.30 Sand and Gravel
0.1500 - 0.5000 31.60 0.5000–4.7600 40.72 4.7600–19.1000 11.51
type and was subjected to a standard treatment. The soil was first sieved to remove coarser particles and organic ma-terial, and then placed in the soil flume in a series of layers to achieve a 0.10 m thick layer of uniform depth. Before each repetition the surface layer’s water content was controlled by imposing a 30 min interval between simulated rainstorm events. The volumetric soil water content was approximately 20% (determined by Time-Domain-Reflectometer measure-ments) just before the start of each storm event.
1002 J. L. M. P. de Lima et al.: Sediments transported by runoff generated by moving storms
2 %
0,0 7,5 15,0 22,5 30,0 37,5 45,0
0 50 100 150 200 250 300
Time - s
Li
q
u
id
F
lo
w
mL/
s
0,0 0,1 0,2 0,3 0,4 0,5
Sol
id
Fl
ow
g
/
s
Liquid Downstream Upstream Static Solid Downstream Upstream Static
7 %
0,0 7,5 15,0 22,5 30,0 37,5 45,0
0 50 100 150 200 250 300
Time - s
L
iqui
d F
lo
w
m
L
/
s
0,0 0,5 1,0 1,5 2,0
So
lid
F
lo
w
g
/
s
Liquid Downstream Upstream Static Solid Downstream Upstream Static
14 %
0,0 7,5 15,0 22,5 30,0 37,5 45,0
0 50 100 150 200 250 300
Time - s
L
iqui
d F
lo
w
m
L
/s
0,0 0,5 1,0 1,5 2,0 2,5 3,0 3,5
So
lid
Fl
ow
g
/
s
Liquid Downstream Upstream Static Solid Downstream Upstream Static
Su
rf
ac
e R
un
of
f
–
m
L
/s
Su
rf
ac
e R
un
of
f
–
m
L
/s
Su
rf
ac
e R
un
off
–
m
L
/s
T
rans
po
rt
ed S
ed
im
ent
–
g/
s
T
rans
po
rt
ed S
edi
m
ent
–
g/
s
T
ra
ns
po
rt
ed S
edi
m
ent
–
g/
s
Figure 3
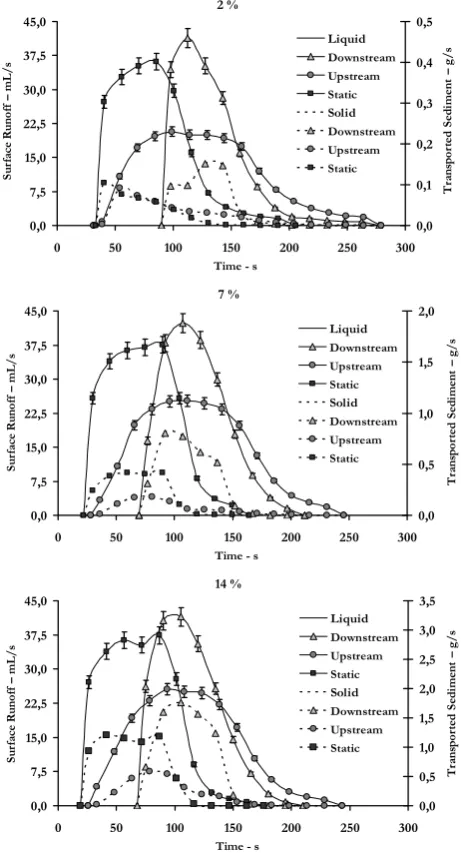
Fig. 3. Runoff hydrographs and respective eroded material for
dif-ferent slopes (2%, 7% and 14%) and for the 3 types of storms stud-ied (downstream, upstream and static).
was simulated under free draining conditions. Solid weight was obtained by drying the samples in order to character-ize the temporal evolution of runoff and sediment discharge. The amount of sediment transported by overland flow was estimated by low temperature oven drying of runoff samples. After drying the runoff samples, the transported sediments underwent grain-size characterization in order to evaluate how their texture evolved over time. There were two dis-tinct phases in this step: one using the laser diffraction par-ticle size analyzer (for parpar-ticles finer than 0.25 mm), and the other using conventional sieving (for particles coarser than 0.25 mm). The material whose particle size was less than 0.25 mm, suspended in the liquid medium, was analyzed by
the equipment, and the other fraction was dried and sieved conventionally.
Soil detachment significantly changes with windward and leeward slopes under wind-driven rains This means that, apart from the transport capacity of the overland flow, the delivery of the detached particles to the flow will be differ-ent when the rainfall is upstream-moving from when it is downstream-moving (Erpul, 2003a, 2005, 2008). In fact the experiments do not entirely represent wind-driven rains. The paper deals more with the spatial and temporal distribution of the rainfall which is a consequence of the combined action of wind and rain.
3 Results and discussion
3.1 Hydrographs and transport of sediments
Figure 3 presents runoff hydrographs (mean and standard deviation for 4 rain events) and their respective transported sediments for different gradients of the soil flume (2%, 7% and 14%) as a function of storm type (storms moving down-stream and updown-stream, and static storms). It is observed that the distribution of both discharge and soil material trans-ported by runoff depends strongly on the storm type. Due to their reduced variability, the upstream-moving rainfall storms yielded runoff hydrographs with a smaller standard deviation than did other rainfall storm types. The same was found for the soil material transported.
The time to start runoff was affected by both the type of storm and the slope of the soil flume. The time was greater for a flume slope with a smaller gradient. The runoff caused by the downstream-moving rainfall started later, because this event began at the upstream end of the flume. However, due to greater infiltration, it produced a smaller runoff volume than did other rainfall storm types. For this type of event, peak discharge was reached sooner and had a higher value.
The upstream-moving storm was the least erosive storm type, with solid transport being less efficient than other storm types. This can be explained because this kind of storm is characterized by runoff hydrographs with earlier rise, lower peak discharge, less steeply-rising limb, and a longer base time when compared with other storm types. The downstream-moving storm was the most erosive for soil in terms of both the amount of material carried by runoff and the maximum flux of sediments. The effect of the static storm was midway between the other two types.
As seen from Figs. 3 and 4, the soil flume slope had little effect on the hydrograph shape and the peak discharge, but it had a strong influence on the transport of sediments. This is because a steeper gradient increases the transport capacity of runoff, regardless of the storm type.
Table 2. Runoff hydrographs and related sediment characteristics for different types of storms and for the 3 slopes studied. Runof f h ydrograph and
Type of Storm: Downstream Upstream Static
sediments
characteristics
Flume Slope: 2% 7% 14% 2% 7% 14% 2% 7% 14%
Total Runoff Flow (mL) 2 608.47 2 960.32 2 918.17 2 723.79 3 079.75 2 929.98 2 916.20 3 157.65 3 182.12
Peak Runoff (mL/s) 41.35 42.31 41.45 20.73 25.28 25.55 36.13 37.58 37.41
Total Sediments Transported (g) 8.14 46.98 105.98 6.19 12.70 39.50 5.60 29.90 91.13
Peak Sediments Transported (g/s) 0.152 0.801 1.763 0.092 0.178 0.586 0.104 0.419 1.207
Time to Peak (s) 112.50 107.00 105.00 99.00 110.75 93.25 85.50 89.50 86.50
Beginning Runoff Time (s) 90.00 69.50 67.50 31.50 28.25 25.75 33.00 22.00 19.00
Percentage of sand, silt and clay.
Sand (%) 36.51 84.41 78.15 18.05 49.61 67.97 8.79 76.70 76.39
Silt (%) 44.11 12.15 16.52 60.98 38.57 24.26 66.36 17.22 17.00
Clay (%) 19.38 3.44 5.33 20.97 11.82 7.77 24.85 6.08 6.61
Note: The sediment transport peak did not always coincide with the peak discharge.
0 5 10 15 20 25 30 35 40 45
0 50 100 150 200 250 300
Time - s
L iq u id F lo w m L /s Downstream Upstream Static 2 % 7 % 14 % 0,00 0,50 1,00 1,50 2,00
0 50 100 150 200 250 300
Time - s
So lid F lo w g / s Downstream Upstream Static 2 % 7 % 14 % T ra n spo rt ed S edi m ent – g /s Su rf ace R u n of f – m L /s Figure 4
Fig. 4. Comparison of runoff hydrographs and respective eroded
material for the different slopes and storm types.
Figure 5 shows the total amount of soil transported by runoff for different storm types and surface gradients stud-ied. It can be concluded that: (i) a steeper slope increases the transported sediments; and (ii) of the various storm types, the downstream-moving storm is the one with the greatest capacity to transport sediments.
Figure 6 shows the values of peak discharge and respec-tive peak sediment flows for different rainfall storms and soil flume gradients. As with the total amount of soil loss, the maximum flow of sediments, for a particular event, was also affected by the storm type and flume gradient. It was
ob-14% 7% 2% Upstream Static Downstream 117,76 52,20 9,04 101,26 33,23 6,23 43,89 14,11 6,88 0 20 40 60 80 100 120 Se dim ent lo ss - g / m 2 Flume Slope Type Type of s
torm 14% 7% 2% Upstream Static Downstream 117,76 52,20 9,04 101,26 33,23 6,23 43,89 14,11 6,88 0 20 40 60 80 100 120 Se dim ent lo ss - g / m 2 Flume Slope Type Type of s
torm Figure 5 35,18 20,02 29,69 42,31 25,28 37,58 41,45 25,04 37,41
0,098 0,059 0,039 0,801 0,178 0,419 1,597 0,586 1,187 0,0 0,5 1,0 1,5 2,0 2,5 0,0 7,5 15,0 22,5 30,0 37,5 45,0
Dow Ups Sta Dow Ups Sta Dow Ups Sta
T ra n sp or te d Se di m en t -g/s Sur fa ce Ru no ff -m L / s Peak Surface Runoff Peak Transported Sediment
2% 7% 14%
Figure 6
Fig. 5. Total soil loss caused by different rainfall events as a
func-tion of slope and storm type.
14% 7% 2% Upstream Static Downstream 117,76 52,20 9,04 101,26 33,23 6,23 43,89 14,11 6,88 0 20 40 60 80 100 120 Se dim ent lo ss - g / m 2 Flume Slope Type Type
of s
torm 14% 7% 2% Upstream Static Downstream 117,76 52,20 9,04 101,26 33,23 6,23 43,89 14,11 6,88 0 20 40 60 80 100 120 Se dim ent lo ss - g / m 2 Flume Slope Type Type
of s
torm Figure 5 35,18 20,02 29,69 42,31 25,28 37,58 41,45 25,04 37,41
0,098 0,059 0,039 0,801 0,178 0,419 1,597 0,586 1,187 0,0 0,5 1,0 1,5 2,0 2,5 0,0 7,5 15,0 22,5 30,0 37,5 45,0
Dow Ups Sta Dow Ups Sta Dow Ups Sta
T ra n sp or te d Se di m en t -g/s Sur fa ce Ru no ff -m L / s Peak Surface Runoff Peak Transported Sediment
2% 7% 14%
Figure 6
Fig. 6. Peak surface runoff and peak transported sediment for
1004 J. L. M. P. de Lima et al.: Sediments transported by runoff generated by moving storms
Figure 7
Downstream
2 %
Static Upstream
7 %
14 %
Time
1 2 3 4 5 6 7 8 9 1 2 3 4 5 6 7 8 9 10 11 12 13 14 1 2 3 4 5 6 7 8 9 10
Sand Silt Clay
Samples (every 15 s)
Downstream
2 %
Static Upstream
7 %
14 %
Time
1 2 3 4 5 6 7 8 9 1 2 3 4 5 6 7 8 9 10 11 12 13 14 1 2 3 4 5 6 7 8 9 10
Sand Silt Clay
Samples (every 15 s)
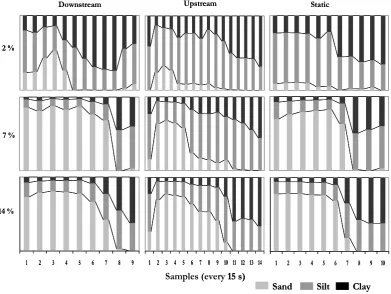
Fig. 7. Granulometric evolution of the collected runoff samples (every 15 s), as a function of slope for the three different storm types.
served that: (i) the maximum flow of sediments carried by runoff increased with the flume gradient; (ii) peak discharge was more influenced by the storm type than by the flume gradient, and was greater for the downstream-moving storm than for the upstream moving storm.
3.2 Grain-size evolution of sediments transported by runoff The grain-size evolution of the sediments transported by runoff was investigated. Runoff carried fine material first, and when peak discharge was reached a coarser material was found. In the falling limb of the hydrograph after rainfall ceased, the sediments basically consisted of fine particles because the direct impact of drops was no longer present, strongly reducing the soil detachment capacities of the shal-low overland fshal-low sheet. This behaviour was observed for all storm types of storms and flume gradients. However, it was found that the grain-size of the transported sediments was more akin to the original soil when the flume gradient was steeper.
Figure 7 shows the grain-size evolution (% sand, % silt and % clay) of the transported sediments, collected every 15 s, for different storm types and flume gradients (see also the three last rows of Table 2 for the average values). The percentage of coarse material (sand) increased with steepen-ing flume gradient, due to greater flow energy. It was found
that the downstream-moving storm had the greatest capacity to transport coarser material, followed by the static storm and then the upstream-moving storm. It can also be observed that the percentage of sand was greater at peak discharge.
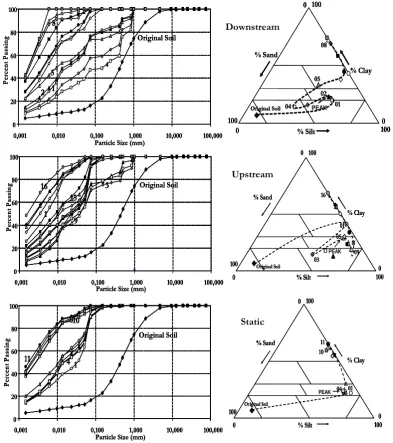
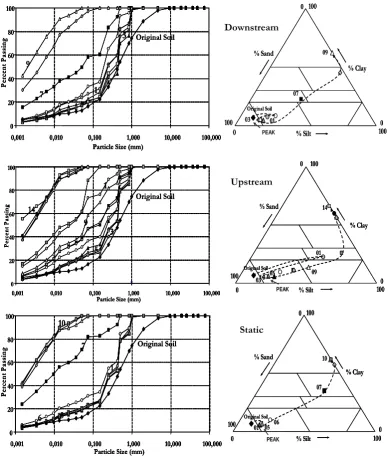
Storm movement also affected the characteristics of sed-iments transported by overland flow. Figures 8, 9 and 10 present granulometric curves of sediments transported by three storm events (rainfall moving downstream and up-stream, and static storm), collected at regular time intervals (every 15 s) until runoff ceased. The curves show the sedi-ments evolution over time. This behaviour can also be seen in the path observed in the USDA textural classification chart (triangle).
Figure 8 Original Soil 1 2 4 5 8 0 20 40 60 80 100
0,001 0,010 0,100 1,000 10,000 100,000
Particle Size (mm)
P er cen t P as si ng 01 03 05 09 16 Original Soil % Sand % Clay % Silt 0 100 0 100 0 100 PEAK Original Soil 1 3 5 9 16 0 20 40 60 80 100
0,001 0,010 0,100 1,000 10,000 100,000
Particle Size (mm)
P er cen t P ass in g Original Soil 1 4 10 01 04 10 11 Original Soil % Sand % Clay % Silt 0 100 0 100 0 100 PEAK 11 0 20 40 60 80 100
0,001 0,010 0,100 1,000 10,000 100,000
Particle Size (mm)
Pe rc en t Pa ss ing 01 02 04 05 08 Original Soil % Sand % Clay % Silt 0 100 0 100 0 100 PEAK Original Soil 1 2 4 5 8 0 20 40 60 80 100
0,001 0,010 0,100 1,000 10,000 100,000
Particle Size (mm)
P er cen t P as si ng 01 03 05 09 16 Original Soil % Sand % Clay % Silt 0 100 0 100 0 100 PEAK Original Soil 1 3 5 9 16 0 20 40 60 80 100
0,001 0,010 0,100 1,000 10,000 100,000
Particle Size (mm)
P er cen t P ass in g Original Soil 1 4 10 01 04 10 11 Original Soil % Sand % Clay % Silt 0 100 0 100 0 100 PEAK 11 0 20 40 60 80 100
0,001 0,010 0,100 1,000 10,000 100,000
Particle Size (mm)
Pe rc en t Pa ss ing Original Soil 1 2 4 5 8 0 20 40 60 80 100
0,001 0,010 0,100 1,000 10,000 100,000
Particle Size (mm)
P er cen t P as si ng 01 03 05 09 16 Original Soil % Sand % Clay % Silt 0 100 0 100 0 100 PEAK Original Soil 1 3 5 9 16 0 20 40 60 80 100
0,001 0,010 0,100 1,000 10,000 100,000
Particle Size (mm)
P er cen t P ass in g Original Soil 1 4 10 01 04 10 11 Original Soil % Sand % Clay % Silt 0 100 0 100 0 100 PEAK 11 0 20 40 60 80 100
0,001 0,010 0,100 1,000 10,000 100,000
Particle Size (mm)
Pe rc en t Pa ss ing 01 02 04 05 08 Original Soil % Sand % Clay % Silt 0 100 0 100 0 100 PEAK 01 02 04 05 08 Original Soil % Sand % Clay % Silt 0 100 0 100 0 100 PEAK Downstream Upstream Static
Fig. 8. Granulometric evolution of sediments for 2% soil flume slope and for 3 storms types: Left: Granulometric curves; and Right:
Trajectories in the USDA textural classification chart (triangle).
of finer material (silt and clay). However, this percentage of fine material decreases as the flume gradient increases. As a consequence, the granulometric curves are further away from the curve of the original soil, compared with the other storm types.
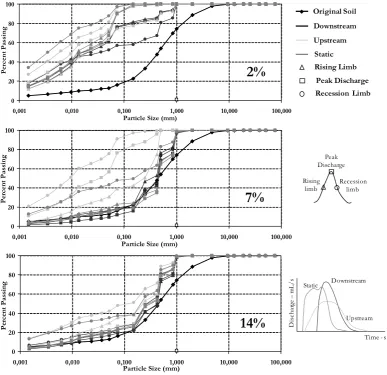
Figure 11 shows the granulometric curve relating to the rising and falling limbs and peak discharge for the 3 types of storms and flume gradients studied. It was found that the rising limb and peak discharge had a greater erosive capacity, and were mostly made up of coarser material, regardless of the flume slope. This can be explained by the raindrop impact effects on overland flow transport capacity. Since the kinetic
energy of impacting raindrops is much greater than that of shallow overland flow, it is expected that coarser material is mostly transported during the rising limb.
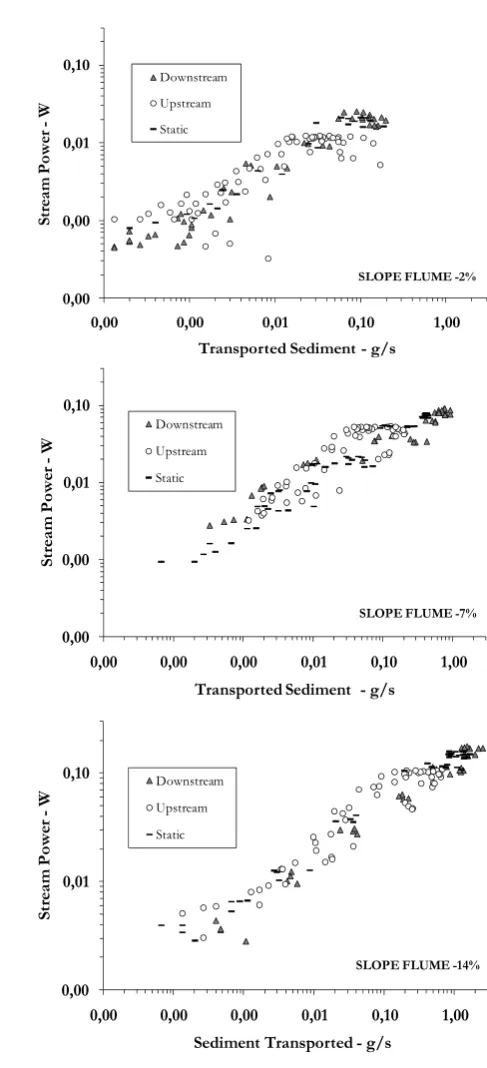
3.3 Stream power and sediment transport
1006 J. L. M. P. de Lima et al.: Sediments transported by runoff generated by moving storms
Figure 9
0 20 40 60 80 100
0,001 0,010 0,100 1,000 10,000 100,000
Particle Size (mm)
P
er
cent
P
ass
in
g
0 20 40 60 80 100
0,001 0,010 0,100 1,000 10,000 100,000
Particle Size (mm)
Pe
rc
en
t Pa
ss
in
g
01
03
06 09
14
Original Soil % Sand
% Clay
% Silt
0 100
0 100
0
100 PEAK
1
Original Soil
3 6
9
14
0 20 40 60 80 100
0,001 0,010 0,100 1,000 10,000 100,000
Particle Size (mm)
Pe
rc
en
t Pa
ss
in
g 13 Original Soil
7 8
01 03
07
08
Original Soil
% Sand
% Clay
% Silt
0 100
0 100
0 100
PEAK
01
05 06
07 09
Original Soil
% Sand
% Clay
% Silt
0 100
0 100
0 100
PEAK
Original Soil
1
5 6 7
9
0 20 40 60 80 100
0,001 0,010 0,100 1,000 10,000 100,000
Particle Size (mm)
P
er
cent
P
ass
in
g
0 20 40 60 80 100
0,001 0,010 0,100 1,000 10,000 100,000
Particle Size (mm)
P
er
cent
P
ass
in
g
0 20 40 60 80 100
0,001 0,010 0,100 1,000 10,000 100,000
Particle Size (mm)
Pe
rc
en
t Pa
ss
in
g
0 20 40 60 80 100
0,001 0,010 0,100 1,000 10,000 100,000
Particle Size (mm)
Pe
rc
en
t Pa
ss
in
g
01
03
06 09
14
Original Soil % Sand
% Clay
% Silt
0 100
0 100
0
100 PEAK
1
Original Soil
3 6
9
14
0 20 40 60 80 100
0,001 0,010 0,100 1,000 10,000 100,000
Particle Size (mm)
Pe
rc
en
t Pa
ss
in
g 13 Original Soil
7 8
01 03
07
08
Original Soil
% Sand
% Clay
% Silt
0 100
0 100
0 100
PEAK
01
05 06
07 09
Original Soil
% Sand
% Clay
% Silt
0 100
0 100
0 100
PEAK
Original Soil
1
5 6 7
9
Static Downstream
Upstream
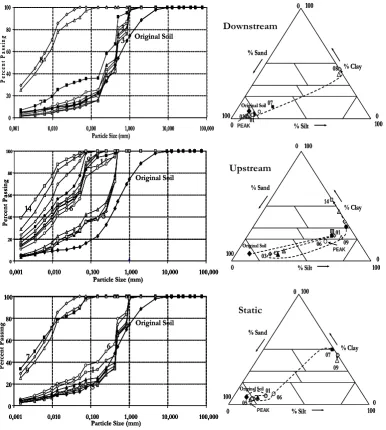
Fig. 9. Granulometric evolution of sediments for 7% soil flume slope and for 3 storms types: Left: Granulometric curves; and Right:
Trajectories in the USDA textural classification chart (triangle).
the highest capacity for the transport of sediments. Static storms have a transport capacity in between downstream and upstream moving storms.
Bagnold (1966) adopted stream power as a theoretical basis for evaluating bedload transport. Since then, stream power has been widely used to better understand such pro-cesses in runoff, riverbeds and channels. Stream Power is the energy available to transport sediment. Stream Power per unit length of channel (W m−1)(e.g., Worthy, 2005; Rose, 2004; Fitzgerald and Bowden, 2006) is:
=γ Qs (1)
whereγ is the specific weight of water (9.810 N m−3), Q
is the water discharge (m3s−1), ands is the energy slope (m m−1), which may be approximated by the channel bed slope (s0).
If we want to determine stream power for a certain short rainfall event (static or moving under wind), we have to con-sider the variation of runoff, in time, which represent the hy-drologic response of the drainage area (the flume surface in these experiments). For the specific laboratory conditions described in this article, stream power can be calculated as:
T =γ n
P
i=1
Qi
Figure 10 01 03 07 09 Original Soil % Sand % Clay % Silt 0 100 0 100 0 100 PEAK 0 20 40 60 80 100
0,001 0,010 0,100 1,000 10,000 100,000
Particle Size (mm)
Pe rc en t Pas si ng 0 20 40 60 80 100
0,001 0,010 0,100 1,000 10,000 100,000
Particle Size (mm)
Pe rc en t P as si ng
01 05 06
07 10 Original Soil % Sand % Clay % Silt 0 100 0 100 0 100 PEAK Original Soil 1 5 7 10 6 0 20 40 60 80 100
0,001 0,010 0,100 1,000 10,000 100,000
Particle Size (mm)
Pe
rc
en
t Pas
si
ng Original Soil
1 3 7 9 Original Soil 1 3 5 9 14 01
03 05 09
14 Original Soil % Sand % Clay % Silt 0 100 0 100 0 100 PEAK 01 03 07 09 Original Soil % Sand % Clay % Silt 0 100 0 100 0 100 PEAK 0 20 40 60 80 100
0,001 0,010 0,100 1,000 10,000 100,000
Particle Size (mm)
Pe rc en t Pas si ng 0 20 40 60 80 100
0,001 0,010 0,100 1,000 10,000 100,000
Particle Size (mm)
Pe rc en t P as si ng
01 05 06
07 10 Original Soil % Sand % Clay % Silt 0 100 0 100 0 100 PEAK Original Soil 1 5 7 10 6 0 20 40 60 80 100
0,001 0,010 0,100 1,000 10,000 100,000
Particle Size (mm)
Pe
rc
en
t Pas
si
ng Original Soil
1 3 7 9 Original Soil 1 3 5 9 14 01
03 05 09
14 Original Soil % Sand % Clay % Silt 0 100 0 100 0 100 PEAK 0 20 40 60 80 100
0,001 0,010 0,100 1,000 10,000 100,000
Particle Size (mm)
Pe rc en t Pas si ng 0 20 40 60 80 100
0,001 0,010 0,100 1,000 10,000 100,000
Particle Size (mm)
Pe rc en t Pas si ng 0 20 40 60 80 100
0,001 0,010 0,100 1,000 10,000 100,000
Particle Size (mm)
Pe rc en t P as si ng 0 20 40 60 80 100
0,001 0,010 0,100 1,000 10,000 100,000
Particle Size (mm)
Pe rc en t P as si ng
01 05 06
07 10 Original Soil % Sand % Clay % Silt 0 100 0 100 0 100 PEAK Original Soil 1 5 7 10 6 0 20 40 60 80 100
0,001 0,010 0,100 1,000 10,000 100,000
Particle Size (mm)
Pe rc en t Pas si ng 0 20 40 60 80 100
0,001 0,010 0,100 1,000 10,000 100,000
Particle Size (mm)
Pe
rc
en
t Pas
si
ng Original Soil
1 3 7 9 Original Soil 1 3 5 9 14 01
03 05 09
14 Original Soil % Sand % Clay % Silt 0 100 0 100 0 100 PEAK Downstream Upstream Static
Fig. 10. Granulometric evolution of sediments for 14% soil flume slope and for 3 storms types: Left: Granulometric curves; and Right:
Trajectories in the USDA textural classification chart (triangle).
whereT is the average stream power for the runoff event
(W),Qiis the water discharge for a sampling time interval of 15 s (m3s−1),Lis the slope length (m), which is the length of the flume, s0 is the slope of the flume (–) andn is the number of sampling intervals (from the beginning to the end of the runoff hydrograph).
In these experiments we have very shallow overland flow depths and high sediment concentration. It should be noted that the transport capacity of very shallow overland flow is limited and, without raindrop impact, coarse sediments could hardly be transported with these flows (e.g., Moss and Green,
1983; Julien and Simons, 1985; Guy et al., 1987; Kinnell, 1988, 1990 and 1993; Parsons et al., 1998; Zhang et al., 1998). The depth of flow was rather uniform, since signif-icant rills did not appear on the eroding soil surface of the flume.
1008 J. L. M. P. de Lima et al.: Sediments transported by runoff generated by moving storms
Rising limb
Recession limb Peak Discharge Downstream Original Soil
Upstream Static Rising Limb
Peak Discharge Recession Limb 0
20 40 60 80 100
0,001 0,010 0,100 1,000 10,000 100,000
Particle Size (mm)
Pe
rc
en
t Pas
si
n
g
0 20 40 60 80 100
0,001 0,010 0,100 1,000 10,000 100,000
Particle Size (mm)
Pe
rc
en
t Pa
ss
in
g
0 20 40 60 80 100
0,001 0,010 0,100 1,000 10,000 100,000
Particle Size (mm)
P
er
ce
nt
P
assi
ng Downstream
Upstream Static
Time - s
Di
sc
ha
rg
e –
m
L/
s
2%
7%
14%
Figure 11
Fig. 11. Granulometric curves referring to as the rising limb and falling limb and the peak discharge of the runoff hydrographs by different
storm types and soil flume slopes ( 2%, 7% and 14%).
power and sediment transport is shown separately for three different slopes, showing approximately a straight line re-lationship. In this figure all the experimental data are pre-sented, including the three slopes and the three different storm types (for the sampling time interval of 15 s, which generates: 120 points for the downstream moving storms; 176 points for the upstream moving storms; and 130 points for the static storms). The differences between static and moving storms already mentioned are once more clearly no-ticeable.
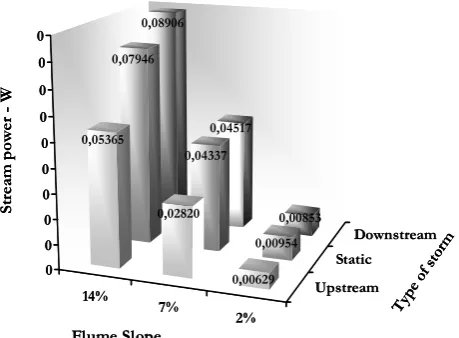
Figure 14 shows total stream power as a function of storm type and flume slope. Total stream power increases with flume slope and is higher for downstream-moving storms for a given slope. This is clearly the result of different rising times, peak discharges and base times affecting the sediment transport processes involved.
4 Conclusions
The following conclusions can be drawn from this study: 1. Comparing rainfall storms moving downstream and
up-stream, we find that the latter lead to runoff character-ized by hydrographs with: (1) earlier rise, (2) lower peak discharge, (3) less steep rising limb, and (4) greater base time. These conclusions were also reached theoret-ically and experimentally by several investigators (e.g., Singh, 1998; de Lima and Singh, 1999).
0 10 20 30 40 50 60
0,00 0,00 0,00 0,01 0,10 1,00
Sur
fa
ce R
uno
ff
-m
L/s
Transported Sediment - g/s
Downstream
Upstream
Static
SLOPE FLUME - 2%
0 10 20 30 40 50 60
0,00 0,00 0,01 0,10 1,00
Sur
fa
ce R
uno
ff
-m
L
/s
Transported Sediment - g/s
Downstream
Upstream
Static
SLOPE FLUME - 7%
0 10 20 30 40 50 60
0,00 0,00 0,00 0,01 0,10 1,00
Sur
fa
ce R
u
no
ff
-m
L
/
s
Transported Sediment - g/s
Downstream
Upstream
Static
SLOPE FLUME - 14%
Figure 12
Fig. 12. Relation between the surface runoff and transported
sedi-ments as a function of storm type and for the three different flume slopes (applied every 15 seconds and for the 4 repetitions): Top: 2%; Middle: 7%; and Bottom: 14%.
0,00 0,00 0,01 0,10
0,00 0,00 0,01 0,10 1,00
St
rea
m
P
ow
er
-W
Transported Sediment - g/s Downstream
Upstream
Static
SLOPE FLUME -2%
0,00 0,00 0,01 0,10
0,00 0,00 0,00 0,01 0,10 1,00
St
rea
m
P
ow
er
-W
Transported Sediment - g/s
Downstream
Upstream
Static
SLOPE FLUME -7%
0,00 0,01 0,10
0,00 0,00 0,00 0,01 0,10 1,00
St
rea
m
P
ow
er
-W
Sediment Transported - g/s
Downstream
Upstream
Static
SLOPE FLUME -14%
Figure 13
Fig. 13. Relation between the stream power and transported
1010 J. L. M. P. de Lima et al.: Sediments transported by runoff generated by moving storms
14%
7%
2%
Upstream Static
Downstream
0,08906
0,04517
0,00853 0,07946
0,04337
0,00954 0,05365
0,02820
0,00629
0 0 0 0 0 0 0 0 0 0
St
re
am
po
w
er
W
Flume Slope
Type of s
torm
14%
7%
2%
Upstream Static
Downstream
0,08906
0,04517
0,00853 0,07946
0,04337
0,00954 0,05365
0,02820
0,00629
0 0 0 0 0 0 0 0 0 0
St
re
am
po
w
er
W
Flume Slope
Type of s
torm
Figure 14
Fig. 14. Stream power as a function of storm type and flume slope.
the hydrograph. The downstream-moving storm with greater initial flow does not evolve in the same way. At first it exhibits a granulometry almost as coarse as the original soil, which then progressively decreases to finer grained sizes.
3. For both the types and flume gradients, the part of the runoff hydrographs that provokes greater soil erosion is the rising limb, as was borne out by the high percent-age of coarse material, signifying that the granulometric curve relating to this limb is close to that of the original soil.
4. The downstream-moving rainfall storms have more en-ergy associated with runoff (higher stream power) than do other storm types. Therefore, they are better able to drag coarse particles along, and have the most erosive impact on soil.
5. Stream Power increases with flume gradient; hence a greater percentage of coarse material is carried away. As already reported by other authors, it can be con-cluded that surface gradient influences solid transport. Acknowledgements. This study was financed under research project POCI/AMB/58429/2004, by the Foundation for Science and Technology (FCT) of the Ministry of Science and Technology (MCT), approved under the Operational Programme (POCI) of Community Support Framework III (2000–2006) and was carried out in the Hydraulics, Water Resources and Environ-ment Laboratory of the DepartEnviron-ment of Civil Engineering in the University of Coimbra’s Faculty of Sciences and Technology (FCTUC). Some of the experiments reported in this study were carried out with the help of: Jo˜ao Carloto M. Sc., holder of an FCT scholarship; Mr. Joaquim, employee of the Hydraulics Laboratory; Mrs. Manuela of the Laboratory of Sedimentology, and Professors Manuel Azevedo, Pedro de Dinis and Pedro Cunha of the Department of Earth Sciences of the University of Coimbra. The comments of the reviewers helped to improve significantly the paper.
Edited by: W. Krajewski
Reviewed by: M. Elhakeem and another anonymous referee
References
Bagnold R. A.: An approach to the sediment transport problem from general physics, US Geological Survey Professional Paper, 422–1, 11–137, 1966.
Bras, R. and Rodrigues-Iturbe, I.: Rainfall generation: a nonstation-ary time-vnonstation-arying multidimensional model, Water Resour. Res., 12(3), 450–454, 1976.
Bryan, R. B. and Poesen, J.: Laboratory experiments on the influ-ence of slope length on runoff, percolation and rill development, Earth Surf. Processes, 14, 211–231, 1989.
Eagleson, P. S.: Climate, soil and vegetation: The distribution of annual rainfall derived from observed storm sequences, Water Resour. Res., 14(5), 713–721, 1978.
Erpul, G., Gabriels, D., and Janssens, D.: Assessing the drop size distribution of simulated rainfall in a wind tunnel, Soil and Tillage Research 45, 455–463, 1998.
Erpul, G., Gabriels, D., and Janssens, D.: The effect of wind on size and energy of small simulated raindrops: a wind tunnel study, International Agrophysics, 14, 1–7, 2000.
Erpul, G., Norton, L. D., and Gabriels, D.: The Effect of Wind on Raindrop Impact and Rainsplash Detachment, Transactions of American Society of Agricultural Engineering, 45(6), 51–62, 2003a.
Erpul, G., Norton, L. D., and Gabriels, D.: Sediment transport from interrill areas under wind-driven rain, J. Hydrol., 276, 184–197, 2003b.
Erpul, G., Gabriels, D., and Norton L. D.: Wind effects on sed-iment transport by raindrop-impacted shallow flow, Earth Surf. Processes, 29, 955–967, 2004.
Erpul, G., Gabriels, D., and Norton, L. D.: Sand Detachment by Wind-driven Raindrops, Earth Surf. Processes, 30, 241–250, 2005.
Erpul, G., Gabriels, D., Cornelis, W. M., Samray, H. N., and Guzelordu, T.: Sand detachment under the rains with varying angle of incidence, Catena, 72, 413–422, 2008.
Fitzgerald, E. and Bowden, B.: Quantifying increases in stream power and energy – Using flow duration curves to depict stream-flow values, Stormwater, 7(2), 88–94, 2006.
Gabriels, D., Cornelis, W., Pollet, I., Van Coillie, T., and Quessar, M.: The ICE wind tunnel for wind and water erosion studies, Soil Technol., 10, 1–8, 1997.
Guy, B. T., Dickinson W. T., and Rudra R. P.: The roles of rainfall and runoff in the sediment transport capacity of interrill flow, Transactions of the ASAE, 30(5), 1378–1386, 1987.
Huff, F. A.: Time distribution of rainfall in heavy storms, Water Resour. Res., 3(4), 1007–1019, 1967.
Julien, P. Y. and Simons D. B.: Sediment transport capacity of over-land flow, Transactions of the ASAE, 28, 755–762, 1985. Kinnell, P. I. A.: The influence of flow discharge on sediment
con-centrations in raindrop induced flow transport, Aust. J. Soil Res., 26, 575–582, 1988.
Kinnell, P. I. A.: Interrill erodibilities based on the rainfall intensity-flow discharge erosivity factor, Aust. J. Soil Res., 31, 319–332, 1993.
de Lima, J. L. M. P. and Singh, V. P.: Laboratory experiments on the influence of storm movement on overland flow, Journal Physics and Chemistry of the Earth, 28(6–7), 277–282, 2003.
de Lima, J. L. M. P. and Singh, V. P.: The influence of the pattern of moving rainstorms on overland flow, Adv. Water Resour., 25(7), 817–828, 2002.
de Lima, J. L. M. P., Singh, V. P., and de Lima, M. I. P.: The influ-ence of storm movement on water erosion: Storm direction and velocity effects, Catena, 52, 39–56, 2003.
de Lima, J. L. M. P. and Singh, V. P.: The influence of storm move-ment on overland flow – Laboratory experimove-ments under simu-lated rainfall, in: Hydrologic Modeling, Water Resources Pub-lications, edited by: Singh II, V. P., Won Seo, and Sonu, J. H., 101–111, 1999.
Esteves, M., Planchon, O., Lapetite, J. M., Silvera, N., and Cadet, P.: The “EMIRE” large rainfall simulator: design and field test-ing”, Earth Surface Process, 25(7), 681–690, 2000.
Maksimov, V. A.: Computing runoff produced by a heavy rainstorm with a moving center, Sov. Hydrol., 5, 510-513, 1964.
Meyer, L. D.: How rainfall intensity affects interrill erosion, Trans-actions of the American Society of Agricultural Engineer, 24(6), 1472–1475, 1981.
Morgan, R. P. C.: Soil Erosion and Conservation. London, Long-man (second edition), 1995.
Moss, A. J. and Green, P.: Movement of solids in air and water by raindrop impact. Effects of drop-size and water-depth variations, Aust. J. Soil Res., 21(3), 373–382, 1983.
Parsons, A. J., Stromberg, S. G. L., and Greener, M.: Sediment-transport competence of rain-impacted interrill overland flow, Earth Surf. Proc. Land., 23, 365–375, 1998.
R¨omkens, M. J. M., Prasad, S. N., and Gerits, J. J. P.: Soil erosion modes of sealing soils: a phenomenological study, Soil Technol., 11, 31–41, 1997.
Rose, C. W.: An introduction to the environmental physics of soil, water and watersheds, Cambridge University Press, Cambridge, 2004.
Sharon, D.: The distribution of hydrologically effective rainfall in-cident on sloping ground, J. Hydrol., 46, 165–188, 1980. Singh, V. P.: Effect of the direction of storm movement on planar
flow, Hydrol. Process., 12, 147–170, 1998.
Sivapalan, M. and Wood, E. F.: A multidimensional model of non-stationary space-time rainfall at the catchment scale, Water Re-sour. Res., 22(7), 1289–1299,1986.
Willems, P.: A spatial rainfall generator for small spatial scales, J. Hydrol., 252, 126–144, 2001.
Wilson, C. B., Valdes, J. B., and Rodrigues-Iturbe, I.: On the influ-ence of the spatial distribution of rainfall on storm runoff, Water Resour. Res., 15(2), 321–328, 1979.
Worthy, M.: High-resolution total stream power estimates for the Cotter River, Namadgi National Park, Australian Capital Terri-tory, in: Regolith 2005 – Ten Years of CRC LEME. CRC LEME, edited by: Roach, I. C., 338–343, 2005.
Yen, B. C. and Chow, V. T.: A study of surface runoff due to moving rainstorms, Hydraulic Engineering Series No. 17, Department of Civil Engineering, University of Illinois, Urbana, (USA), 1968. Zhang, X. C., Nearing, M. A., Miller, W. P., Norton, L. D., and