Solid Earth, 4, 93–104, 2013 www.solid-earth.net/4/93/2013/ doi:10.5194/se-4-93-2013
© Author(s) 2013. CC Attribution 3.0 License.
EGU Journal Logos (RGB)
Advances in
Geosciences
Open Access
Natural Hazards
and Earth System
Sciences
Open AccessAnnales
Geophysicae
Open AccessNonlinear Processes
in Geophysics
Open AccessAtmospheric
Chemistry
and Physics
Open AccessAtmospheric
Chemistry
and Physics
Open Access DiscussionsAtmospheric
Measurement
Techniques
Open AccessAtmospheric
Measurement
Techniques
Open Access DiscussionsBiogeosciences
Open Access Open Access
Biogeosciences
Discussions
Climate
of the Past
Open Access Open Access
Climate
of the Past
Discussions
Earth System
Dynamics
Open Access Open Access
Earth System
Dynamics
DiscussionsGeoscientific
Instrumentation
Methods and
Data Systems
Open Access
Geoscientific
Instrumentation
Methods and
Data Systems
Open Access DiscussionsGeoscientific
Model Development
Open Access Open Access
Geoscientific
Model Development
DiscussionsHydrology and
Earth System
Sciences
Open AccessHydrology and
Earth System
Sciences
Open Access DiscussionsOcean Science
Open Access Open Access
Ocean Science
Discussions
Solid Earth
Open Access Open Access
Solid Earth
DiscussionsThe Cryosphere
Open Access Open Access
The Cryosphere
DiscussionsNatural Hazards
and Earth System
Sciences
Open Access
Discussions
Seismic imaging of sandbox experiments – laboratory hardware
setup and first reflection seismic sections
C. M. Krawczyk1,*, M.-L. Buddensiek2,*, O. Oncken3, and N. Kukowski4,*
1Leibniz Institute for Applied Geophysics (LIAG), Stilleweg 2, 30655 Hannover, Germany 2SINTEF Petroleum Research, S.P.Andersens Veg 15, 7031 Trondheim, Norway
3Helmholtz Centre Potsdam, GFZ German Research Centre for Geosciences, Telegrafenberg, 14473 Potsdam, Germany 4Friedrich Schiller University, Institute for Geosciences, Burgweg 11, 07749 Jena, Germany
*formerly at: Helmholtz Centre Potsdam, GFZ German Research Centre for Geosciences, Germany
Correspondence to: C. M. Krawczyk ([email protected])
Received: 2 August 2012 – Published in Solid Earth Discuss.: 10 October 2012 Revised: 22 January 2013 – Accepted: 23 January 2013 – Published: 15 February 2013
Abstract. With the study and technical development intro-duced here, we combine analogue sandbox simulation tech-niques with seismic physical modelling of sandbox models. For that purpose, we designed and developed a new mini-seismic facility for laboratory use, comprising a mini-seismic tank, a PC-driven control unit, a positioning system, and piezo-electric transducers used here for the first time in an ar-ray mode. To assess the possibilities and limits of seismic imaging of small-scale structures in sandbox models, dif-ferent geometry setups were tested in the first 2-D experi-ments that also tested the proper functioning of the device and studied the seismo-elastic properties of the granular me-dia used. Simple two-layer models of different materials and layer thicknesses as well as a more complex model com-prising channels and shear zones were tested using differ-ent acquisition geometries and signal properties. We sug-gest using well sorted and well rounded grains with little surface roughness (glass beads). Source receiver-offsets less than 14 cm for imaging structures as small as 2.0–1.5 mm size have proven feasible. This is the best compromise be-tween wide beam and high energy output, and is applicable with a consistent waveform. Resolution of the interfaces of layers of granular materials depends on the interface prepa-ration rather than on the material itself. Flat grading of in-terfaces and powder coverage yields the clearest interface re-flections. Finally, sandbox seismic sections provide images of high quality showing constant thickness layers as well as predefined channel structures and indications of the fault traces from shear zones. Since these were artificially
intro-duced in our test models, they can be regarded as zones of disturbance rather than tectonic shear zones characterized by decompaction. The multiple-offset surveying introduced here, improves the quality with respect to S / N ratio and source signature even more; the maximum depth penetration in glass-bead layers thereby amounts to 5 cm. Thus, the pre-sented mini-seismic device is already able to resolve struc-tures within simple models of saturated porous media, so that multiple-offset seismic imaging of shallow sandbox models, that are structurally evolving, is generally feasible.
1 Introduction
There is a growing need to measure active processes act-ing in the Earth’s crust and their influence on the surface for both pure and applied research. Additionally, the rapidly evolving geodetic, geophysical and geological observation techniques increase the challenge to integrate all those tech-niques. Thus, to account for this development, seismic imag-ing and monitorimag-ing techniques have to be integrated, notably involving surface observations, e.g. from satellites, in order to understand active deformation of structures relevant in the crust. This problem has not been fully or systematically ap-proached, since material and logistic expenses are high with respect to field experiments.
et al., 2003; Gartrell et al., 2005; Hoth et al., 2007, 2008; Boutelier and Oncken, 2011). Sandbox experiments offer unique insights into geodynamic processes, as they allow direct observation of processes, e.g. orogenic wedge evolu-tion, fault activity, or lithospheric scale deformaevolu-tion, which are taking place at inaccessible depths and times (cf. also re-view of Graveleau et al., 2012). Most of the analogue mate-rials representing upper crustal rocks and sediments, like the widely used quartz sand, corundum sand, mortar, or sugar, are opaque. Thus, direct observation of deformation is only possible at the surface of 3-D models or through bordering glass planes of 2-D models. Although recently new monitor-ing techniques like X-ray computer tomography (Coletta et al., 1991; Schreurs et al., 2003), particle image velocimetry (PIV, e.g. Baldassarre et al., 2001; Wolf et al., 2003; Ham-pel et al., 2004; Adam et al., 2005; Rosenau et al., 2009; Reiter et al., 2011), or laser scanning (e.g. Persson et al., 2004; Graveleau and Dominguez, 2008) have led to signif-icant improvements in analysing and transfering sandbox ex-periments, the challenge to monitor 3-D evolution of struc-tures within opaque bodies remains. To overcome this defi-ciency, we suggest seismic imaging of sandbox models can provide a promising tool.
Sherlock (1999) and Sherlock and Evans (2001) showed that seismic imaging of structures in granular models is fea-sible. Because their seismic modelling of granular material is based on zero-offset data, the experiments suffered from high attenuation and especially scattering. Bodet et al. (2010) implemented a monitoring tool based on laser-Doppler vi-brometry to systematically characterise granular material in analogue models. They analyzed P-wave first arrival times and surface-wave dispersion regarding the velocity struc-ture. Their results correlate well with dispersion relations for acoustic waves of Jacob et al. (2008) who used a mechan-ical source for the experiment. However, these attempts do not provide structural images but were restricted to provid-ing good estimates of elastic material properties. This can be, in part, overcome by the laser interferometry setup provided by Bretaudeau et al. (2011) who additionally applied finite element viscoelastic modelling to confirm arrival times and amplitudes of experiments in thermoplastic and resin-based models.
We chose to develop an experimental observation system based on the reflection seismic technique, and specifically the use of an array of receivers and the application of reflection processing to minimize noise (Krawczyk et al., 2007; Bud-densiek, 2009). Since the small dilation between sand grains generated by shearing causes reflections, geologic models containing 2 to 3 layers of different densities and a few shear-ing structures are suitable for imagshear-ing. The requirements and sequential aims of such an experimental study encom-pass (1) a systematic approach to test the material prop-erties and the effects of wave propagation in isotropic and anisotropic media by physical studies (see Buddensiek et al., 2009); (2) various 2-D imaging and processing techniques to
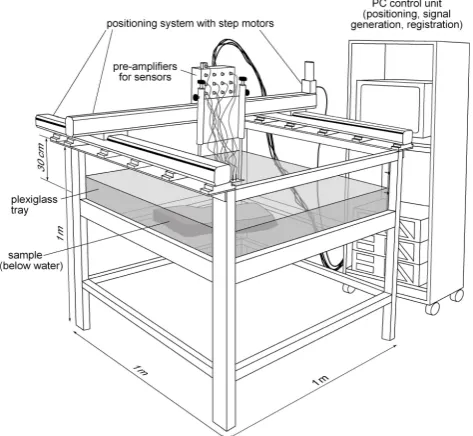
Fig. 1. Experimental device and setup of the mini-seismic system in the laboratory. The system consists of a seismic tank, a PC-driven control unit, a positioning system, and piezoelectric transducers (for technical details see also Table 1 and Figs. 2 and 3).
be tested first on static models, in order to reproduce scaled active seismic experiments (this study); and, finally, (3) time-lapse imaging of deforming 3-D structural models.
The main advantage of the application of a mini-seismic system is its non-invasiveness as opposed to the conventional method of slicing the analogue sandbox model, so that time-lapse monitoring can be applied. Even though X-ray comput-erized tomography (CT) analysis also allows the visualiza-tion of the interior of an analogue model without destroying it (Colletta et al., 1991; Schreurs et al., 2003), it still requires the analysis of distinct scenes of an evolving model sequence (see Holland et al., 2011). Here, we introduce the new labora-tory facility and its technical specifications, and also discuss the tested geometry and material variations based on the first data generation produced by multiple-offset surveying.
2 Experimental setup and equipment development
The characteristics of the four major components of the mini-seismic system – mini-seismic tank, control unit, positioning sys-tem, transducers – are summarised below. Technical specifi-cations are given in Table 1, while Figs. 1 to 3 illustrate the new device and its components.
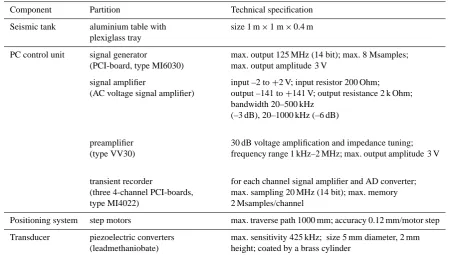
Table 1. Components and technical specifications of the laboratory seismic device.
Component Partition Technical specification
Seismic tank aluminium table with plexiglass tray
size 1 m×1 m×0.4 m
PC control unit signal generator
(PCI-board, type MI6030)
max. output 125 MHz (14 bit); max. 8 Msamples; max. output amplitude 3 V
signal amplifier
(AC voltage signal amplifier)
input –2 to+2 V; input resistor 200 Ohm; output –141 to+141 V; output resistance 2 k Ohm; bandwidth 20–500 kHz
(–3 dB), 20–1000 kHz (–6 dB)
preamplifier (type VV30)
30 dB voltage amplification and impedance tuning; frequency range 1 kHz–2 MHz; max. output amplitude 3 V
transient recorder
(three 4-channel PCI-boards, type MI4022)
for each channel signal amplifier and AD converter; max. sampling 20 MHz (14 bit); max. memory 2 Msamples/channel
Positioning system step motors max. traverse path 1000 mm; accuracy 0.12 mm/motor step
Transducer piezoelectric converters (leadmethaniobate)
max. sensitivity 425 kHz; size 5 mm diameter, 2 mm height; coated by a brass cylinder
i.e. friction and cohesion. Thereby, typical crustal materials and kinematic domains are simulated properly. Since 1 cm in the model scales to 1 km in nature, we want to test acquisi-tion geometries in the lab on a tectonic scale first. Thus, our geometry simulates tectonic settings of up to 14 km horizon-tal distance, where fault segments of a 150–200 m width are present. This translates to 140 mm offset and mm-width of structures to be investigated by the mini-seismic device.
2.1 The seismic tank
The largest component of the laboratory seismic device is a plexiglass tank of 1 m×1 m×0.4 m dimension (Fig. 1), in which the experiments are conducted. The plexiglass tank is filled with layers of saturated sand resembling geological structures in question on a cm-scale following the needs of physically and geometrically correct scaling (e.g. Hubbert, 1937; Krantz, 1991; Lohrmann et al., 2003). For good cou-pling, the tank is filled with water after the model has been sieved in and saturated. Saturation time of three to four days was found to be well suited. The sample should be positioned in the centre of the tank to avoid strong side effects during data acquisition.
2.2 PC system with control unit
An industry PC (type IPC-9401) contains the signal genera-tor including a signal amplifier and a transient recorder with preamplifier. The PC also drives the step motors for the posi-tioning of the source and receivers (Fig. 2).
Fig. 2. Schematic illustration of the functions performed by the PC control unit for communication with the positioning system and the transducers.
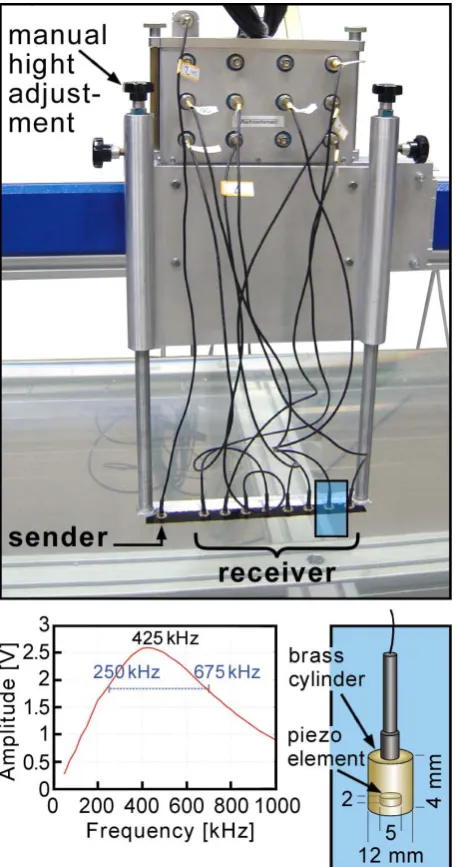
Fig. 3. Transducer array (top) and technical characteristics of the piezoelectric elements used (bottom).
2.3 Positioning system
Two step motors move the sensors along the horizontal axes (Fig. 1). They can move any given source and receiver ge-ometry horizontally within the tank, so that seismic profiles can be recorded at any position over the model, resembling scaled 2-D marine survey geometries.
The maximum traverse path is 1 m depending on sensor configuration. With an accuracy of 0.12 mm/motor step, it is possible to move an array, to any defined position, with sufficient precision (Table 1).
2.4 Transducers
Piezoelectric transducers that are lowered into the tank are used as ultrasound source and receivers (Fig. 3). They can be assembled with a rack design of any geometry. So far, twelve receivers and one emitter (custom-made product) with piezoelectric converters are in use.
Coated by a damped brass cylinder of 12 mm diameter and 20 mm height, the leadmethaniobate piezoelectric ele-ment contained is 2 mm high and 5 mm in diameter. It is glued to a thin brass plate, so that internal reflections are negligible. The performance of the piezoelectric transducers has been extensively tested (see Buddensiek et al., 2009), showing maximum sensitivity at 425 kHz with half-power bandwidth between 250–675 kHz (see Fig. 3, Table 1). Af-ter analysing effective diameAf-ter of the transducers, direction-ality, changes in waveform, and frequency sensitivity, Bud-densiek et al. (2009) recommend to use signal frequencies of 350 to 550 kHz, with incidence angles below 35°and source receiver-offsets less than 14 cm in order to exploit the piezo-electric transducers in an optimal way, even though this de-fines a smaller maximum source–receiver offset than mod-ern marine multichannel seismic surveys would require for direct comparison (e.g. Long, 2010). The experimental setup here finally allows the imaging of structures as small as 2.0– 1.5 mm size.
3 Test experiments
The maximum source frequency of 1 MHz allows for a very high resolution in the mm range, depending on the velocity of the material. However, if the resolution is close to the grain size, the grains cause scattering effects and attenuation, so that the S / N ratio is impaired. With one source and 12 simul-taneously recording receivers we have, therefore, performed test and calibration experiments to decide about model prepa-ration and to work out sufficient imaging quality. The acqui-sition geometry is based on 18 to 150 mm shot–receiver spac-ing, 12 mm receiver spacspac-ing, 3 mm shot spacing and 100 mm water depth. This design is adapted to resolve faults and other structures of a few mm width, as they are to be expected in sandbox models. The source specifications and processing parameters varied and are given accordingly in the following subchapters.
3.1 Principle geometries
periods tapered by a squared cosine, 16-fold vertical stack-ing, and a sampling rate of 20 MHz were applied.
A first experiment series acquired data across a flat ly-ing, 4.5 cm thick concrete body embedded in sand (Fig. 4a, b). Here, the source frequency varied systematically between 100 kHz and 1 MHz. The results show that resolution and at-tenuation are much higher using a 1 MHz source frequency than is observed in the 175 kHz experiment. Sufficient en-ergy passes through the sand to be reflected at the bottom of the seismic tank, whereas no bottom reflection can be seen underneath the concrete–water interface due to the higher at-tenuation for high frequencies (Fig. 4a, b).
The next experiments acquired data across a wedge-shaped body, consisting of either concrete in sand (Fig. 4c) or a layer of glass–bead beneath a sand wedge (Fig. 4d). For both experiments the source frequency was 700 kHz. Re-flections from the top of the concrete can be seen for up to 4.5 cm of sand layer thickness, when attenuation becomes too high for the high-frequency P-waves (Fig. 4c). For the glass-bead setup, the resulting seismogram shows significant noise due to scattering, so that no clear reflection of the sand– glass-bead interface is visible. However, the glass bead layer contains less scattering noise than the sand layer due to the longer wavelength of the P-wave signal. Despite this, the ar-tificially introduced shear zone in the top third of the wedge can be more clearly resolved (Fig. 4d).
Additionally, first parameter tests show that models with sand grains <0.4 mm and a source frequency of 250 kHz produce reasonably high data quality. Furthermore, reflec-tions of an interface between uncompacted sand with grain size <0.6 mm and denser, compacted sand (grain size
<0.4 mm) can be picked in the seismic sections using a source frequency of 350 kHz.
3.2 Interface preparation
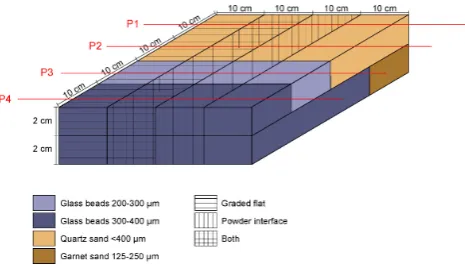
We performed a second series of experiments in order to determine which model setup could create the strongest interface reflections. The interface model is a two-layer model that consists of four different granular materials, com-bined with four different procedures of interface prepara-tion, so that 16 fields of interface variations can be analysed (Fig. 5). Layer thickness is constant at 2 cm, and the fields are 10 cm×10 cm in size. Interface preparation either con-sisted of flat grading by soft stamping, of sprinkling with glass powder (40 to 70 µm diameter), of applying both, or none of them (for more detail see Buddensiek, 2009). Four profile locations cover the four different material interfaces, while the preparation types are surveyed inline (Fig. 5).
After a saturation time of three days, the seismic profiles were surveyed. For all sections presented here, a sinusoid source wavelet of four periods tapered by a squared cosine, 16-fold vertical stacking, and a sampling rate of 20 MHz have been applied. For seismic processing we only used the 450 kHz source frequency shots recorded at 18 mm
off-Fig. 5. Setup of the interface model to test seismic imaging prop-erties of selected granular materials and of differently prepared in-terfaces. The lines labelled P1–P4 mark the locations of the seismic sections shown in Fig. 6.
set, the nearest shot–receiver distance. Due to data acquisi-tion very near to the model surface, only this trace provided enough sensitivity and a clear signal. Therefore, processing was kept simple by filtering only with an automatic gain con-trol (AGC) of 0.04 µs window size.
From top to bottom, Fig. 6 reveals very different imaging results in the 16 fields of analysis (cf. Fig. 5). In all profiles both the surface of the model as well as the plexiglass bottom are easily identified as model boundaries. The ringing below the plexiglass reflections is dominant in profiles P1 and P2, while attenuation and scattering are higher in profiles P3 and P4 (Fig. 6). This directly relates with the material proper-ties of either glass beads or sand, and with very high internal noise encountered in quartz and garnet sand, thereby ham-pering almost any reflection identification on profiles P3 and P4. Even the plexiglass bottom almost vanishes against the strongly pronounced multiple.
Fig. 6. Reflection seismic sections across the interface model lo-cated at lines P1–P4 given in Fig. 5. The interface is best imaged when it is prepared by grading and powder as well as between well-rounded and well-sorted glass beads (P1, P2).
In summary, the interface model experiment series sug-gests that grading flat plus powdering is the best suited pro-cedure for interface preparation, which seems to be more im-portant for good imaging than the material itself. Further-more, the use of well-rounded and well-sorted material (glass beads) is recommended. Three days of saturation time should be sufficient in most cases.
4 Reflection seismic imaging
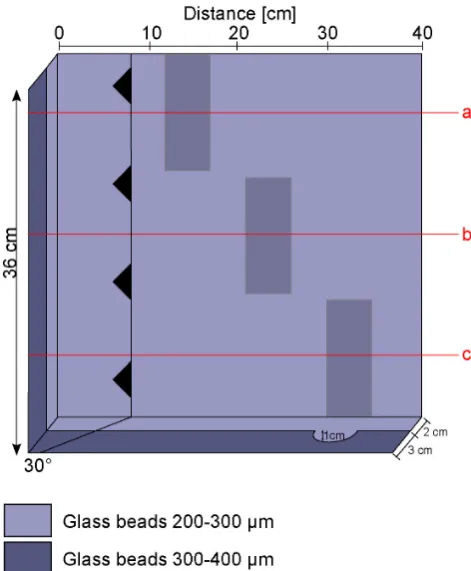
This advanced experiment series finally aimed at imaging different structural features by reflection seismic profiling across a 3-D model. The channel model has two layers of glass beads of different size, with their interface being pre-pared by flattening and powdering (Fig. 7). This procedure and the material used were chosen accordingly to the results gained from the second experiment series (see above). The channel model is 5 cm thick. It contains three distributed, 1 cm deep channels, and a 30° dipping shear band created by pulling a string through the model after saturation of three
Fig. 7. Setup of the channel model consisting of two glass-bead layers. While a shear zone of 30◦dip angle is prepared close to the left side of the analogue model, a channel structure is distributed over three positions in the model. Lines a–c mark locations of the seismic sections shown in Fig. 9.
days (cf. Buddensiek, 2009 for experimental details). The re-sulting dilation and decompaction may be considered equiv-alent to that known to occur in natural fault zones and their process zone. Three seismic profiles were shot across the dif-ferent channel locations and the shear zone (Fig. 7).
The acquisition geometry with 12 receivers was kept to 18–150 mm shot–receiver spacing, 3 mm shot spacing and 100 mm water depth. The source frequency was varied from 300 to 650 kHz, with 50 kHz intervals for individual fre-quency stacks of 256 vertical fold. For signal recording a sampling interval of 0.05 µs was chosen. The reflection seismic processing sequence comprised frequency stacking, spherical gain application, bandpass filtering (75, 125, 750, 800 kHz), normal move-out (NMO) correction (1485 m s−1 constant velocity), stacking and time migration (t-k domain). While the raw shot data have a limited vertical resolution be-tween 1.2–1.7 µs (Fig. 8a), the frequency stacking improves the resolution during processing so that the interface reflector can be clearly identified (Fig. 8b).
Fig. 8. Shot gathers of the channel model from the 450 kHz recording, (a) after spherical gain, and (b) after frequency stack followed by spherical gain. Here, the interface reflection at ca. 1.35 µs is much better resolved (see arrows).
occur at the surface outcrop of the shear band, thereby blur-ring the layer below (e.g. Fig. 9, left, profile a: 8–12 cm dis-tance, 0.12–0.14 µs). As one would expect, largest diffrac-tions are encountered from the flanks of the channel structure (e.g. Fig. 9, left, profile b: 25–30 cm distance, 0.15 µs), but also a number of small amplitude diffractions were generated at the layer interface (Fig. 9 left, all profiles: below 0.15 µs). Thus, the lower layer of the model appears noisier than the upper one. The model surface runs continuously across the sections, while the plexiglass bottom reveals a different am-plitude behaviour in spite of a continuous reflection. It has a strong reflection where the interface is weak, and vice versa. With respect to the quality of the source wavelet, espe-cially the ringing that is still contained in the data and the duration of the source wavelet must be considered. These two aspects arose from the technical limitations. Firstly, the en-tire surface of source and receiver contributes to the recorded waveform, so it is not equal to the digitally produced wave-form. Secondly, the piezo-crystal has a tendency to ring after excitation, in particular in its eigenfrequency of 110 kHz and multiples. To dampen this ringing as much as possible, the sensor cylinders are filled with a damping material. The re-maining ringing cannot be reduced without decreasing the output energy and thus penetration depth. Internal interac-tions between the crystal, the damping, the cylinder walls, the brass bottom, and the glue are considered negligible because of their small size compared to the wavelength (cf., Budden-siek et al., 2009). To improve the signal as much as possi-ble (large amplitude, less ringing, relatively wide frequency spectrum), we tested a number of source wavelet shapes,
fre-quencies, and frequency stacks. We found that the preferred source frequency of 250–675 kHz generates a signal such that over an offset (source to reflection point, not receiver) of 120 mm only the first two phases interfere constructively, so NMO-stacking reduces the ringing to some degree. In the zero-offset profiles, the ringing is not reduced at all (cf., dis-cussion in Buddensiek, 2009).The migrated sections disclose the advantage of the multifold acquisition after NMO stack-ing. The diffractions described above are collapsed and the channel geometries are well defined (Fig. 9 right, all profiles: below 0.14 µs). Even the footprint of the shear band on the in-terfaces is much better revealed from the surface down to at least the interface (Fig. 9 right, all profiles: 0.12 to 0.14 µs). The shear zone images by the interuption of the very strong bounding reflectors in the upper part. This effect is compa-rable to observations in the field across different scales (e.g. Krawczyk et al., 2002, 2006 and references therein). In ad-dition, the shear zone can be further traced as smeared type of reflection zone down to the interface (best pronounced in Fig. 9b, right panel). Between the interface and the plexiglass bottom, however, the shear zone signal diminishes. This may be caused by the lower impedance contrast across the shear band if compared to the energy reflected at the layer inter-face.
Fig. 9. Constant-offset gathers (COG; left) and time-migrated sections (MIG, right) image the channel model at three different profile positions across the analogue model (cf. Fig. 7, profiles a–c; vertical exaggeration is ca. 6). The distance between shear zones and channel structures varies, but in all sections these can be clearly imaged separately. The subtle traces of the shear zone are indicated by red arrows.
1485 m s−1 in the water column, the depth between trans-ducers and model surface amounts to 9 cm, which is exactly the geometry used. The thickness of the upper model layer is 2 cm plus 1 cm where a channel is met. Assuming a veloc-ity of 1600 m s−1, the two-way travel times of 0.024 µs and 0.012 µs fit very well. Inconsistencies in the thickness of the bottom layer may reach a few mm, if both model layers have the same velocity, which may be caused by imprecise sieving
during model preparation or by incomplete velocities during migration.
5 Discussion
The seismic sections of the interface model (Fig. 6) and channel model (Fig. 9) clearly showed that seismic surveys across glass-bead models are more likely to produce clear reflections of interfaces, if these are carefully prepared and an array-technique is applied. The downside of models con-taining interfaces is that a substantial part of the energy is reflected. Thus, the energy output of our source achieves a penetration depth of approximately 5 cm, which could not be improved by additional vertical stacking. None of the exper-iments was able to image an interface within sand. Since, in nature, most structural geologic information is achieved by imaging interfaces, and faults are usually inferred from hori-zon offsets, future experimental setups and experiments will have to focus on the interface preparation aspect for com-parability with geometries observed in nature. Moreover, the current restriction in depth penetration will require the devel-opment of stronger sources while maintaining the frequency spectrum. Because of the required resolution of 1 to 3 mm, the source frequency cannot be lowered to achieve a higher penetration. However, if it is desired to perform multiple-offset processing, the source should, at the same time, emit a broad beam in the same frequency range.
Scaling the laboratory experiments to field surveying, modern marine seismic surveys would imply the use of wider incidence angles for larger source-receiver offsets (see sect. 2.4) as well as modified acquisition geometries. Here, we introduced acquisition parameters adapted to the techni-cal facilities available at the time. Because of the narrow an-gle reception, we chose relatively high water depths to ensure that any reflection would be received at the furthest offset. For future experiments, the receiver spacing should be re-duced, the shot–receiver spacing should start at lower values to account for small offsets, and the shot spacing could be denser. Nonetheless, the major aim of our study, proving the feasibility of such kind of laboratory seismics for sandbox experiments, is met here.
In the migrated seismic sections (Fig. 9), the artificially in-troduced shear zone is not imaged as a reflector itself but can be seen in a very small offset at the interfaces (like in field surveys). This shear band can be traced well down to 2.5 cm depth within sand, while the seismic expression of the shear band in glass beads is much smaller (Fig. 9, marked by ar-rows). The difference between both sections lies mostly in the material. Sand has a rougher surface, i.e. higher friction. Therefore, the grains are prone to stay in their displaced po-sition after the string was pulled through. The smooth glass beads are more likely to fall back into place, so that the de-compaction is not a permanent expression. In this case, not even less attenuation or a stronger source would enable us to resolve the shear zone. Nevertheless, considering the test ex-periments imaging artificially induced shear zones as zones of disturbance here, seismic imaging is expected to locate more clearly zones of decompaction, and thus tectonic shear
zones, within models that have undergone deformation. Ring shear testing of granular materials undergoing deformation first observe compaction before localized decompaction oc-curs along the zone of failure (Lohrmann et al., 2003). There-fore, the density contrast of shear zones versus undeformed material is even higher, and should be resolved even better in actively deforming models than in this simple simulation. If interfaces are present, the faults and their offset can be seis-mically imaged in glass-bead models down to 2 cm. If addi-tional interfaces are present below the depth resolution for faults, the faults and their offset can be inferred from horizon offsets. In sand models, only the faults are well-resolved, but not the interfaces that are needed to infer an associated offset. The seismic sections of the interface model (Fig. 6) show that the image quality over the glass-bead profiles (P1 and P2) is much better than over the sand profiles (P3 and P4). A bigger 3-D model composed of sand would contain even more internal noise and attenuation. Since it is difficult to sat-urate sand models due to the rough surface of the grains, the imaging quality is variable from model to model and within one model. This result shows that sand, or any other granu-lar material with a rough surface, is not suitable for seismic imaging with the preparation and saturation method that we use.
The discussion of the grain surface texture indicates a con-flict of interest: A rough surface of the grains, i.e. higher fric-tion, (1) creates proper shear bands that can be resolved in the seismic data, but (2) inhibits the saturation, which causes attenuation and noise. To avoid this conflict, the saturation needs to be improved. We used hot water of ca. 50◦C to sat-urate, and waited for three days until the signal did not un-dergo further change. Further saturation can be achieved by a vacuum chamber, vibrations, a longer saturation time, and/or saturation with near boiling hot water. A vacuum chamber is not available for a setup of this size and vibration cannot be used, since it disturbs the packing, particularly at an inter-face. If the saturation time is supposed to take more than four days, we recommend using distilled water because of algae and other organic growth. In addition, the use of a low vis-cosity fluid with lower surface tension and wetting angle in contact to glass beads or sand may help to improve imaging quality.
6 Conclusions and outlook
We have designed and developed a new mini-seismic facility for laboratory use. It consists of a seismic tank, a PC control unit, a positioning system and includes piezoelectric trans-ducers. First experiments with this setup have shown that ul-trasonic seismic experiments are able to resolve structures within simple models of saturated porous media. The analy-sis of the seismic response as a function of layer thickness, material density contrast, and source frequency supports the design of future sandbox models to resolve specific structures systematically. Here, we suggest to use sorted and well-rounded grains with little surface roughness (glass beads), and to prepare the interfaces by grading and powdering to achieve a good imaging quality.
The acquisition and processing scheme that takes advan-tage of the redundant information provided by an array of re-ceivers has proven successful here for more geological mod-els. With the array-technique of piezoelectric transducers in-troduced here, we found the best compromise between wide beam and high energy output, the technique being applicable up to 14 cm offset with a consistent waveform. This enables imaging of structures as small as 2.0–1.5 mm size.
Seismic reflection imaging of different saturated analogue models detects layering and shear bands. Fault images can be resolved also in glass-bead layering with increasing ampli-tude to larger depth. The multiple-offset surveying improves the data quality with respect to the S / N ratio and allows for further processing steps, such that a depth penetration in glass-bead layers of up to 5 cm is reached.
With respect to model and hardware setup, further devel-opments should encompass the improvement of model sat-uration, the use of viscous material to simulate mantle ma-terial or salt domes, and the design of smaller sources with higher energy output and perfect signal control. Especially for more complex models, the image clarity and penetration depth need to be improved (setup of thin layer models) to study actively evolving models with this method. In the fu-ture, differences in wave propagation between field experi-ments and our laboratory system must be investigated to be able to compare both data records. At this point, the advan-tage of laboratory studies, which is the a priori knowledge of media characteristics, was not considered yet and should be evaluated further, e.g. to calibrate interpretations.
Beyond these specifically seismic techniques, the incor-poration of fluid pressures and permeability changes be-tween different layers would greatly enhance the potential to simulate critical taper models. However, the experiments show that multiple-offset seismic imaging of shallow sand-box models, that are structurally evolving, is generally feasi-ble.
Acknowledgements. We thank G¨unter Tauscher and Thomas Ziegenhagen for their technical assistance in the laboratory, GMuG mbH, Bad Nauheim for technical support and sharing the codes, as well as Don Sherlock and Silvan Hoth for discussion. Reviews from Raphael Bartolom´e, Marc-Andr´e Gutscher and Donatienne Leparoux are gratefully acknowledged. This study was funded by the Helmholtz Centre Potsdam, GFZ German Research Centre for Geosciences.
Edited by: V. Sallares
References
Adam, J., Urai, J. L., Wieneke, B., Oncken, O., Pfeiffer, K., Kukowski, N., Lohrmann, J., Hoth, S., van der Zee, W. and Schmatz, J.: Shear localisation and strain distribution during tec-tonic faulting – new insights from granular-flow experiments and high resolution optical image correlation techniques, J. Struct. Geol.,, 27, 283–301, 2005.
Adam, J., Schreurs, G., Klinkm¨uller, M., and Wieneke, S.: 2-D/3-D Strain localisation and fault simulation in analogue experiments: insights from X-ray computed tomography and tomographic im-age correlation, Bolletino di Geofisica, 49, 21–22, 2008. Baldassarre, A., DeLucia, M., Nesi, P., and Rossi, F.: A
Vision-Based Particle Tracking Velocimetry, Real-Time Imaging 7, 145–158, 2001.
Bodet, L., Jacob, X., Tournat, V., Mourgues, R., and Gusev, V.: Elas-ticity profile of an unconsolidated granular medium inferred from guided waves: Toward acoustic monitoring of analogue models, Tectonophysics, 496, 99–104, doi:10.1016/j.tecto.2010.10.004, 2010.
Boutelier, D. and Oncken, O.: 3-D thermo-mechanical laboratory modeling of plate-tectonics: modeling scheme, technique and first experiments, Solid Earth, 2, 35–51, doi:10.5194/se-2-35-2011, 2011.
Bretaudeau, F., Leparoux, D., Durand, O. and Abraham, O.: Small-scale modeling of onshore seismic experiment: A tool to validate numerical modeling and seismic imaging methods, Geophysics, 76, T101–T112, doi:10.1190/GEO2010-0339.1, 2011.
Buddensiek, M.-L.: Seismic imaging of sandbox models, PhD-Thesis, FU Berlin, http: http://www.diss.fu-berlin.de/diss/ receive/FUDISS thesis 000000009439, last access: February 2013, 2009.
Buddensiek, M.-L., Krawczyk, C. M., Kukowski, N., and Oncken, O.: Performance of piezo-crystal transducers with respect to am-plitudes and waveform in laboratory seismic application, Geo-physics, 74, T33–T45, 2009.
Colletta, B., Letouzey, J., Pinedo, R., Ballard, J. F., and Bale, P.: Computerized X-ray tomography analysis of sandbox models: examples from thin skinned thrust systems, Geology, 19, 1063– 1067, 1991.
Davis, D., Suppe, J., and Dahlen, F. A.: Mechanics of fold-and-thrust belts and accretionary wedges, J. Geophys. Res., 88, 1153– 1172, 1983.
Graveleau, F. and Dominguez, S.: Analogue modelling of the inter-action between tectonics, erosion and sedimentation in foreland thrust belts, C. R. Geosci., 340, 324–333, 2008.
Graveleau, F., Malavieille, J., and Dominguez, S.: Experimental modelling of orogenic wedges: A review, Tectonophysics, 538– 540, 1–66, 2012.
Hampel, A., Adam, J., and Kukowski, N.: Response of the tec-tonically erosive South Peruvian forearc to subduction of the Nazca ridge: analysis of 3-D analogue experiments, Tectonics, 23, TC5003, doi:10.1029/2003TC001585, 2004.
Holland, M., van Gent, H., Bazalgette, L., Yassir, N., Hooger-duijn Strating, E. H., and Urai, J. L.: Evolution of dila-tant fracture networks in a normal fault – Evidence from 4-D model experiments, Earth Planet. Sci. Lett., 304, 399–406, doi:10.1016/j.epsl.2011.02.017, 2011.
Hoth, S., Hoffmann-Rothe, A., and Kukowski, N.: Frontal ac-cretion: An internal clock for bivergent wedge deforma-tion and surface uplift, J. Geophys. Res., 112, B06408, doi:10.1029/2006JB004357, 2007.
Hoth, S., Kukowski, N., and Oncken, O.: Distant effects in biver-gent orogenic belts – How retro-wedge erosion triggers resource formation in pro-foreland basins, Earth Planet. Sci. Lett., 273, 28–37, doi:10.1016/j.epsl.2008.05.033, 2008.
Hubbert, M. K.: Theory of scale models as applied to the study of geological structures, Geol. Soc. Am. Bull., 48, 1459–1520, 1937.
Jacob, X., Aleshin, V., Tournat, V., Leclaire, P., Lauriks, W., and Gu-sev, V. E.: Acoustic Probing of the Jamming Transition in an Un-consolidated Granular Medium, Phys. Rev. Lett., 100, 158003, doi:10.1103/PhysRevLett.100.158003, 2008.
Krantz, R. W.: Measurement of friction coefficients and cohesion for faulting and fault reactivation in laboratory models using sand and sand mixtures, Tectonophysics, 188, 203–207, 1991. Krautkraemer, J. and Krautkraemer, H.: Werkstoffpr¨ufung mit
Ul-traschall, Springer Verlag, Berlin, 1986.
Krawczyk, C. M., Eilts, F., Lassen, A., and Thybo, H.: Seismic evidence of Caledonian deformed crust and uppermost mantle structures in the northern part of the Trans-European Suture Zone (TESZ), SW Baltic Sea, Tectonophysics 360, 215–244, 2002.
Krawczyk, C. M., Mechie, J., Lueth, S., Tasarova, Z., Wigger, P., Stiller, M., Brasse, H., Echtler, H. P., Araneda, M., and Bataille, K.: Geophysical Signatures and active tectonics at the South-Central Chilean margin, Front. Earth Sci., 1, 171–192, 2006. Krawczyk, C. M., Buddensiek, M.-L., Philipp, J., Kukowski, N.,
and Oncken, O.: Midget seismic in sandbox models – hardware setup and first data generation, EAGE extended abstracts, E042, 5 pp., http://www.earthdoc.org/detail.php?pubid=6643, last ac-cess: February 2013, 2007.
Lohrmann, J., Kukowski, N., Adam, J., and Oncken, O.: The impact of analogue material properties on the geometry, kinematics, and dynamics of convergent sand wedges, J. Struct. Geol., 25, 1691– 1711, 2003.
Long, A.: An overview of seismic azimuth for towed streamers, The Leading Edge, 29, 512–523, doi:10.1190/1.3422448, 2010. Persson, K. S., Garcia-Castellanos, D., and Sokoutis, D.: River
transport effects on compressional belts: First results from an integrated analogue-numerical model, J. Geophys. Res., 109, B01409, doi:10.1029/2002JB002274, 2004.
Reiter, K., Kukowski, N., and Ratschbacher, L.: The interaction of two indenters in analogue experiments and implications for curved fold-and-thrust belts, Earth Planet. Sci. Lett., 302, 132– 146, doi:10.1016/j.epsl.2010.12.002, 2011.
Rosenau, M., Nerlich, R., Brune, S., and Oncken, O.: Experimental insights into the scaling and variability of local tsunamis trig-gered by giant subduction megathrust earthquakes, J. Geophys. Res., 115, B09314, doi:10.1029/2009JB007100, 2010.
Schreurs, G., H¨anni, R., Panien, M., and Vock, P.: Analysis of ana-logue models by helical X-ray computed tomography, Geol. Soc. Sp., 215, 213–223, 2003.
Sherlock, D. H.: Seismic imaging of sandbox models, PhD the-sis, Curtin University, Perth, http://www.geophysics.curtin.edu. au/EGPPUBS/Docs/2000-000909-TPH.PDF, 1999.
Sherlock, D. H. and Evans, B. J.: The development of seismic re-flection sandbox modelling, AAPG Bull., 85, 1645–1659, 2001. Storti, F., Salvini, F., and McClay, K. R.: Synchronous and velocity-partitioned thrusting and thrust polarity reversal in experimen-tally produced, doubly-vergent thrust wedges – implications for natural orogens, Tectonics, 19, 378–396, 2000.