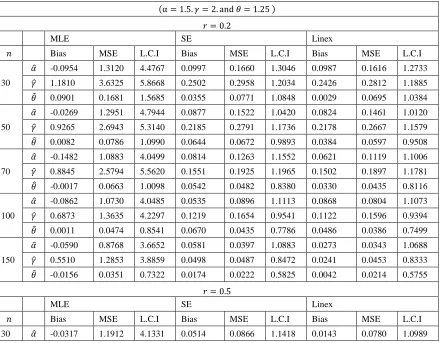
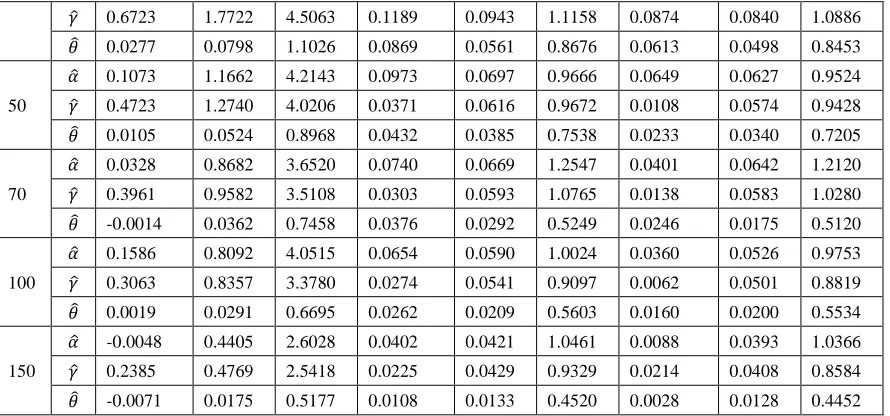
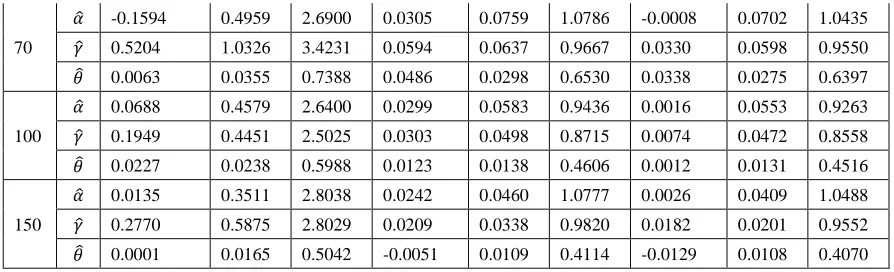
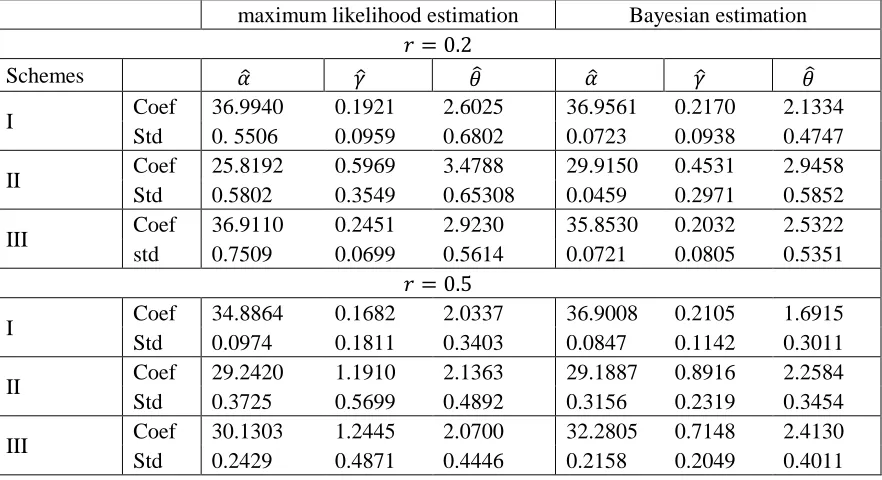
Generalized Exponential Distribution Parameters Using Progressive
Censoring Schemes
Ehab Mohamed Almetwally
Institute of Statistical Studies and Research, Cairo Statistics, Egypt [email protected]
Amaal El sayed Mubarak
Department of Applied Statistics, Faculty of Commerce - Damietta University, Egypt [email protected]
Hisham Mohamed Almongy
Department of Applied Statistics, Faculty of Commerce - Mansoura University, Egypt [email protected]
Abstract
In this paper we consider the estimation of the Weibull Generalized Exponential Distribution (WGED) Parameters with Progressive Censoring Schemes. In order to obtain the optimal censoring scheme for WGED, more than one method of estimation was used to reach a better scheme with the best method of estimation. The maximum likelihood method and the method of Bayesian estimation for (square error and Linex) loss function have been used. Monte carlo simulation is used for comparison between the two methods of estimation under censoring schemes. To show how the schemes work in practice; we analyze a strength data for single carbon fibers as a case of real data.
Keywords: Weibull generalized exponential distribution; Maximum likelihood estimation; Bayesian estimation; MCMC; Censoring scheme.
1. Introduction
The exponential family, have more of applications including life testing experiments, reliability analysis, applied statistics and clinical studies, and the Weibull distribution is one of the most popular distributions in analyzing lifetime data. Mustafa et al. (2016) used the Weibull-G family to generating the Weibull- Generalized Exponential distribution (WGED). A random variable π₯ has WGED with parameters πΌ. πΎ and π, say if its cumulative distribution function (cdf), probability density function (pdf) and the quantile function are given by
The cdf is
πΉ(π₯; πΌ. πΎ. π) = 1 β πβπΌ(ππΎπ₯β1)π (1.1)
the corresponding pdf is
Graph 1:Plot of WGED with different parameters values
The quantile function of the WGED is:
π₯ =1
πΎln (1 + [
β1
πΌ ln(1 β π’)]
1 π β
) . 0 < π’ < 1 (1.3)
Kundu and Pradhan (2009) discussed the two most common censoring schemes are termed as type-I and type-II censoring schemes. Kim and Han (2009) discussed, progressively type-II censored sampling as an important method of obtaining data in lifetime studies. Ng et al. (2004) introduced, a progressive type-II censoring scheme can be described as follows: Suppose π units are placed on a life test and the experimenter decides beforehand the quantity m, the number of failures to be observed. Now at the time of the first failure, π 1 of the remaining π β 1 surviving units are randomly removed from the experiment. At the time of the second failure, π 2 of the remaining π β π 1 β 1 units are randomly removed from the experiment. Finally, at the time of the π-th failure, all π-the remaining surviving units π π = π β π β π 1 β Β· Β· Β· β π πβ1 are removed from the experiment. Therefore, a progressive type-II censoring scheme consists of π, and π 1β¦ π π, such that π 1 + Β· Β· Β· + π π = π β π. For more examples, see Dey et al. (2016), Elsherpieny et al. (2017), Mohamed et al. (2018) and Almetwaly and Almongy (2018), see for instance the book by Balakrishnan and Aggrawalla (2000), and an excellent review article by Balakrishnan et al (2007).
2. The Maximum Likelihood Estimation Method
Based on the observed π₯1 < β― < π₯πfrom a progressive Type-II censored sample scheme, π 1. β¦ . π π the likelihood function can be written as
πΏ = π΄(πΌπΎπ)πππΎ βππ=1π₯π πβπΌ βππ=1(ππΎπ₯πβ1)πβ [(ππΎπ₯πβ 1)πβ1(πβπΌ(ππΎπ₯πβ1)π)π π] π
π=1
(2.1)
Where π΄ = π(π β π 1β 1) β¦ (π β βπβ1π=1 π π β (π β 1)) is a constant which doesnβt depend on parameters.
ln πΏ = ln π΄ + π ln(πΌπΎπ) + πΎ β π₯π π
π=1
+ (π β 1) β ln(ππΎπ₯πβ 1)
π
π=1
β πΌ β(ππΎπ₯πβ 1)π
π
π=1
β πΌ β π π
π
π=1
(ππΎπ₯πβ 1)π
(2.2)
respectively. To obtain the normal equations for the unknown parameters, we differentiate (2.2) partially with respect to the parameters (πΌ, πΎ and π) and equate them to zero. The estimators πΌΜ, πΎΜ and πΜ can be obtained as the solution of the following equations.
βln πΏ
ππΌ =
π
πΌ β β(ππΎπ₯πβ 1)π
π
π=1
β β π π
π
π=1
(ππΎπ₯πβ 1)π (2.3)
βln πΏ ππΎ = π πΎ + β π₯π π π=1
+ (π β 1) β π₯ππ
πΎπ₯π
(ππΎπ₯πβ 1) π
π=1
β ππΌ β π₯πππΎπ₯π(ππΎπ₯πβ 1)πβ1 π
π=1
β ππΌ β π π π₯πππΎπ₯π(ππΎπ₯πβ 1)πβ1 π π=1 (2.4) βln πΏ ππ = π
π + β ln(ππΎπ₯πβ 1)
π
π=1
β πΌ β(ππΎπ₯πβ 1)πln(ππΎπ₯πβ 1) π
π=1
β πΌ β π π (ππΎπ₯πβ 1)πln(ππΎπ₯π β 1) π
π=1
(2.5)
But the three equation has to be performed numerically using a nonlinear optimization algorithm.
3. Bayesians Estimation
For Bayesian estimation, the unknown parameters πΌ, πΎ and π of WGED are assumed to be independent and have their own conjugate prior distributions. Assumed that πΌ~πΊππππ(π. π), πΎ~πΊππππ(π. π) and π~πΊππππ(π. π) then, the joint prior density of πΌ. πΎ and π can be written as
π(πΌ. πΎ. π) β πΌπβ1πβπΌππΎπβ1πβπΎπππβ1πβππ (3.1)
Based on the likelihood function (2.1) and the joint prior density (3.1), the joint posterior density of πΌ, πΎ and π and the data is
π(πΌ, πΎ, π, π₯) β πΌπ+πβ1πβπΌππΎπ+πβ1πβπΎπππ+πβ1πβππππΎ βππ=1π₯ππβπΌ βππ=1(ππΎπ₯πβ1)π
β [(ππΎπ₯πβ 1)πβ1(πβπΌ(ππΎπ₯πβ1)π)π π] π
π=1
(3.2)
For the WGED under Progressive Type-II censoring, the full conditional posterior distributions of the parameters are given by
Ο(πΎ; πΌ, π, π₯) β πΎπ+πβ1πβπΎπππΎ βππ=1π₯πβ [(ππΎπ₯π π=1 β 1)πβ1(πβπΌ(ππΎπ₯πβ1)π
)π π] πβπΌ βπ (ππΎπ₯πβ1)π π=1
(3.4)
Ο( π; πΌ, πΎ, π₯) β ππ+πβ1πβππβ [(ππΎπ₯π π
π=1 β 1)πβ1(πβπΌ(ππΎπ₯πβ1)π
)π π] πβπΌ βπ (ππΎπ₯πβ1)π π=1
(3.5)
Since the conditional posterior distributions do not have simple forms in perspective of sampling, we use the Metropolis-Hastings algorithm. An important sub-class of MCMC methods are Gibbs sampling and more general Metropolis within Gibbs samplers. The advantage of using the MCMC method over the MLE method is that we can always obtain a reasonable interval estimate of the parameters by constructing the probability intervals based on empirical posterior distribution. To generate samples from the conditional posterior density distributions, we use Markov chain Monte Carlo (MCMC). In more information about the Metropolis-Hastings algorithm see Metropolis et al (1953) and to more example see Amin (2017) and Nassar et al (2018).
3.1. Square Error Loss Function
Almetwaly and Almongy (2018) discussed square error (SE) loss function as a very
well-known symmetric loss function which define as πΏ(πΏΜππΈ. πΏππΈ) = (πΏΜ β πΏ)2, after generating of parameters
πΌΜ = βπΌ(π) π π
π=1
, πΎΜ = βπΎ(π) π π
π=1
, πΜ = βπ(π) π π
π=1
(3.6)
where M is number of periods in the MCMC process.
3.2. Linex Loss Function
One of the most commonly-used asymmetric loss functions is the Linex loss
πΏ(πΏΜπΏ, πΏπΏ) = πβ(πΏΜβπΏ)β β(πΏΜ β πΏ) β 1, β β 0
(3.7)
πΌΜΜ =β1
π£ ln (β
πβπ£πΌ(π) π π
π=1
) , πΎΜΜ = β1
π£ ln (β
πβπ£π(π) π π
π=1
) ,
πΜΜ =β1
π£ ln (β
πβπ£πΌ(π) π π
π=1
)
(3.8)
4. Asymptotic Confidence Intervals
In this section, we propose the asymptotic confidence intervals using methods of estimations. Keeping this in mind, we may propose the asymptotic confidence intervals using MLE and Bayesian estimation of SE and Linex loss function methods can be used to construct the confidence intervals for the parameters. πΌ(πΌΜ. πΎΜ. ΞΈΜ) is the observed inverse Fishers information matrix and is define as:
πΌ(πΌΜ. πΎΜ. ΞΈΜ) = [
βπΏβ²β²πΌπΌ βπΏβ²β²πΌπΎ βπΏβ²β²πΌπ βπΏβ²β²πΎπΌ βπΏβ²β²πΎπΎ βπΏβ²β²πΎπ
βπΏβ²β²ππΌ βπΏ
ππΎ
β²β² βπΏ
ππ β²β²
] β1
= β
πΌπΌΜπΌΜ πΌπΌΜπΎΜ πΌπΌΜπΜ πΌπΎΜπΌΜ πΌπΎΜπΎΜ πΌπΎΜπΜ πΌπΜπΌΜ πΌπΜπΎΜ πΌπΜπΜ
β (4.1)
And then compensation for the value of each parameter estimated for each methods and get the matrix mathematically through simulation package. An approximate 95% two side confidence intervals for (Ξ±. πΎ and π) are respectively
πΌΜ Β± π0.025βπΌπΌΜπΌΜ, πΎΜ Β± π0.025βπΌπΎΜπΎΜ, πΜ Β± π0.025βπΌπΜπΜ (4.2)
5. Simulation Study
In this section; Monte Carlo simulation is done for comparison between maximum likelihood and Bayesian estimation methods under censoring scheme, for estimating parameters of WGED in life time by R language. Monte Carlo experiments were carried out based on the following data- generated from MarshallβOlkin Extended Weibull distribution by use (1.3), where π₯ are distributed as MOEW for different shape parameters (Ξ± = 1.5, πΎ = 2 and π = 1.25 ) and (Ξ± = 1.5, πΎ = 0.6 and π = 1.25 ), and for different sample size π = 30, 50, 70, 100 πππ 150, different ratio of effective sample sizes π = ππ, and set of different samples schemes, where
β’ Scheme I: π 1 = π 2 = β― = π mβ1 = 0. πππ π m = π β π. It is type-II scheme
β’ Scheme II: π 1 = π β π πππ π 2 = π 3 = β― = π mβ1= 0.
β’ Scheme III: π 1 = π 2 = β― = π mβ1= 1. πππ π m= π β 2π β 1.
We could define the best scheme as the scheme which minimizes the mean squared error (πππΈ(π)), Bias of estimation and length of confidence interval (L.CI) of the estimator.
The following are Some of the graphs of Bias and MSE in complete sample scheme which are plotted and attached for two cases:
Graph 2: MSE for the methods in complete sample scheme in case-I
Graph 3: MSE for the methods in complete sample scheme in case-II
0.0000 0.1500 0.3000 0.4500 0.6000 0.7500 0.9000 1.0500
3 0 5 0 7 0 1 0 0 1 5 0
π
ππΈ
(
πΌ
)
MLE SE Linex
0.0000 0.1500 0.3000 0.4500 0.6000 0.7500 0.9000 1.0500
3 0 5 0 7 0 1 0 0 1 5 0
π
ππΈ
(
πΎ
)
MLE SE Linex
0.0000 0.0100 0.0200 0.0300 0.0400 0.0500
3 0 5 0 7 0 1 0 0 1 5 0
π
ππΈ
(
π
)
MLE SE Linex
0 0.2 0.4 0.6 0.8
3 0 5 0 7 0 1 0 0 1 5 0
MLE LS Linex
0.0000 0.0500 0.1000 0.1500 0.2000 0.2500 0.3000
3 0 5 0 7 0 1 0 0 1 5 0
π
ππΈ
(
πΌ
)
MLE SE Linex
0.0000 0.0500 0.1000 0.1500 0.2000
3 0 5 0 7 0 1 0 0 1 5 0
π
ππΈ
(
πΎ
)
MLE SE Linex
0.0000 0.0200 0.0400 0.0600
3 0 5 0 7 0 1 0 0 1 5 0
π
ππΈ
(
π
)
MLE SE Linex
0 0.05 0.1 0.15 0.2
3 0 5 0 7 0 1 0 0 1 5 0
π
ππΈ
In the complete samples, we observe the Bayesian estimation is better and more efficient than the maximum likelihood estimation. As is evident in the previous presentation in Graph 2 and Graph 3.
Table 1:Parameter estimation for WGED under Scheme-I in case-I
(Ξ±= 1.5. πΎ = 0.6. and π = 1.25 ) π = 0.2
MLE SE Linex
n Bias MSE L.C.I Bias MSE L.C.I Bias MSE L.C.I
30
πΌΜ -0.0510 0.2830 2.0769 -0.0466 0.1573 1.2051 -0.0881 0.1491 1.2431
πΎΜ 0.4865 0.6368 2.4810 0.1345 0.2721 0.9153 0.1055 0.2603 0.8737
πΜ 0.5247 1.0402 3.4301 0.0300 0.2925 1.0544 -0.0013 0.2757 1.0096
50
πΌΜ -0.0518 0.1691 1.6000 0.0225 0.1109 1.2971 -0.0251 0.1093 1.2616
πΎΜ 0.2650 0.2956 1.8621 0.0861 0.1578 0.8574 0.0621 0.1475 0.8228
πΜ 0.2278 0.2789 1.8688 0.0474 0.1846 0.9840 0.0194 0.1788 0.9519
70
πΌΜ -0.0213 0.1584 1.1343 0.0662 0.1013 1.2264 0.0208 0.0923 1.1940
πΎΜ 0.1738 0.1515 1.3656 0.0504 0.1109 0.7988 0.0307 0.1039 0.7676
πΜ 0.1826 0.1929 1.5667 0.0597 0.1397 0.9334 0.0354 0.1214 0.8824
100
πΌΜ -0.0258 0.1381 1.4539 0.0437 0.0953 1.3268 0.0011 0.0910 1.2888
πΎΜ 0.1533 0.0978 1.0688 0.0766 0.0613 0.7613 0.0582 0.0577 0.7293
πΜ 0.1359 0.1155 1.2218 0.0417 0.0995 0.8185 0.0217 0.0908 0.7908
150
πΌΜ -0.0473 0.1063 1.2649 0.0100 0.0820 1.2575 -0.0287 0.0772 1.2232
πΎΜ 0.1137 0.0933 1.1793 0.0854 0.0463 0.7612 0.0675 0.0439 0.7291
πΜ 0.0721 0.0589 0.9090 0.0482 0.0373 0.7371 0.0315 0.0345 0.7215
π = 0.5
MLE SE Linex
n Bias MSE L.C.I Bias MSE L.C.I Bias MSE L.C.I
30
πΌΜ -0.1313 0.2395 1.9254 0.0098 0.1108 1.2038 -0.0329 0.1069 1.2333
πΎΜ 0.2206 0.2868 1.9138 0.0838 0.1431 0.748 0.0683 0.1383 0.7227
πΜ 0.1226 0.1473 1.4264 0.113 0.0857 1.0637 0.0828 0.0738 1.0192
50
πΌΜ -0.1005 0.1837 2.256 0.0526 0.10899 1.163 0.0187 0.09856 1.1504
πΎΜ 0.184 0.1863 1.5316 0.0385 0.1183 0.5114 0.0281 0.1107 0.5005
πΜ 0.0561 0.0739 1.043 0.0835 0.0602 0.9093 0.0582 0.0497 0.8482
70
πΌΜ -0.0918 0.1364 2.3377 0.0353 0.0935 1.3043 -0.0037 0.09091 1.2883
πΎΜ 0.1548 0.1673 1.4849 0.0367 0.0985 0.5153 0.0265 0.0907 0.4981
πΜ 0.035 0.048 0.8478 0.0018 0.0324 0.7093 -0.0153 0.0302 0.6819
100
πΌΜ -0.0994 0.0921 1.7361 0.0152 0.0971 1.2881 -0.0271 0.0844 1.2684
πΎΜ 0.1182 0.0984 1.1394 0.0351 0.0575 0.5505 0.0259 0.0490 0.5328
πΜ 0.0264 0.0296 0.6667 0.006 0.023 0.5974 -0.0077 0.0219 0.5826
150
πΌΜ -0.024 0.0365 0.7431 0.0277 0.0342 1.3268 -0.0079 0.0312 1.3132
πΎΜ 0.0327 0.0204 0.5446 0.0492 0.0201 0.5242 0.0417 0.0181 0.5037
πΜ 0.0237 0.0192 0.536 0.0221 0.0162 0.4945 0.0126 0.0155 0.4878
Graph 4: MSE for the methods in censoring sample scheme-I in case-I
We can observe that as the ratio of effective sample sizes (r) increases for censoring sample, the value of the MSE decreases for the parameters of WGED.
Table 2: Parameter estimation for WGED under Scheme-II in case-I (Ξ± = 1.5. πΎ = 0.6. and π = 1.25 )
π = 0.2
MLE SE Linex
π Bias MSE L.C.I Bias MSE L.C.I Bias MSE L.C.I
30
πΌΜ -0.3243 0.9019 3.5006 -0.1355 0.1984 1.2282 -0.1272 0.1901 1.2087
πΎΜ 0.6573 1.2719 3.5942 0.1907 0.2414 0.7174 0.1701 0.2348 0.6811
πΜ 0.0585 0.1829 1.6616 0.0257 0.1066 1.0116 -0.049 0.1014 0.9759
50
πΌΜ -0.2914 0.6778 3.0198 0.059 0.1262 1.2838 -0.0412 0.1185 1.2873
πΎΜ 0.4746 0.7994 2.9718 0.1271 0.1591 0.6992 0.1217 0.1534 0.6624
πΜ -0.0105 0.0974 1.2230 0.0445 0.0519 0.8802 0.0193 0.0458 0.8394
70 πΌΜ -0.2791 0.6553 2.9801 0.0329 0.1202 1.4696 -0.0111 0.1200 1.4499
0.0000 0.1000 0.2000 0.3000
3 0 5 0 7 0 1 0 0 1 5 0
M S E (πΌ)
MLE SE Linex
0 0.1 0.2 0.3
3 0 5 0 7 0 1 0 0 1 5 0
M S E (πΌ)
MLE SE Linex
0.0000 0.2000 0.4000 0.6000 0.8000
3 0 5 0 7 0 1 0 0 1 5 0
M S E (πΎ)
MLE SE Linex
-0.1000 0.1000 0.3000
3 0 5 0 7 0 1 0 0 1 5 0
M S E (πΎ)
MLE SE Linex
0.0000 0.5000 1.0000
3 0 5 0 7 0 1 0 0 1 5 0
M S E (π)
MLE SE Linex
0.0000 0.1000 0.2000
3 0 5 0 7 0 1 0 0 1 5 0
M S E (π)
πΎΜ 0.3955 0.5604 2.4928 0.1009 0.1223 0.5536 0.0675 0.1193 0.5271
πΜ -0.0121 0.0802 1.1095 0.0122 0.0405 0.7917 -0.0070 0.0374 0.7611
100
πΌΜ -0.2644 0.6079 3.1327 0.0735 0.1127 1.2905 0.0325 0.1015 1.2487
πΎΜ 0.3483 0.4058 2.0921 0.0934 0.0931 0.5439 0.0937 0.0907 0.5259
πΜ -0.0223 0.0570 0.9324 0.0390 0.0350 0.7206 0.0209 0.0310 0.6883
150
πΌΜ -0.2331 0.5022 2.6248 0.0386 0.1082 1.2940 0.0227 0.0922 1.3034
πΎΜ 0.2546 0.2574 1.7212 0.0617 0.0237 0.5559 0.0542 0.0213 0.5342
πΜ -0.0305 0.0406 0.7809 0.0295 0.0185 0.5228 0.0161 0.0170 0.5103
π = 0.5
MLE SE Linex
π Bias MSE L.C.I Bias MSE L.C.I Bias MSE L.C.I
30
πΌΜ -0.2120 0.6123 2.9016 -0.0820 0.1033 1.2660 -0.0814 0.1033 1.2556
πΎΜ 0.3144 0.4065 2.1752 0.0969 0.1262 0.5806 0.0921 0.1134 0.5607
πΜ 0.0118 0.0897 1.1739 0.0400 0.0567 0.9251 0.0185 0.0525 0.8999
50
πΌΜ -0.1579 0.5989 2.9714 -0.0661 0.0908 1.1872 -0.0651 0.0913 1.1821
πΎΜ 0.2742 0.3282 1.9727 0.0580 0.0829 0.5508 0.0478 0.0895 0.5170
πΜ -0.0161 0.0638 0.9888 -0.0018 0.0400 0.7881 -0.0200 0.0382 0.7664
70
πΌΜ -0.1807 0.4007 2.3793 -0.0861 0.0881 1.3540 -0.0828 0.0826 1.0094
πΎΜ 0.1870 0.1695 1.4383 0.0509 0.0783 0.4940 0.0429 0.0760 0.4683
πΜ -0.0155 0.0401 0.7833 0.0393 0.0234 0.5820 0.0250 0.0215 0.5696
100
πΌΜ -0.1177 0.2295 1.8212 -0.0840 0.0809 1.0707 -0.0803 0.0798 1.0971
πΎΜ 0.1278 0.1304 1.3243 0.0740 0.0207 0.4860 0.0662 0.0180 0.4592
πΜ -0.0040 0.0299 0.6782 0.0054 0.0211 0.5725 -0.0061 0.0204 0.5622
150
πΌΜ -0.0071 0.2237 1.8549 -0.0533 0.0524 0.6110 -0.0504 0.0532 0.6075
πΎΜ 0.0520 0.0409 0.7665 0.0614 0.0188 0.4823 0.0548 0.0162 0.4533
πΜ 0.0032 0.0158 0.4935 0.0057 0.0127 0.4427 -0.0022 0.0124 0.4382
Table 3: Parameter estimation for WGED under Scheme-III in case I (Ξ± = 1.5. πΎ = 0.6. and π = 1.25 )
π = 0.2
MLE SE Linex
π Bias MSE L.C.I Bias MSE L.C.I Bias MSE L.C.I
30
πΌΜ -0.0768 0.3210 2.2015 -0.0937 0.1303 1.4222 -0.0989 0.1299 1.4119
πΎΜ 0.4978 0.6690 2.5454 0.1214 0.1699 0.9250 0.0941 0.0600 0.8910
πΜ 0.4905 0.9304 3.2574 0.1735 0.2801 1.0766 0.1424 0.2723 1.0459
50
πΌΜ -0.0759 0.1948 1.7053 -0.0834 0.1125 1.3181 -0.0822 0.1195 1.3398
πΎΜ 0.2736 0.3001 1.8612 0.1063 0.1157 0.9752 0.0981 0.1098 0.9105
πΜ 0.2121 0.2544 1.7946 0.1209 0.1673 0.9707 0.1158 0.1581 0.9265
70
πΌΜ -0.0384 0.1809 1.1733 -0.0796 0.0987 1.2352 -0.0752 0.0912 1.2346
πΎΜ 0.1764 0.1592 1.4036 0.0864 0.0989 0.8178 0.0867 0.0930 0.7860
πΜ 0.1715 0.1763 1.5029 0.1084 0.1422 0.8873 0.1046 0.1363 0.8456
100
πΌΜ -0.0327 0.1631 1.5787 -0.0610 0.0634 1.2031 -0.0607 0.0604 1.2024
πΎΜ 0.1573 0.1072 1.1263 0.0689 0.0766 0.7913 0.0616 0.0696 0.7484
πΜ 0.1276 0.1063 1.1768 0.0666 0.0425 0.7916 0.0266 0.0394 0.7751
150 πΌΜ -0.0553 0.1229 1.3575 -0.0131 0.0232 1.0649 -0.0449 0.0756 1.0685
πΜ 0.0669 0.0544 0.8765 0.0228 0.0275 0.6529 0.0177 0.0264 0.6359 π = 0.5
MLE SE Linex
π Bias MSE L.C.I Bias MSE L.C.I Bias MSE L.C.I
30
πΌΜ -0.2017 0.3195 2.5427 -0.1147 0.1004 1.1158 -0.1121 0.1008 1.1164
πΎΜ 0.3132 0.4383 2.2874 0.1003 0.0967 0.6118 0.0978 0.0942 0.5951
πΜ 0.0663 0.1097 1.2730 0.0953 0.0866 0.7323 0.0215 0.0832 0.7123
50
πΌΜ -0.1799 0.3055 2.8112 -0.0751 0.0870 1.3476 -0.0710 0.0835 1.3485
πΎΜ 0.3059 0.3852 2.1180 0.0787 0.0781 0.5835 0.0671 0.0742 0.5535
πΜ 0.0079 0.0635 0.9881 0.0812 0.0442 0.7269 -0.0766 0.0426 0.7104
70
πΌΜ -0.1869 0.2843 2.4642 -0.0693 0.0632 1.2634 -0.0645 0.0624 1.2582
πΎΜ 0.2250 0.2265 1.6446 0.0553 0.0685 0.6131 0.0553 0.0650 0.5835
πΜ -0.0003 0.0394 0.7781 0.0597 0.0220 0.5724 0.0458 0.0207 0.5632
100
πΌΜ -0.1468 0.2581 1.9980 -0.0162 0.0332 1.2638 -0.0507 0.0315 1.2580
πΎΜ 0.1595 0.1438 1.3496 0.0597 0.0483 0.4786 0.0527 0.0466 0.4628
πΜ 0.0014 0.0258 0.6295 0.0470 0.0200 0.6117 0.0455 0.0195 0.5982
150
πΌΜ -0.0367 0.1421 1.4712 -0.0177 0.0290 1.2374 -0.0152 0.0259 1.2122
πΎΜ 0.0573 0.0468 0.8184 0.0524 0.0210 0.5321 0.0450 0.0187 0.5083
πΜ 0.0109 0.0164 0.5001 -0.0033 0.0099 0.3921 -0.0103 0.0098 0.3880
Table 4: Parameter estimation for WGED under Scheme-I in case-II (Ξ± = 1.5. πΎ = 2. and π = 1.25 )
π = 0.2
MLE SE Linex
π Bias MSE L.C.I Bias MSE L.C.I Bias MSE L.C.I
30
πΌΜ 0.4134 1.0167 3.6071 0.0996 0.1975 1.2299 -0.0929 0.1970 1.2202
πΎΜ 0.8999 2.2436 4.6961 0.1264 0.2146 1.3336 0.1168 0.2160 1.3291
πΜ 0.5578 1.2064 3.7108 0.0768 0.1491 0.8703 0.0773 0.1470 0.8536
50
πΌΜ 0.1916 0.5311 2.7577 0.0425 0.1113 1.3034 0.0012 0.1051 1.2774
πΎΜ 0.5309 0.9718 3.2578 0.1107 0.1824 1.3110 0.1103 0.1780 1.2946
πΜ 0.2374 0.3001 1.9362 0.0725 0.0941 0.8177 0.0715 0.0909 0.7963
70
πΌΜ 0.1069 0.3840 2.3939 0.0488 0.1023 1.2455 0.0069 0.0934 1.2035
πΎΜ 0.4497 0.7335 2.8588 0.0627 0.1221 1.3758 -0.0664 0.1114 1.3107
πΜ 0.1848 0.2031 1.6119 0.0193 0.0311 0.6906 0.0027 0.0296 0.6779
100
πΌΜ 0.0960 0.2202 1.8013 0.0613 0.0916 1.2759 0.0601 0.0901 1.2365
πΎΜ 0.2966 0.4175 2.2513 -0.0526 0.0932 1.2017 -0.0502 0.0923 1.1805
πΜ 0.1406 0.1203 1.2437 0.0190 0.0307 0.7190 -0.0138 0.0289 0.7130
150
πΌΜ 0.0791 0.1443 1.4573 0.0346 0.0597 1.1723 -0.0307 0.0525 1.1523
πΎΜ 0.1680 0.2091 1.6679 0.0224 0.0657 1.2777 -0.0159 0.0618 1.2244
πΜ 0.0787 0.0646 0.9482 -0.0134 0.0221 0.5838 -0.0148 0.0121 0.5780
MLE SE Linex
π Bias MSE L.C.I Bias MSE L.C.I Bias MSE L.C.I
30
πΌΜ -0.0237 0.6885 3.2530 0.1248 0.1005 1.1041 0.1100 0.0927 1.0619
πΎΜ 0.6043 1.4382 4.0628 0.1342 0.1928 1.1735 0.1287 0.1855 1.1463
πΜ 0.1180 0.1470 1.4306 0.0422 0.0557 0.9150 0.0170 0.0505 0.8829
50
πΌΜ 0.0561 0.4818 2.7134 0.1180 0.0944 1.1711 0.1121 0.0860 1.1437
πΎΜ 0.3242 0.7136 3.0592 0.1056 0.1452 1.2143 -0.1015 0.1360 1.2185
πΜ 0.0698 0.0773 1.0558 0.0366 0.0387 0.7618 0.0173 0.0363 0.7472
70
πΌΜ -0.0934 0.2273 1.8337 0.0198 0.0799 1.1106 -0.0096 0.0756 1.0823
πΎΜ 0.2647 0.3784 2.1779 0.0952 0.1127 1.0579 -0.0926 0.1080 1.0569
πΜ 0.0418 0.0431 0.7978 0.0053 0.0291 0.6713 -0.0093 0.0281 0.6596
100
πΌΜ 0.0362 0.1157 1.3262 0.0187 0.0691 1.0914 0.0201 0.0657 1.0808
πΎΜ 0.0819 0.1190 1.3142 0.0835 0.0815 1.0522 0.0793 0.0781 1.0267
πΜ 0.0426 0.0298 0.6565 0.0049 0.0222 0.5871 -0.0066 0.0215 0.5775
150
πΌΜ -0.0667 0.1040 2.4614 -0.0069 0.0166 1.0903 -0.0384 0.0137 1.0290
πΎΜ 0.3337 0.1064 2.8510 0.0612 0.0702 1.1133 0.0634 0.0691 1.0579
πΜ 0.0068 0.0098 0.5509 0.0104 0.0141 0.4668 -0.0062 0.0135 0.4571
Table 5:Parameter estimation for WGED under Scheme-II in case-II (Ξ± = 1.5. πΎ = 2. and π = 1.25 )
π = 0.2
MLE SE Linex
π Bias MSE L.C.I Bias MSE L.C.I Bias MSE L.C.I
30
πΌΜ -0.0954 1.3120 4.4767 0.0997 0.1660 1.3046 0.0987 0.1616 1.2733
πΎΜ 1.1810 3.6325 5.8668 0.2502 0.2958 1.2034 0.2426 0.2812 1.1885
πΜ 0.0901 0.1681 1.5685 0.0355 0.0771 1.0848 0.0029 0.0695 1.0384
50
πΌΜ -0.0269 1.2951 4.7944 0.0877 0.1522 1.0420 0.0824 0.1461 1.0120
πΎΜ 0.9265 2.6943 5.3140 0.2185 0.2791 1.1736 0.2178 0.2667 1.1579
πΜ 0.0082 0.0786 1.0990 0.0644 0.0672 0.9893 0.0384 0.0597 0.9508
70
πΌΜ -0.1482 1.0883 4.0499 0.0814 0.1263 1.1552 0.0621 0.1119 1.1006
πΎΜ 0.8845 2.5794 5.5620 0.1551 0.1925 1.1965 0.1502 0.1897 1.1781
πΜ -0.0017 0.0663 1.0098 0.0542 0.0482 0.8380 0.0330 0.0435 0.8116
100
πΌΜ -0.0862 1.0730 4.0485 0.0535 0.0896 1.1113 0.0868 0.0804 1.1073
πΎΜ 0.6873 1.3635 4.2297 0.1219 0.1654 0.9541 0.1122 0.1596 0.9394
πΜ 0.0011 0.0474 0.8541 0.0670 0.0435 0.7786 0.0486 0.0386 0.7499
150
πΌΜ -0.0590 0.8768 3.6652 0.0581 0.0397 1.0883 0.0273 0.0343 1.0688
πΎΜ 0.5510 1.2853 3.8859 0.0498 0.0487 0.8472 0.0241 0.0453 0.8333
πΜ -0.0156 0.0351 0.7322 0.0174 0.0222 0.5825 0.0042 0.0214 0.5755
π = 0.5
MLE SE Linex
π Bias MSE L.C.I Bias MSE L.C.I Bias MSE L.C.I
πΎΜ 0.6723 1.7722 4.5063 0.1189 0.0943 1.1158 0.0874 0.0840 1.0886
πΜ 0.0277 0.0798 1.1026 0.0869 0.0561 0.8676 0.0613 0.0498 0.8453
50
πΌΜ 0.1073 1.1662 4.2143 0.0973 0.0697 0.9666 0.0649 0.0627 0.9524
πΎΜ 0.4723 1.2740 4.0206 0.0371 0.0616 0.9672 0.0108 0.0574 0.9428
πΜ 0.0105 0.0524 0.8968 0.0432 0.0385 0.7538 0.0233 0.0340 0.7205
70
πΌΜ 0.0328 0.8682 3.6520 0.0740 0.0669 1.2547 0.0401 0.0642 1.2120
πΎΜ 0.3961 0.9582 3.5108 0.0303 0.0593 1.0765 0.0138 0.0583 1.0280
πΜ -0.0014 0.0362 0.7458 0.0376 0.0292 0.5249 0.0246 0.0175 0.5120
100
πΌΜ 0.1586 0.8092 4.0515 0.0654 0.0590 1.0024 0.0360 0.0526 0.9753
πΎΜ 0.3063 0.8357 3.3780 0.0274 0.0541 0.9097 0.0062 0.0501 0.8819
πΜ 0.0019 0.0291 0.6695 0.0262 0.0209 0.5603 0.0160 0.0200 0.5534
150
πΌΜ -0.0048 0.4405 2.6028 0.0402 0.0421 1.0461 0.0088 0.0393 1.0366
πΎΜ 0.2385 0.4769 2.5418 0.0225 0.0429 0.9329 0.0214 0.0408 0.8584
πΜ -0.0071 0.0175 0.5177 0.0108 0.0133 0.4520 0.0028 0.0128 0.4452
Table 6: Parameter estimation for WGED under Scheme-III in case-II (Ξ± = 1.5. πΎ = 2. and π = 1.25 )
π = 0.2
MLE SE Linex
π Bias MSE L.C.I Bias MSE L.C.I Bias MSE L.C.I
30
πΌΜ 0.3783 0.9428 3.5072 0.0652 0.1381 1.4412 0.0246 0.1199 1.3606
πΎΜ 0.8671 2.1383 4.6180 -0.0138 0.1133 1.3250 -0.0595 0.1181 1.3332
πΜ 0.5236 1.0755 3.5109 0.0371 0.0597 0.9515 0.0117 0.0573 0.9423
50
πΌΜ 0.1652 0.5327 2.7882 0.0144 0.1297 1.2293 -0.0249 0.0986 1.2331
πΎΜ 0.5361 0.9876 3.2818 0.0622 0.1130 1.3017 0.0223 0.1066 1.2834
πΜ 0.2220 0.2733 1.8564 0.0373 0.0498 0.8666 0.0143 0.0467 0.8496
70
πΌΜ 0.0862 0.3858 2.4124 0.0273 0.1211 1.3667 -0.0087 0.0909 1.3696
πΎΜ 0.4629 0.7715 2.9275 0.0265 0.1122 1.3155 -0.0129 0.1052 1.2769
πΜ 0.1734 0.1862 1.5497 0.0250 0.0528 0.9000 0.0066 0.0504 0.8837
100
πΌΜ 0.0816 0.2202 1.8122 0.0488 0.0864 1.1419 0.0155 0.0828 1.1319
πΎΜ 0.2912 0.3959 2.1878 0.0117 0.1049 1.4327 0.0107 0.1152 1.3365
πΜ 0.1328 0.1107 1.1966 0.0493 0.0379 0.7424 0.0343 0.0353 0.7274
150
πΌΜ 0.0738 0.1337 1.4043 0.0096 0.0675 1.2799 0.0092 0.0668 1.2255
πΎΜ 0.1577 0.1904 1.5955 0.0113 0.0969 1.3467 0.0083 0.0918 1.3617
πΜ 0.0745 0.0600 0.9152 -0.0048 0.0343 0.7294 -0.0171 0.0326 0.7081
π = 0.5
MLE SE Linex
π Bias MSE L.C.I Bias MSE L.C.I Bias MSE L.C.I
30
πΌΜ -0.0461 0.8952 3.8234 0.0591 0.1208 1.3495 0.0177 0.1155 1.3371
πΎΜ 0.7347 1.9617 4.6768 0.0790 0.1000 1.2067 0.0477 0.0911 1.1745
πΜ 0.0700 0.1029 1.2276 0.0537 0.0531 0.8825 0.0295 0.0473 0.8493
50
πΌΜ -0.0025 0.7047 3.2924 0.0422 0.0902 1.1714 0.0058 0.0839 1.1411
πΎΜ 0.5112 1.2653 3.9297 0.0705 0.0980 1.2015 0.0361 0.0880 1.1598
70
πΌΜ -0.1594 0.4959 2.6900 0.0305 0.0759 1.0786 -0.0008 0.0702 1.0435
πΎΜ 0.5204 1.0326 3.4231 0.0594 0.0637 0.9667 0.0330 0.0598 0.9550
πΜ 0.0063 0.0355 0.7388 0.0486 0.0298 0.6530 0.0338 0.0275 0.6397
100
πΌΜ 0.0688 0.4579 2.6400 0.0299 0.0583 0.9436 0.0016 0.0553 0.9263
πΎΜ 0.1949 0.4451 2.5025 0.0303 0.0498 0.8715 0.0074 0.0472 0.8558
πΜ 0.0227 0.0238 0.5988 0.0123 0.0138 0.4606 0.0012 0.0131 0.4516
150
πΌΜ 0.0135 0.3511 2.8038 0.0242 0.0460 1.0777 0.0026 0.0409 1.0488
πΎΜ 0.2770 0.5875 2.8029 0.0209 0.0338 0.9820 0.0182 0.0201 0.9552
πΜ 0.0001 0.0165 0.5042 -0.0051 0.0109 0.4114 -0.0129 0.0108 0.4070
For numerical illustration we have computed point estimation and interval estimation for the parameters of WGED, based on 1000 samples using different sample sizes 30, 50, 70, 100 and 150 generated by Monte Carlo simulation technique. A random samples was generated from the WGED for different values of parameters. In order to obtain the optimal censoring scheme for WGED by use different schemes as well as obtain the best scheme, more than one method was used to reach a better scheme with the best method of estimation. The maximum likelihood method and the method of Bayesian estimation for (SE and Linex) loss function have been used.
We note the greater the sample size, the greater the efficiency of the estimator in terms of lower values of MSE, Bias and L.C.I. If the ratio of effective sample sizes (r) increases for censoring sample, then the value of the MSE decreases for the parameters of WGED. The focus is on the output of the small ratio of effective censoring sample sizes, where the rare cases occur, and the small problems of loss. The study confirms the compatibility of the result in large Sampling sizes. The previous results confirm the compatibility of the Bayesian estimation for Linex loss function, which has the lowest of MSE values compared to other estimators, followed by SE loss function and finally the maximum likelihood estimation. scheme III is the best censoring scheme where it has the lowest MSE and the narrower L.C.I.
6. Application of Real Data
We present the numerical results of the parameter estimation of WGED under progressive censoring scheme of a cases of real data. Bader and Priest (1982) discussed the real data set of sample size 69 observed failure times. The data set is represented the strength data measured in GPA, for single carbon fibers and impregnated 1000 carbon fiber tows.
We computed the Kolmogorov-Smirnov (KS) distance between the empirical and the fitted WGED functions.
Table 7: Goodness of Fit Data
D 0.0739
The distance (D) between the fitted and the empirical distribution functions for the data is 0.0739 and the corresponding p-value is 0.8624. Therefore, it indicates that WGED can be fitted to the data set, by use empirical cumulative distribution function (ecdf) to obtain a data graph to confirm the accuracy of the kolmogorov-smirnov test as following.
Graph 5: Kolmogorov-Smirnov Test and the Plot of Max Distance Between Two ecdf Curves
Table 8: Estimation of Coefficient and Stander Deviation for Complete Data
πΌΜ πΎΜ πΜ AIC BIC
Coefficient 38.2650 0.1031 1.9864
117.37 123.56
Std 0.1564 0.0493 0.2121
L.C.I 0.6131 0.1367 0.8313
Table 9: Estimation Parameter of Model under Progressive Censoring Schemes for Real Data
maximum likelihood estimation Bayesian estimation π = 0.2
Schemes πΌΜ πΎΜ πΜ πΌΜ πΎΜ πΜ
I Coef 36.9940 0.1921 2.6025 36.9561 0.2170 2.1334
Std 0. 5506 0.0959 0.6802 0.0723 0.0938 0.4747
II Coef 25.8192 0.5969 3.4788 29.9150 0.4531 2.9458
Std 0.5802 0.3549 0.65308 0.0459 0.2971 0.5852
III Coef 36.9110 0.2451 2.9230 35.8530 0.2032 2.5322
std 0.7509 0.0699 0.5614 0.0721 0.0805 0.5351
π = 0.5
I Coef 34.8864 0.1682 2.0337 36.9008 0.2105 1.6915
Std 0.0974 0.1811 0.3403 0.0847 0.1142 0.3011
II Coef 29.2420 1.1910 2.1363 29.1887 0.8916 2.2584
Std 0.3725 0.5699 0.4892 0.3156 0.2319 0.3454
III Coef 30.1303 1.2445 2.0700 32.2805 0.7148 2.4130
From the results above, we can observe that Bayesian estimation is the best especially with scheme III.
6. Conclusion
In this paper, we discussed the maximum likelihood and Bayesian estimation to estimate parameters problem of the WGED under the progressive type-II censoring schemes. We used MLE and Bayesian estimation under different loss function methods to estimate the unknown parameters for WGED. We obtained the Bayesian estimate based on square error (SE) loss function and Linex loss function under the assumption of independent gamma priors. The performance of the different estimatorβs optimal censoring schemes is compared based on simulation study to determine the optimal censoring schemes by using MSE, the bias and the L.C.I. It is noticeable that the Bayesian estimation is better and more efficient than the maximum likelihood estimation and that scheme III is the best censoring scheme. The application of real data set is used to show how the schemes work in practice. The application affirms that Bayesian estimation is the best especially with scheme III. The results of this paper will be useful for researchers and statisticians where the comprehensive comparison of different sample size and the ratio of effective censoring sample sizes, parameters and censoring schemes, as well as different methods of estimation the most efficient to analyses and exclusively where WGED is used.
References
1. Almetwaly, E. M., & Almongy, H. M. (2018). Bayesian Estimation of the Generalized Power Weibull Distribution Parameters Based On Progressive Censoring Schemes. International Journal of Mathematical Archive EISSN 2229-5046, 9(6).
2. Almetwaly, E. M., & Almongy, H. M. (2018). Estimation of the Generalized Power Weibull Distribution Parameters Using Progressive Censoring Schemes. International Journal of Probability and Statistics, 7(2), 51-61.
3. Amin, A. (2017). Bayesian inference for double seasonal moving average models: A gibbs sampling approach. Pakistan Journal of Statistics and Operation Research, 13(3), 483-499.
4. Bader, M. G., & Priest, A. M. (1982). Statistical aspects of fibre and bundle strength in hybrid composites. Progress in science and engineering of composites, 1129-1136.
5. Balakrishnan, N., & Aggarwala, R. (2000). Progressive censoring: theory, methods, and applications. Springer Science & Business Media.
6. Balakrishnan, N. (2007). Progressive censoring methodology: an appraisal. Test. 7. Balakrishnan, N., Kundu, D., Ng, K. T., & Kannan, N. (2007). Point and interval
estimation for a simple step-stress model with Type-II censoring. Journal of Quality Technology, 39(1), 35-47.ISO 690.
9. Elsherpieny, E. A., Muhammed, H. Z., & Radwan, N. U. M. M. (2017). On Discriminating between Gamma and Log-logistic Distributions in Case of Progressive Type II Censoring. Pakistan Journal of Statistics and Operation Research, 13(1), 157-183.
10. Kim, C., & Han, K. (2009). Estimation of the scale parameter of the Rayleigh distribution under general progressive censoring. Journal of the Korean Statistical Society, 38(3), 239-246.
11. Kundu, D., & Pradhan, B. (2009). Estimating the parameters of the generalized exponential distribution in presence of hybrid censoring. Communications in StatisticsβTheory and Methods, 38(12), 2030-2041.
12. Metropolis, N., Rosenbluth, A. W., Rosenbluth, M. N., Teller, A. H., & Teller, E. (1953). Equation of state calculations by fast computing machines. The journal of chemical physics, 21(6), 1087-1092.
13. Mustafa, A., El-Desouky, B. S., & AL-Garash, S. (2016). Weibull Generalized Exponential Distribution. arXiv preprint arXiv:1606.07378.
14. Mohamed, A. E. R., Abu-Youssef, S. E., Ali, N. S., & El-Raheem, A. A. (2018). Inference on Constant-Stress Accelerated Life Testing Based on Geometric Process for Extension of the Exponential Distribution under Type-II Progressive Censoring. Pakistan Journal of Statistics and Operation Research, 14(2).
15. Nassar, M., Abo-Kasem, O., Zhang, C., & Dey, S. (2018). Analysis of Weibull Distribution Under Adaptive Type-II Progressive Hybrid Censoring Scheme. Journal of the Indian Society for Probability and Statistics, 1-41.