MODELING AS AN ADVERTISING
PROCESS IMPROVEMENT PARADIGM
INVESTIGATING PROCESS MATURITY MODELING AS AN ADVERTISING PROCESS IMPROVEMENT PARADIGM
Dr. Daniel Adrian Doss
University of West Alabama, USA [email protected]
Dr. Russ Henley
University of West Alabama, USA [email protected]
Qiuqi Hong, MBA
Guangzhou College of Technology and Business, International Educational College, Guangdzu, Guangdong, China
Trey Pickett, MBA
University of West Alabama, USA [email protected]
DOI: 10.2478/minib-2019-0028
This article examined a variant of the Capability Maturity Model integrated (CMMi) through the lens of advertising process improvement. The population and sample were taken from a national array of U.S. marketing organizations. Using ANOVA, a 0.05 significance level, and a stratification of service marketing organizations versus product marketing organizations, the study showed a statistically significant difference (F(1, 304) = 4.03; p= 0.04; ω2= 0.00) regarding the hypothesis representing the notion that processes were potentially sporadic, chaotic, and ad hoc. This notion corresponded to the first maturity level of the examined process maturity framework. With respect to the Likert-scale data representing the first maturity level, the successive means analysis showed that both service marketing firms (M= 2.99) and product marketing firms (M = 2.74) reported neutrality regarding whether processes were deemed sporadic, chaotic, and ad hoc. Thus, the respondents perceived no evidence of the first maturity level among the queried work settings. Future studies may examine different stratifications of marketing firms (e.g., for-profit versus non-profit; domestic versus international; and so on) to better explore the proposed advertising maturity model.
Summary
Introduction
Bagad (2008) indicated that marketing was a process whereby goods transited from being concepts to their eventual consumption among markets as a means of satisfying human needs and wants. Bagad (2008, p. 410) also indicated that marketing was defined as, "the process of planning and executing the conception, pricing, promotion, and distribution of ideas, goods and services to create exchanges that satisfy individual and organizational objectives." Successfully implementing marketing processes and activities involves some aspects of advertising in order to present messages among audiences (Stewart & Gugel, 2016). Advertising is a subset of marketing that involves processes whereby messages and concepts are conveyed to audiences (Moriarity, et al., 2012). Although processes exist whereby marketing and advertising activities occur, no guarantees exist that the implemented processes are mature, optimized, or efficient (Pickett, 2016).
Management science includes resource optimization methods (Du, 2012). By studying methods to improve the processes of an organization, executives and leaders can generate enhancements of effectiveness and efficiency (Kennett & Baker, 2010). Without process improvement, organizations will execute processes without knowing how well they are performing or how they could improve their processes (Pickett, 2016). To implement processes improvement within an organizations, administrators and leaders need to examine a plethora of models and controls to manage, compare, examine, improve, and regulate the performance of their company's individual operations (Pickett, 2016). Without performance evaluation of processes, a company's progression moving forward will be highly unlikely (Pickett, 2016). In the advertising field, the ideas of performance evaluation and process are keys to achieving the goal of advertising: maximizing awareness of the information that is advertised to a group of individuals (Lavidge & Steiner, 1961). If advertising agencies are not performing well, their clients have less chance of producing higher revenues and improving their company's image (Pickett, 2016).
expectations (Pickett, 2016). Management within these organizations must consider a wide variety of measurement instruments and methods for evaluating advertising processes and determining which decisions to make to better pursue future endeavors (Pickett, 2016). Examples of such paradigms have included the Defining Advertising Goals for Measured Advertising Results model (Colley, 1984), the Foote, Cone, & Belding strategy matrix (Vaughn, 1980), the evaluation methods of benchmarking for process improvement in relation to goals and standards, (Broderick, Garry, & Beasley, 2010), an adaptive Total Quality Management model for facilitation of services (Ghosh & Ling, 1994), the Six-sigma method of function improvement (Drake, Sutterfield, & Ngassam, 2008), and restructuring of advertising processes through business process reengineering (Teng, Grover, & Fiedler, 1994).
The reviewed literature showed that the process evaluation methods provided ample opportunities for advertising agencies to examine their strategies and process, but their approaches did not incorporate process maturity as foundational premises. Despite numerous discussions of traditional quality approaches, the reviewed marketing and advertising literature showed an absence of any progressive, maturity-based paradigm for the improving of advertising processes. However, within the software and management science bodies of literature, the concept of process maturity modeling existed as a method of sequentially improving processes through time (Carcary, 2013). Given these notions, this study examined the potential of adapting process maturity modeling as an advertising process improvement paradigm.
Framework
determine their progress through time. The software Capability Maturity Model (CMM) resulted from the SEI's research initiatives, and was published in 1991 (Paulk, 2009).
Later, another framework, deemed the Capability Maturity Model integrated (CMMi), emerged as a successor to the initial CMM (Mutafelija & Stromberg, 2009). The CMMi addressed primary areas involving the developing of services and products, establishing and managing services, and product and service acquisition (Mutafelija & Stromberg, 2009). The CMMi emphasized five progressive, sequential levels of process maturity that ranged from an immature state exhibiting ad hoc, random processes to a mature state that reflected high levels of efficiency and optimization (Chaudhary & Chopra, 2016). A brief description of each of the five levels of the primary maturity model framework are listed below (Chaudhary & Chopra, 2016):
Level 1: processes are potentially sporadic, chaotic, and ad hoc Level 2: processes are reoccurring and reactive
Level 3: processes are characterized and expressed
Level 4: processes are measured, contained, and investigated quantitatively Level 5: processes are optimized
Overall, the sequential levels of the CMMi provide administrators and leaders of an organization with a process maturity framework for the progressive maturing and improving of processes. The process improvement paradigm offers a method of improving administrative processes from the original state of chaos to culminate in a final, optimized state (Pickett, 2016). The basic architecture and framework of the maturity model concept have shown the potential of adaptability across multiple domains (Cukier & Kon, 2018). Process maturity modeling may be used as a form of process improvement among businesses and organizations (Lockamy & McCormack, 2004).
enhanced quality or for satisfying any new benchmarks or standards. Examples of process improvement benefits included greater predictability of schedules and budgets; enhanced cycle times; improved productivity and quality; better customer satisfaction; improved morale of personnel; and improved financial returns (Demir, & Kocabas, 2010). Slaughter, Harter, and Krishnan (1998) also cited cost savings as an organizational benefit.
Historical adaptation of maturity model derivatives contributed toward similar enhancements among a variety of organizations. Since its establishment, a variety of derivative maturity model constructs were derived from the basic maturity model framework. Examples of derivative forms of the basic maturity model framework included project management (Crawford, 2014; Kwak & Ibbs, 2002), industrial settings (Doss, 2004), safety (Bahr, 2014), logistics (Battista, & Massimiliano, 2013), information technology (Kyoo-Sung & Park, 2013), innovation processes (Corsi & Neau, 2015), software (Cukier & Kon, 2018), people (Wademan, Spuches, & Doughty, 2008), teams (Friedrich, 2017), industrial management (Doss, et al., 2017), cyber security (Vacca, 2013), human capital (Curtis, Hefley, & Miller, 2010), software quality (Daughtrey, 2002), criminal justice (Doss, 2014), information security (Shah & Yeoh, 2018), project risk (Hopkinson, 2017), environmental management (Doss, et al., 2017), innovation (Esterhuizen, et al., 2012), safety (Foster & Hoult, 2013), education (Duarte & Martins, 2013), finance (Doss, Chen, & Holland, 2008), business processes (Fisher, 2004), supply chains (Lockamy & McCormack, 2004); and marketing and advertising (Pickett, 2016).
initiative; and urban versus rural marketing organizations. Despite a trio of views of the proposed advertising maturity model, Pickett (2016) lacked any consideration of the stratification involving the perceptions of personnel among service marketing firms versus product marketing firms. Because of this shortcoming, this study examined the potential of CMMi portability within the context of advertising processes via the lens of personnel perceptions gleaned from service marketing and product marketing organizations.
Research Questions and Hypotheses
The primary research question for this study was as follows: Can the maturity framework of the Capability Maturity Model integrated be adapted to create a process improvement maturity model for advertising processes? For this study, six hypotheses were developed to examine the CMMi construct and its individual maturity levels. The hypothesis statements for this study were as follows:
H0,1: No difference exists between the personnel perceptions of service
marketing organizations versus product marketing organizations regarding the notion that evidence of the overall CMMi framework exists among administrative marketing processes.
H0,2: No difference exists between the personnel perceptions of service
marketing organizations versus product marketing organizations regarding the notion that evidence of the first maturity level exists among administrative marketing processes.
H0,3: No difference exists between the personnel perceptions of service
marketing organizations versus product marketing organizations regarding the notion that evidence of the second maturity level exists among administrative marketing processes.
H0,4: No difference exists between the personnel perceptions of service
H0,5: No difference exists between the personnel perceptions of service marketing organizations versus product marketing organizations regarding the notion that evidence of the fourth maturity level exists among administrative marketing processes.
H0,6: No difference exists between the personnel perceptions of service
marketing organizations versus product marketing organizations regarding the notion that evidence of the fifth maturity level exists among administrative marketing processes.
The potential of bias to affect the study was considered from the perspective of geographic distribution of surveys. The Chi-Square method was used to investigate the potential of bias. The corresponding null hypothesis for investigating the distribution of disseminated surveys versus the distribution of returned surveys was as follows:
H0,7: No difference exists between the distribution of disseminated surveys versus the distribution of returned surveys.
Design and Methodology
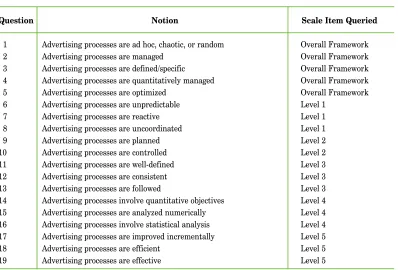
Table 1.Survey Inquiries
Question Notion Scale Item Queried
1 Advertising processes are ad hoc, chaotic, or random Overall Framework
2 Advertising processes are managed Overall Framework
3 Advertising processes are defined/specific Overall Framework 4 Advertising processes are quantitatively managed Overall Framework
5 Advertising processes are optimized Overall Framework
6 Advertising processes are unpredictable Level 1
7 Advertising processes are reactive Level 1
8 Advertising processes are uncoordinated Level 1
9 Advertising processes are planned Level 2
10 Advertising processes are controlled Level 2
11 Advertising processes are well-defined Level 3
12 Advertising processes are consistent Level 3
13 Advertising processes are followed Level 3
14 Advertising processes involve quantitative objectives Level 4 15 Advertising processes are analyzed numerically Level 4 16 Advertising processes involve statistical analysis Level 4 17 Advertising processes are improved incrementally Level 5
18 Advertising processes are efficient Level 5
19 Advertising processes are effective Level 5
An analysis of the means occurred to determine whether responses showed overall agreement, neutrality, or disagreement with the presented notions. Ranges used to judge response directionality were as follows:
z A mean less than 2.5 yielded an overall view of disagreement
z A mean between 2.5 and 3.5 yielded an overall view of neutrality
z A mean larger than 3.5 yielded an overall view of agreement
occurred through the use of an online survey accessible via the Internet. The respondent organizations were classified as ether dominantly services or product marketing entities. Respondents self-reported their respective categories.
Regarding a 95% confidence level and a 5% margin of error, the sample size calculation revealed that a mandatory quantity of 86 responses was necessary for ensuring representativeness. Respondents were identified as individuals who crafted or influenced process design or those who had some involvement with process implementation. Essentially, respondents represented personnel who possessed some experience or knowledge of organizational processes. The survey did not identify specific individuals to collect data. Instead, surveys were disseminated to respondents via position titles (e.g., marketing director, marketing analyst, and so on).
The analytical methods used for data analysis in this research included the analysis of variance (ANOVA) method for examining respondent group differences, the Cronbach method for examining reliability, the Omega-Square method for examining effect size, the Chi-Square method for examining response bias potential, and descriptive statistics. The ANOVA method was used to examine the stratification of product marketing versus service marketing organizations with respect to a 0.05 significance level and p-value testing. Thus, the independent variable consisted of organizational type (service or product) whereas the dependent variable represented process maturity perception.
Findings
After three survey iterations, a total of 103 usable survey responses was obtained from the queried organizations thereby surpassing the mandatory sample size of 86 responses. Thus, some amount of representativeness existed within the study. Approximately 68.6% of the respondents indicated existence as a service advertising firm whereas 31.4% indicated a product advertising entity.
Regarding bias potential, the Chi-Squared analysis outcome showed significance, χ2(1, N = 115) = 0,00, p < 0,05. Thus, the potential of bias
within the study cannot be discounted. Bias potential was examined with respect to geographic survey distribution. Overall, the Cronbach's alpha value was 0.851 thereby signifying high reliability.
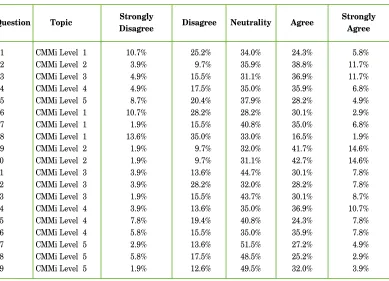
Table 2.Survey Response Percentages
Question Topic Strongly Disagree Neutrality Agree Strongly
Disagree Agree
1 CMMi Level 1 10.7% 25.2% 34.0% 24.3% 5.8%
2 CMMi Level 2 3.9% 9.7% 35.9% 38.8% 11.7%
3 CMMi Level 3 4.9% 15.5% 31.1% 36.9% 11.7%
4 CMMi Level 4 4.9% 17.5% 35.0% 35.9% 6.8%
5 CMMi Level 5 8.7% 20.4% 37.9% 28.2% 4.9%
6 CMMi Level 1 10.7% 28.2% 28.2% 30.1% 2.9%
7 CMMi Level 1 1.9% 15.5% 40.8% 35.0% 6.8%
8 CMMi Level 1 13.6% 35.0% 33.0% 16.5% 1.9%
9 CMMi Level 2 1.9% 9.7% 32.0% 41.7% 14.6%
10 CMMi Level 2 1.9% 9.7% 31.1% 42.7% 14.6%
11 CMMi Level 3 3.9% 13.6% 44.7% 30.1% 7.8%
12 CMMi Level 3 3.9% 28.2% 32.0% 28.2% 7.8%
13 CMMi Level 3 1.9% 15.5% 43.7% 30.1% 8.7%
14 CMMi Level 4 3.9% 13.6% 35.0% 36.9% 10.7%
15 CMMi Level 4 7.8% 19.4% 40.8% 24.3% 7.8%
16 CMMi Level 4 5.8% 15.5% 35.0% 35.9% 7.8%
17 CMMi Level 5 2.9% 13.6% 51.5% 27.2% 4.9%
18 CMMi Level 5 5.8% 17.5% 48.5% 25.2% 2.9%
Table 2 shows the distribution of individual question responses for each respective CMMi process maturity levels, process management characteristics, policy characteristics, process training characteristics, and organizational management characteristics.
Means Analyses
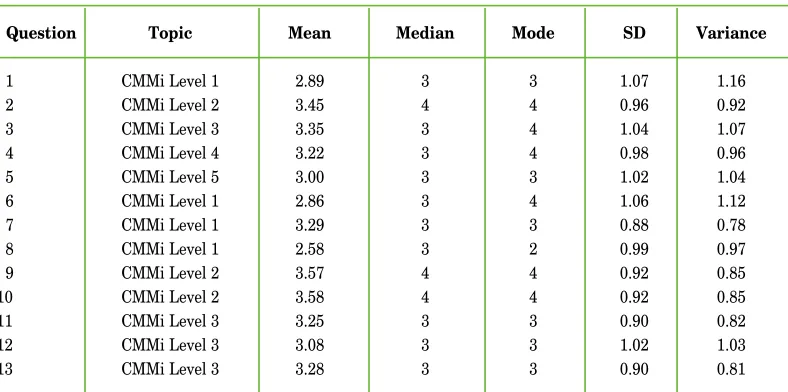
Regarding individual questions, respondents indicated neutrality regarding survey items 1 through 8 and neutrality regarding survey items 11 through 19. Agreement was shown regarding items 9 and 10. Question 9 queried whether respondents perceived that workplace advertising processes were planned. Question 10 queried whether respondents perceived that workplace advertising processes were controlled. Table 3 shows the corresponding descriptive statistics (measures of central tendency and dispersion) for responses to the survey questions.
Table 3.Survey Descriptive Statistics
Question Topic Mean Median Mode SD Variance
1 CMMi Level 1 2.89 3 3 1.07 1.16
2 CMMi Level 2 3.45 4 4 0.96 0.92
3 CMMi Level 3 3.35 3 4 1.04 1.07
4 CMMi Level 4 3.22 3 4 0.98 0.96
5 CMMi Level 5 3.00 3 3 1.02 1.04
6 CMMi Level 1 2.86 3 4 1.06 1.12
7 CMMi Level 1 3.29 3 3 0.88 0.78
8 CMMi Level 1 2.58 3 2 0.99 0.97
9 CMMi Level 2 3.57 4 4 0.92 0.85
10 CMMi Level 2 3.58 4 4 0.92 0.85
11 CMMi Level 3 3.25 3 3 0.90 0.82
12 CMMi Level 3 3.08 3 3 1.02 1.03
Cont. table 3
Question Topic Mean Median Mode SD Variance
14 CMMi Level 4 3.36 3 4 0.98 0.96
15 CMMi Level 4 3.05 3 3 1.03 1.07
16 CMMi Level 4 3.24 3 4 1.00 1.01
17 CMMi Level 5 3.17 3 3 0.83 0.69
18 CMMi Level 5 3.02 3 3 0.89 0.78
19 CMMi Level 5 3.23 3 3 0.79 0.63
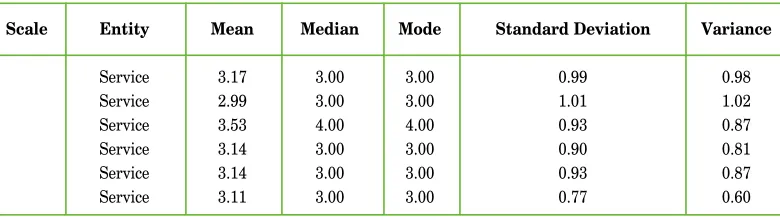
Service Marketing Organizational Means
Regarding the examined scales, service marketing organizations indicated neutrality of perceptions for scales 1, 2, 4, 5, and 6. Agreement was shown regarding only scale 3. In other words, service organization respondents showed neutrality regarding perceived evidence of the first, third, fourth, and fifth maturity levels. Service organization respondents showed agreement regarding perceived evidence of the second maturity level. Table 4 shows descriptive statistics for the question scales corresponding to service marketing organizations.
Table 4.Service Marketing Organization Scale Statistics
Scale Entity Mean Median Mode Standard Deviation Variance
1 Service 3.17 3.00 3.00 0.99 0.98
2 Service 2.99 3.00 3.00 1.01 1.02
3 Service 3.53 4.00 4.00 0.93 0.87
4 Service 3.14 3.00 3.00 0.90 0.81
5 Service 3.14 3.00 3.00 0.93 0.87
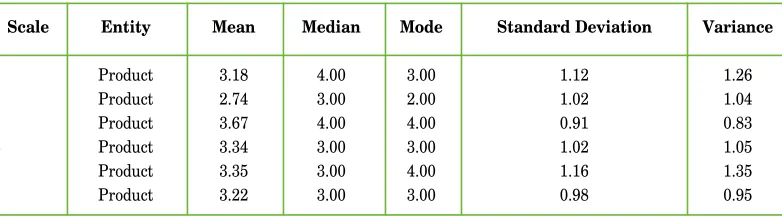
Product Marketing Organizational Means
Regarding the examined scales, product marketing organizations indicated neutrality of perceptions for scales 1, 2, 4, 5, and 6. Agreement was shown regarding only scale 3. In other words, product organization respondents showed neutrality regarding perceived evidence of the first, third, fourth, and fifth maturity levels. Product organization respondents showed agreement regarding perceived evidence of the second maturity level. Table 5 shows descriptive statistics for the questions scales corresponding to product marketing organizations.
Table 5.Product Marketing Organization Scale Statistics
Scale Entity Mean Median Mode Standard Deviation Variance
1 Product 3.18 4.00 3.00 1.12 1.26
2 Product 2.74 3.00 2.00 1.02 1.04
3 Product 3.67 4.00 4.00 0.91 0.83
4 Product 3.34 3.00 3.00 1.02 1.05
5 Product 3.35 3.00 4.00 1.16 1.35
6 Product 3.22 3.00 3.00 0.98 0.95
Cumulative Organizational Means
Table 6.Cumulative Organization Scale Statistics
Scale Entity Mean Median Mode Standard Deviation Variance
1 Cumulative 3.17 3.00 3.00 1.04 1.08
2 Cumulative 2.91 3.00 3.00 1.02 1.04
3 Cumulative 3.57 4.00 4.00 0.93 0.86
4 Cumulative 3.21 3.00 3.00 0.94 0.89
5 Cumulative 3.20 3.00 3.00 1.01 1.02
6 Cumulative 3.15 3.00 3.00 0.84 0.71
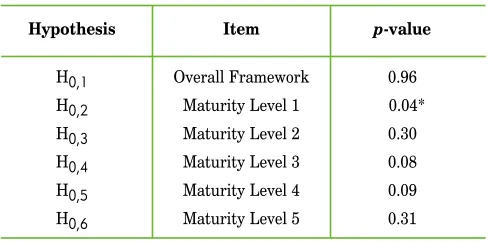
Hypothesis Testing Findings
Hypothesis testing occurred through the use of ANOVA and p-value methods incorporating a 0.05 significance level. Only one of the six tested hypotheses showed statistical significance. The statistically significant outcome represented the second hypothesis. It stated that no difference existed between the personnel perceptions of service marketing organizations versus product marketing organizations regarding the notion that evidence of the first maturity level existed among administrative marketing processes. Table 7 shows each of the hypothesis testing outcomes.
Table 7.Hypothesis Testing Outcomes
Hypothesis Item p-value
H0,1 Overall Framework 0.96
H0,2 Maturity Level 1 0.04*
H0,3 Maturity Level 2 0.30
H0,4 Maturity Level 3 0.08
H0,5 Maturity Level 4 0.09
H0,6 Maturity Level 5 0.31
Findings of the First Hypothesis
The first hypothesis, H0,1, examined perceptions of the overall maturity framework. The hypothesis testing revealed no statistically significant difference between the perceptions of personnel representing service marketing and product marketing organizations. Thus, the null hypothesis was retained. Essentially, no difference was perceived to exist between the personnel opinions of service marketing organizations versus product marketing organizations regarding the notion that evidence of the overall CMMi framework existed among administrative marketing processes. With respect to this notion, analyses of the means showed that
service marketing organizations tended toward neutrality (M = 3.17),
product marketing organizations tended toward neutrality (M = 3.18),
and that the cumulative directionality was neutrality (M = 3.17). Given
neutrality reported by both factions, the means analyses showed that respondents failed to perceive evidence of the overall maturity model construct.
Findings of the Second Hypothesis
The second hypothesis, H0,2, examined perceptions of the first maturity level. Regarding H0,2, the hypothesis testing showed a significant effect of organizational type (service or product entity) on process maturity perception at the p< 0.05 level for the two examined conditions of service
marketing and product marketing organizations [F(1, 3.04) = 4.03, p =
0.04, ω2 = 0.00].The statistically significant outcome corresponded to the
first maturity level of the examined framework representing ad hoc, random processes. Analyzing the corresponding means showed that service marketing organizations tended toward neutrality (M= 2.99), and that the
cumulative directionality was neutrality (M = 2.91). Given neutrality
Findings of the Third Hypothesis
The third hypothesis, H0,3, examined perceptions of the second
maturity level. The hypothesis testing revealed no statistically significant difference between the perceptions of personnel representing service marketing and product marketing organizations. Thus, the null hypothesis was retained. Essentially, no difference existed between the personnel perceptions of service marketing organizations versus product marketing organizations regarding the notion that evidence of the second maturity level existed among administrative marketing processes. With respect to this notion, analyses of the means showed that service
marketing organizations tended toward agreement (M = 3.53), product
marketing organizations tended toward agreement (M = 3.67), and that
the cumulative directionality was agreement (M= 3.57). Given agreement
reported by both factions, the means analyses showed that respondents perceived evidence of the second maturity level. In other words, respondents perceived that work setting processes were reoccurring and reactive.
Findings of the Fourth Hypothesis
The fourth hypothesis, H0,4, examined perceptions of the third
maturity level. The hypothesis testing revealed no statistically significant difference between the perceptions of personnel representing service marketing and product marketing organizations. Thus, the null hypothesis was retained. Essentially, no difference existed between the personnel perceptions of service marketing organizations versus product marketing organizations regarding the notion that evidence of the third maturity level existed among administrative marketing processes. With respect to this notion, analyses of the means showed that service marketing organizations
tended toward neutrality (M = 3.14), product marketing
cumulative directionality was neutrality (M = 3.21). Given neutrality reported by both factions, the means analyses showed that respondents failed to perceive evidence of the third maturity level. In other words, respondents perceived no evidence that advertising processes were characterized and expressed among the queried work settings.
Findings of the Fifth Hypothesis
The fifth hypothesis, H0,5, examined perceptions of the fourth maturity level. The hypothesis testing revealed no statistically significant difference between the perceptions of personnel representing service marketing and product marketing organizations. Thus, the null hypothesis was retained. Essentially, no difference existed between the personnel perceptions of service marketing organizations versus product marketing organizations regarding the notion that evidence of the fourth maturity level existed among administrative marketing processes. With respect to this notion, analyses of the means showed that service
marketing organizations tended toward neutrality (M = 3.14), product
marketing organizations tended toward neutrality (M = 3.35), and that
the cumulative directionality was neutrality (M= 3.20). Given neutrality
reported by both factions, the means analyses showed that respondents failed to perceive evidence of the fourth maturity level. In other words, respondents perceived no evidence that advertising processes were measured, contained, and investigated quantitatively among the queried work settings.
Findings of the Sixth Hypothesis
product marketing organizations. Thus, the null hypothesis was retained. Essentially, no difference existed between the personnel perceptions of service marketing organizations versus product marketing organizations regarding the notion that evidence of the fifth maturity level existed among administrative marketing processes. With respect to this notion, analyses of the means showed that service marketing organizations tended
toward neutrality (M = 3.11), product marketing organizations tended
toward neutrality (M = 3.22), and that the cumulative directionality was
neutrality (M = 3.15). Given neutrality reported by both factions, the
means analyses showed that respondents failed to perceive evidence of the fifth maturity level. In other words, respondents perceived no evidence that advertising processes were optimized among the queried work settings.
Conclusions and Recommendations
The concept of a maturity modeling framework originated in the software industry as an organizational process improvement paradigm through which businesses could mature and optimize their processes. Since its inception in the late 1980s, numerous variants of the basic framework were crafted to address and facilitate process improvement in a variety of business domains that were unrelated to the software industry, ranging from safety to education. Such variants showed the transferability of the framework across unassociated domains. Given the history of successful transferability and portability of the maturity modeling framework, this study examined the potential of adapting the maturity model framework within the context of advertising processes (i.e., advertising maturity model).
processes are chaotic, random entities within the first process maturity level. Not all organizations are identical; all are unique with respect in which they perform processes involving advertising initiatives and endeavors. Some organizations may exhibit formal, standardized processes whereas others exhibit less structured processes. Therefore, some respondents may have perceived their respective advertising process setting as lacking randomness, and exhibiting structure and formal processes. In other cases, it may have been possible for respondents to have perceived processes as lax or informal. Regardless, from a cumulative lens, respondents showed neutrality regarding their perceptions of whether evidence existed reflective of the first maturity level among their work settings.
The cumulative means analyses showed neutrality with respect to perceptions of the first, third, fourth, and fifth maturity levels. These maturity levels corresponded to sporadic, chaotic, and ad hoc processes (level 1); characterized and expressed processes (level 3); measured, contained, and investigated quantitatively (level 4); and optimized processes (level 5). Respondents showed perceptions of agreement regarding evidence of the second maturity level among workplace advertising processes. Level 2 corresponded to reoccurring and reactive processes. Therefore, given the neutral responses coupled with a solitary agreement response, with respect to examining the individual maturity model phases comprising the overall framework, the outcomes of this study failed to show conclusively the adaptability potential of the examined maturity model framework within the context of advertising processes.
process maturity modeling that may generate practical and operational benefits.
Although this study examined a stratification of service versus product marketing organizations, no delineation occurred to specify whether the specific products or services were virtual entities instead of those found in physical reality. Opportunity exists to explore the process environments of marketing organizations whose functions are virtual. Thus, future studies may examine the potential of crafting a marketing and advertising process improvement maturity model within the context of the virtual domain.
Additional consideration of maturity modeling may be given to the primary components of marketing: product, promotion, price, and placement. The advertising maturity model herein was constrained solely to administrative processes among marketing organizations without consideration of the primary areas of product, promotion, price, and placement. Given this notion, future studies may examine derivatives of maturity model frameworks representing improvement paradigms for product processes, promotion processes, price processes, and placement processes.
This study lacked any organizational consideration of profit-based versus non-profit marketing organizations. Future studies may investigate the proposed advertising maturity model from the perspective of organizational status. In doing so, additional studies may incorporate a stratification of profit versus non-profit marketing and advertising houses.
The potential of geographic or regional biases may have affected this study because it was constrained to the views of marketing firms only within the United States. Future studies may explore personnel perceptions of the proposed advertising maturity model among international marketing houses. Additionally, future studies may also explore the perceptions of employees representing domestic versus foreign organizations.
across all of the individual maturity levels, it represented a starting point for examining how process maturity modeling may be adapted from the software domain to the marketing domain. Given this notion, future research endeavors may examine different stratifications, such as managers and non-managers among marketing firms; urban versus rural marketing firms; and so forth. In any case, despite the necessity of examining this study with a grain of salt, it highlighted a framework that may be the subject of additional enquiry.
Bibliography
1. Bagad, V. S. (2008). Management science. Pune, Indie: Technical Publications Pune. 2. Bahr, N. J. (2014). System safety engineering and risk assessment: A practical approach.
(2nd ed.). Boca Raton, FL: CRC Press.
3. Battista, C. & Massimiliano, M. S. (2013). The logistic maturity model: Application to a fashion company. International Journal of Engineering Business Management, 5, 1–11.
4. Broderick, A., Garry, T., & Beasley, M. (2010). The need for adaptive processes of bench-marking in small business-to-business services. The Journal of Business & Industrial Marketing, 25(5), 324–337.
5. Carcary, M. (2013). IT risk management: A Capability Maturity Model perspective. Elec-tronic Journal of Information Systems Evaluation, 16(1), 3–13.
6. Chaudhary, M. & Chopra, A. (2016). CMMi for Development: Implementation Guide. New York, NY: Apress Publishing.
7. Colley, R. H. (1984). Defining advertising goals for measured results. New York, NY: As-sociation of National Advertisers.
8. Corsi, P. & Neau, E. (2015). Innovation Capability Maturity Model. Hoboken, NJ: Wiley. 9. Crawford, J. K. (2014). Project management maturity model. (3rd ed.). Boca Raton, FL:
CRC Press.
10. Cukier, D., & Kon, F. (2018). A maturity model for software startup ecosystems. Jour-nal of Innovation and Entrepreneurship, 7(14), 23.
11. Curtis, B., Hefley, W., & Miller, S. (2010). People CMM: A framework for human capital management. (2nd). Boston, MA: Pearson.
12. Daughtrey, T. (2002). Fundamental concepts for the software quality engineer. Milwau-kee, WI: ASQ Press.
14. Doss, D. (2014). The capability maturity model as a criminal justice process improvement paradigm. Pretoria, Republika Południowej Afryki: University of South Africa.
15. Doss, D. (2004). An investigation of adapting the software capability maturity model ar-chitecture and framework within traditional industrial environments. Prescott, AZ: Nor-thcentral University.
16. Doss, D. A., Chen, C., & Holland, L. (2008). A proposed variation of the Capability Ma-turity Model framework among financial management settings. Proceedings of the Aca-demy of Accounting and Financial Studies, 13(1), 15.
17. Doss, D., Goza, R., Tesiero, R., Gokaraju, B., & McElreath, D. (2017). The Capability Ma-turity Model as an industrial process improvement model. Manufacturing Science and Technology, 4(2), 17–24.
18. Doss, D., Tesiero, R., Gokaraju, B., McElreath, D., & Goza, R. (2017). Proposed deriva-tion of the Integrated Capability Maturity Model as an environmental maturity model. Energy and Environmental Engineering, 5(3), 67–73.
19. Drake, D., Sutterfield, J. S., & Ngassam, C. (2008). The revolution of six-sigma: An ana-lysis of its theory and application. Academy of Information and Management Sciences Jo-urnal, 11(1), 29–44.
20. Du, W. (2012). Informatics and management science IV. London, UK: Springer. 21. Duarte, D. & Martins, P. V. (2013) A maturity model for higher education institutions.
Journal of Spatial and Organizational Dynamics, 1(1), 25–45.
22. Esterhuizen, D., Schutte, C., & Du Toit, A. (2012). A knowledge management framework to grow innovation capability maturity. South African Journal of Information Manage-ment, 14(1), 1–10.
23. Fisher, D. M. (2004). The Business Process Maturity Model: A practical approach for identifying opportunities for optimization. BP Trends, 9, 1–7.
24. Foster, P. & Hoult, S. (2013). The safety journey: Using a Safety Maturity Model for sa-fety planning and assurance in the UK coal mining industry. Minerals, 3, 59–72. 25. Friedrich, R. (2017). The virtual team maturity model: Performance improvement of
vir-tual teams. Wiesbaden, Niemcy: Springer.
26. Ghosh, B. C., & Ling, M. T. (1994). Total Quality Management in services: The case of Singapore's advertising industry. The TQM Magazine, 6(4), 34.
27. Hopkinson, M. (2017). The project risk maturity model: Measuring and improving risk management capability. Aldershot, UK: Gower Publishing.
28. Kennett, R. S. & Baker, E. (2010). Process improvement and CMMi for systems and so-ftware. Boca Raton, FL: CRC Press.
29. Kwak, Y. H. & Ibbs, W. (2002). Project Management Process Maturity (PM) 2 Model. Jo-urnal of Management in Engineering, 7, 150–155.
30. Kyoo-Sung, N. & Park, S. (2013). Measures for e-learning policy effectiveness improve-ment through analysis of maturity of Korean policy application. Journal of Digital Co-nvergence, 11(12), 11–19.
32. Lockamy, A. & McCormack, K. (2004). The development of a supply chain management process maturity model using the concepts of business process orientation. Supply Cha-in Management: An International Journal, 9(4), 272–278.
33. Moriarity, S., Mitchell, N. D., Wells, W. D., Crawford, R., Brennan, L., & Spence-Stone, R. (2012). Advertising: Principles and practice. (3rd ed.). Melbourne, Australia: Pearson Australia.
34. Mutafelija, B. & Stromberg, H. (2009). Process improvement with CMMi v1.2 and ISO standards. Boca Raton, FL: CRC Press.
35. Paulk, M. (2009). A history of the capability maturity model. Retrieved from https: //pdfs.semanticscholar.org/6fb0/c324e08698a9e364693151605a74982b487a.pdf
36. Pickett, T. (2016). The Capability Maturity Model as an advertising process maturity pa-radigm. Livingston, AL: University of West Alabama.
37. Shah, M. & Yeoh, W. (2018). Applying business intelligence initiatives in healthcare and organizational settings. Hershey, PA: IGI Global.
38. Slaughter, S., Harter, D., & Krishnan, M. S. (1998). Evaluating the cost of software qu-ality. Communications of the ACM, 41(8), 67–73.
39. Stewart, D. W. & Gugel, C. T. (2016). Accountable marketing: Linking marketing actions to financial performance. New York, NY: Routledge.
40. Teng, J. T. C., Grover, V., & Fiedler, K. D. (1994). Business process reengineering: Char-ting a strategic path for the information age. California Management Review, 36(3), 9. 41. Vacca, J. R. (2013). Computer and information security handbook. Waltham, MA:
Mor-gan Kaufman.
42. Vaughn, R. (1980). How advertising works: A planning model. Journal of Advertising Research, 20(5), 27–33.
D
Drr.. DDaanniieell AAddrriiaann DDoossss —— is an associate professor at the University of West Alabama. He possesses a Ph.D. from Jackson State University. His research interests are in the fields of computing, business administration, information systems, marketing, security, and technology.
D
Drr.. RRuussss HHeennlleeyy —— is an associate professor at the University of West Alabama. He possesses a Ph.D. from the University of Alabama. His research interests are in the fields of business administration and marketing.
M
Mrrss.. QQiiuuqqii HHoonngg —— is an instructor at Guangzhou College of Technology and Business. She possesses an MBA from the University of West Alabama. Her research interests are in the fields of business administration and marketing.
M