Atmos. Meas. Tech., 7, 4151–4166, 2014 www.atmos-meas-tech.net/7/4151/2014/ doi:10.5194/amt-7-4151-2014
© Author(s) 2014. CC Attribution 3.0 License.
Performance of high-resolution X-band weather radar networks –
the PATTERN example
K. Lengfeld1, M. Clemens1, H. Münster2, and F. Ament1,2
1Meteorological Institute of the University of Hamburg, Hamburg, Germany 2Max-Planck-Institute for Meteorology, Hamburg, Germany
Correspondence to: K. Lengfeld ([email protected])
Received: 25 July – Published in Atmos. Meas. Tech. Discuss.: 8 August 2014
Revised: 31 October 2014 – Accepted: 31 October 2014 – Published: 5 December 2014
Abstract. This publication intends to prove that a network of low-cost local area weather radars (LAWR) is a reliable and scientifically valuable complement to nationwide radar networks. A network of four LAWRs has been installed in northern Germany within the framework of the Precipitation and Attenuation Estimates from a High-Resolution Weather Radar Network (PATTERN) project observing precipitation with a temporal resolution of 30 s, a range resolution of 60 m and a sampling resolution of 1◦ in the azimuthal di-rection. The network covers an area of 60 km×80 km. In this paper, algorithms used to obtain undisturbed precipita-tion fields from raw reflectivity data are described, and their performance is analysed. In order to correct operationally for background noise in reflectivity measurements, noise level estimates from the measured reflectivity field are combined with noise levels from the last 10 time steps. For detection of non-meteorological echoes, two different kinds of clutter algorithms are applied: single-radar algorithms and network-based algorithms. Besides well-established algorithms network-based on the texture of the logarithmic reflectivity field (TDBZ) or sign changes in the reflectivity gradient (SPIN), the advan-tage of the unique features of the high temporal and spatial resolution of the network is used for clutter detection. Over-all, the network-based clutter algorithm works best with a detection rate of up to 70 %, followed by the classic TDBZ filter using the texture of the logarithmic reflectivity field.
A comparison of a reflectivity field from the PATTERN network with the product from a C-band radar operated by the German Meteorological Service indicates high spatial ac-cordance of both systems in the geographical position of the rain event as well as reflectivity maxima. Long-term statistics from May to September 2013 prove very good accordance of
the X-band radar of the network with C-band radar, but, es-pecially at the border of precipitation events, higher-resolved X-band radar measurements provide more detailed informa-tion on precipitainforma-tion structure because the 1 km range gate of C-band radars is only partially covered with rain. The stan-dard deviation within a range gate of the C-band radar with a range resolution of 1 km is up to 3 dBZ at the borders of rain events. The probability of detection is at least 90 %, the false alarm ratio less than 10 % for both systems. Therefore, a network of high-resolution low-cost LAWRs can give valu-able information on the small-scale structure of rain events in areas of special interest, e.g. urban regions, in addition to the nationwide radar networks.
1 Introduction
Flood forecasting, urban hydrology, hydrometeorological ap-plications and management of risk and uncertainty require high-resolution spatial and temporal rainfall estimates near the ground with less than 0.1 km and 1 min, respectively (Einfalt, 2003). Therefore, radar systems capable of produc-ing reliable and accurate quantitative estimates of precipita-tion at high temporal and spatial resoluprecipita-tion are needed. Rain-fall products of conventional radar systems used in nation-wide or even larger networks are generally based on reflec-tivity measurements at S- or C-band frequencies with a tem-poral resolution of several minutes and a spatial resolution of a few hundred metres.
of the antenna and the wavelength. Therefore, recent studies support observations at X-band frequencies as an alternative or an addition to S- and C-bands (Lengfeld et al., 2013; Tra-bal et al., 2013) to fulfil the requirements of urban drainage system modelling as input for rainfall–runoff models of ru-ral river systems, hydraulic simulations, insurance proof, de-tailed information on extreme events, and many more. Be-sides higher resolution, radars operating at high frequencies benefit from lower costs resulting from smaller antenna size compared to long-wave radars. X-band radars can also de-rive reliable precipitation estimates close to the ground due to their relatively short range. S- or C-band radars mea-sure within a range of hundreds of kilometres. Therefore, they cannot observe rainfall near the ground, because the radar beam increases in height with increasing distance to the radar due to the elevation angle and the Earth’s curva-ture. Measurements taken at a few kilometres in height above the Earth’s surface need to be extrapolated to give an esti-mation of rainfall on the ground. These techniques are lim-ited and imprecise, leading to large uncertainties in estimated reflectivity.
In contrast to long wavelengths, reflectivity measurements at shorter wavelengths, especially at X- and K-bands, are significantly attenuated by liquid water along their paths, where the specific attenuation at any distance depends on the size distribution of raindrops and their extinction cross sec-tion. The magnitude of attenuation is generally inverse to the wavelength, and the specific attenuation at the X-band is approximately 2 orders of magnitude higher than at the S-band, according to Doviak and Zrnic (1993). While the effect of attenuation at the S-band is practically negligi-ble, it becomes increasingly serious as the wavelength is re-duced, and corrections have to be applied to retrieve intrin-sic reflectivity. The baintrin-sics of microwave attenuation by rain have already been discussed by many authors, e.g. Atlas and Banks (1951), Hitschfeld and Bordan (1954), Gunn and East (1954), Wexler and Atlas (1963), Dutton (1967) and Atlas and Ulbrich (1977), to mention the earliest.
To overcome the apparent drawback of strong attenuation at X-band frequencies, several authors introduced concepts of overlapping radar networks consisting of two or more radars. These methods allow for estimation of attenuation and correction of observed reflectivities simultaneously, if at least two radars observe a common volume (Testud and Amayenc, 1989; Kabeche and Testud, 1995; Srivastava and Tian, 1996; Tian and Srivastava, 1997; Chandrasekar and Lim, 2008; Lim et al., 2011). In the last few years, several networks consisting of different types of X-band radars have been installed to fill gaps in nationwide networks of C- or S-band radars, e.g. within the CASA (Collaborative Adap-tive Sensing of the Atmosphere) project (Trabal et al., 2013; Mahale et al., 2014), in complex terrain, or in areas where detailed information on rainfall is of high interest, e.g. near airports (Turso et al., 2009), in mountainous regions (Beck and Bousquet, 2013; Shakti et al., 2013; Ventura and Tabary,
2013) or in flood-prone areas (Matrosov et al., 2013), to name a few of them.
Comparing the existing X-band radar networks, one can distinguish between three different approaches. On the one hand, there are highly sensitive X-band weather radar sys-tems featuring dual polarisation as a standard, with a peak power of about 75 kW and a typical antenna size of 2.5 m in diameter (e.g. Beck and Bousquet, 2013). The maximum range is of the order of 100 km, with a range resolution of 20 m. On the other hand, there is an increasing number of low-cost systems mainly based on conventional nautical radar systems with a peak power of 25 kW (e.g. Trabal et al., 2013; Lengfeld et al., 2012). These systems are charac-terised by small antenna diameters of less than 1 m and, in general, they are not capable of performing measurements in Doppler or dual-polarisation mode. The maximum range of these low-cost radars is of the order of 20 km, with a range resolution similar to the former X-band radar type. Due to their limited range, they are often called local area weather radars (LAWR). These systems can serve as a sort of mag-nifying glass in complementation to C- or S-band radar sys-tems in flood-prone regions or other areas of interest, because they are affordable not only for weather services, but also for local authorities or private companies (10–20 % of the price of dual-polarisation X-band radars). A third approach is systems with a low peak power of 25 kW that perform dual-polarisation measurements with a maximum range of the or-der of 100 km and a range resolution of the oror-der of 250 m (e.g. Barbieri et al., 2014).
K. Lengfeld et al.: The PATTERN example 4153
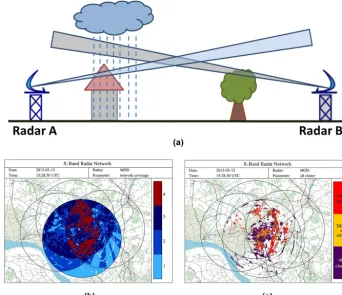
Figure 1. Position of the four network radars: Hungriger Wolf
tower (HWT), Quarnstedt (QNS), Bekmünde (BKM) and Moordorf (MOD) marked in red, the Hamburg radar marked in blue, and their 20 km range. Reference stations OST, MST and WST are marked in green.
estimates near the ground (McLaughlin et al., 2009) in areas far away from C- or S-band radar sites where the radar beam is several hundred metres above the ground.
The aim of this paper is to identify advantages and disad-vantages of the network as well as single X-band radars and present algorithms making use of the network approach and the X-band-specific characteristics. The X-band radars used in this study are described in Sect. 2. It also gives an overview of the design of the network. Section 3 presents the algo-rithms that are applied to raw reflectivity data in order to get reliable reflectivity and precipitation fields. First, algorithms are described that are applied to individual radars, followed by algorithms that use the advantage of having overlapping areas within the network. A comparison with a large-scale C-band radar operated by the German Meteorological Service (DWD) in Sect. 4 gives a first evaluation of the quality of precipitation fields derived from the PATTERN network. In Sect. 5, conclusions are drawn, and Sect. 6 gives an outlook on future work.
2 Radar network
A network of four X-band radars, Hungriger Wolf tower (HWT), Quarnstedt (QNS), Bekmünde (BKM) and Moor-dorf (MOD), has been set up to the north of Hamburg, Ger-many (Fig. 1, Lengfeld et al., 2012), within the framework of the PATTERN project. Each radar has a range of 20 km in
ra-Figure 2. Modified ship navigation radar with parabolic dish (a),
typical radar tower in Quarnstedt (b) and radar at Hungriger Wolf (c).
dius around the site to detect reflectivity. The network spans a region of approximately 60 km×80 km. Two radars are at least 11 km, but not more than 16 km apart. Based on the net-work design, a large area is covered by at least two radars at the border and up to four radars in the centre of the net-work. Therefore, multiple information from different radars is available on reflectivity and attenuation in a certain grid cell. This advantage can be used for clutter detection, gap filling and attenuation estimation. Additionally, micro rain radars (MRR) at each radar site complement the network. These vertically profiling K-band radars measure Doppler spectra of hydrometeors at 31 height levels. From these spec-tra, drop size distributions at each height level and, finally, reflectivity as well as rain-rate profiles are derived (Peters et al., 2005). To calibrate the X-band radars and to evaluate retrieved products, three reference stations (OST, MST and WST in Fig. 1) are set up within the PATTERN area, con-sisting of MRR and rain gauges corrected for wind speed at each site. The whole PATTERN region is covered by a C-band radar operated by the DWD.
The LAWRs used in PATTERN are modified ship navi-gation radars of type GEM scanner SU70-25E with 25 kW transmit power. Corresponding to technical specifications, the modified radars are simple backscatter systems and can-not observe Doppler shift, nor do they perform polarimet-ric measurements. The original fan beam antenna is replaced by a high-gain pencil beam antenna; in order to reduce side lobes, an offset parabolic dish of 0.85 m in diameter is used (Fig. 2a). Antenna and scanning drive are protected by a low-loss radome with air conditioning to avoid condensa-tion within the radome. Due to the cylindrical shape of the radome, water runs off quickly in the case of a rain event, and attenuation due to a wet radome is minimised. Radar control, signal processing and data management is PC based. Techni-cal details on radar systems and scanning schemes are listed in Table 1.
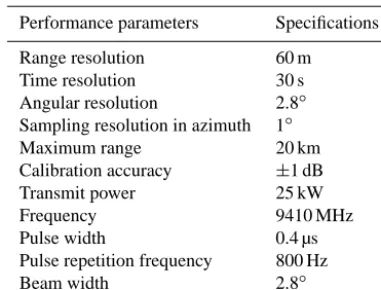
Table 1. LAWR specifications.
Performance parameters Specifications
Range resolution 60 m
Time resolution 30 s
Angular resolution 2.8◦ Sampling resolution in azimuth 1◦
Maximum range 20 km
Calibration accuracy ±1 dB
Transmit power 25 kW
Frequency 9410 MHz
Pulse width 0.4 µs
Pulse repetition frequency 800 Hz
Beam width 2.8◦
Repetition frequency as well as continuous rotation with a speed of about 24 rpm allow for reflectivity measurements with a temporal resolution of 30 s. The beam width of the radar is 2.8◦. Received reflectivities are averaged over a se-quence of transmitted pulses with a sampling resolution of 1◦in the azimuthal direction. Due to the pulse repetition fre-quency of 800 Hz and continuous rotation of the antenna, the average is based on about 5 to 6 pulses per sweep, corre-sponding to 67 pulses per 1◦azimuthal range and an averag-ing interval of 30 s. In comparison, the C-band radar operated by DWD derives reflectivities from only one sweep, with ap-proximately 40 pulses per 1◦azimuth within about 50 ms of the 5 min interval the measurement is valid for. Therefore, the X-band radar benefits from a temporal average over the measuring period, in contrast to a snapshot within the mea-suring period as is derived by the C-band radar. The scanning scheme of the X-band radar is azimuthal only, but fixed ele-vation angles can be adjusted for optimum operation accord-ing to site conditions. For the X-band radars of the PATTERN network, a fixed elevation of approximately 2◦is used.
The standard system installed at the sites consists of the radar mounted on a two-piece steel tower of 10 m in height screwed onto a steel frame on top of a container (Fig. 2b). The complete structure is 16 m high. In demounted state, the station fits into the container, and it can be moved easily. With the exception of HWT, all PATTERN radars are built using this standard installation. Radar HWT is placed on an already existing radar tower at the Hungriger Wolf former military airport (Fig. 2c).
Radars operating in the X-band frequency range benefit from lower costs resulting from smaller antenna size com-pared to long-wave radars. The systems used in this study are simple single-polarised systems that scan horizontally and do not observe Doppler shift. Therefore, they are inexpensive compared to dual-polarised Doppler X-band radars. A radar as it is used in this network costs approximately EUR 60 000 including the data acquisition system and tower construc-tion. This is less than 20 % of conventional X-band radars. The network in this study includes four X-band radars, seven
MRRs and seven rain gauges. It was designed for research purposes and consists of more instruments than necessary for operational precipitation estimation in local areas. In opera-tional use, it is possible to apply common adjustment proce-dures using ground-based precipitation observations by rain gauges or disdrometers. However, a vertical profiling instru-ment such as an MRR provides the opportunity to compare directly observed reflectivity within a common volume. One additional MRR and rain gauge in the area covered by all X-band radars of a network would be sufficient to obtain reliable precipitation data. The overall price of the network depends on the kind of application and the area that should be observed. In complementation to larger-scale radars, e.g. C- or S-band radars, one or two X-band radars can be suffi-cient. Nevertheless, the network-based algorithms presented in this study are designed for networks of at least three X-band radars.
3 Data processing
Weather radars cannot measure precipitation directly; they measure reflectivity from particles along the radar path. Therefore, a raw reflectivity signal not only contains meteorological echoes from precipitation, but also non-meteorological echoes (clutter) and background noise. Be-fore reflectivities are recorded as 30 s averages, disturbances caused by other radars and radio links are effectively elimi-nated by filtering peaks within adjacent pulses: data of a sin-gle pulse at a specific range gate are omitted if it is 2.5 dBZ larger than both the corresponding measurements at the pre-vious and following pulses. This filter suppresses effectively interferences from other X-band sources. The filter is insen-sitive with respect to the selection of the threshold, since the disturbing signals are in general very strong. The value of 2.5 dBZ was determined by analysing raw pulse-to-pulse radar data output and manual detection of artificial signals.
K. Lengfeld et al.: The PATTERN example 4155
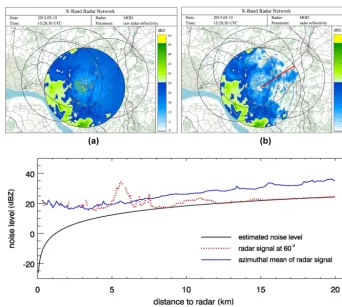
Figure 3. Estimating noise level for radar MOD for 15 May 2013, 15:28:30 UTC: (a) raw reflectivity field, (b) reflectivity field without
background noise, with the red line indicating a 60◦azimuth, and (c) noise level and radar signal as a function of the distance to the radar.
3.1 Noise detection
All reflectivity measurements by radars are affected by noise from internal electrical circuits used in the receiver chain or by atmospheric noise from outside the system. An accurate estimation of the background noise is necessary, especially in the detection of weak weather signals. A detection algorithm based on received signals has to be implemented in the data processing, because the used LAWRs cannot measure the noise level directly. PowerP at the output of the GEM scan-ner SU70-25E system consists mainly of received powerPr due to weather signals and noise powerPN. Received power Prfor distributed weather targets can be expressed as a func-tion dependent on the radar system and physical parameters summarised by the weather radar constantCas
Pr= C·Z
r2 , (1)
which is directly proportional to radar reflectivity factor Z
and inversely proportional to the square of distancer (Skol-nik, 2008). In contrast, the power of background noise PN is independent of the distance to the radar. In a first step, an initial guess of the range-independent noise level from a rain-free field is used to separate assumed meteorologi-cal signals from noise background. This step is performed
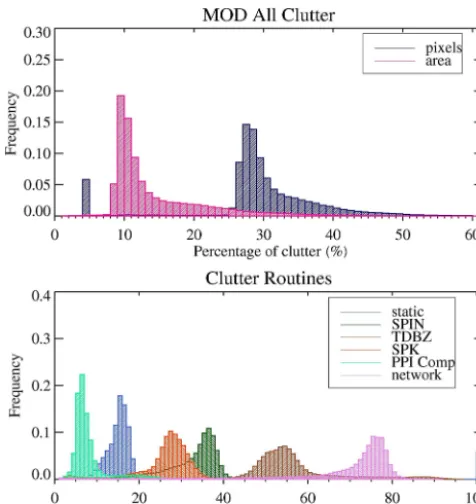
Figure 4. Distribution of clutter for the period from July to
Octo-ber 2013. (a) Histogram of the percentage of all clutter range gates (blue) and the clutter area (magenta). (b) Clutter detected by each algorithm (static clutter map in blue, SPIN filter in green, TDBZ fil-ter in brown, spikes and ring algorithm in orange, time-resolution-based algorithm in blue-green and network-time-resolution-based algorithm in vio-let) in percentage of all clutter range gates.
mean of the radar signal (blue line in Fig. 3c) is always higher than the estimated noise level.
3.2 Clutter detection algorithms
Advanced state-of-the-art methods to identify clutter are based on polarimetric measurements or observations of Doppler shift. The low-cost radars used in this study do not observe these quantities. Therefore, clutter detection is only based on temporal and spatial variability of reflectivity.
Clutter is characterised by high reflectivity values and can be divided into two different types: static and dynamic clut-ter. Static clutter is caused e.g. by trees, houses and natural reliefs, and is present in almost every data set at the same radar range gates. Dynamic clutter is caused by moving ob-jects, e.g. birds and insects, or by other radars operating in the same frequency range (so-called interferences). It varies from time step to time step and from range gate to range gate. A number of correction algorithms are applied to re-flectivity data of the PATTERN network in order to detect and delete clutter and interferences, so that the precipitation signal remains. Each correction algorithm pursues a different approach: some are based on common clutter identification methods for single radars, others use the unique features of high temporal resolution and large overlap of multiple radars
within the network. Many clutter range gates fulfil detection criteria of more than one of these algorithms and are detected by multiple algorithms. Features of other clutter range gates can be detected by only one of the algorithms. In the follow-ing, these algorithms are described in more detail using the exemplary reflectivity field (Fig. 3b), and the performance of each algorithm will be investigated over a 4 month period.
The PATTERN network radar MOD is used exemplarily to investigate the performance of the clutter detection algo-rithms from July to October 2013. Around 30 % of the radar range gates in each radar are classified as clutter by com-bining all detection algorithms (Fig. 4a). Most of the clutter range gates occur close to the radar. Therefore, about 10 % of the area in the radar image is affected. The distribution is skewed to the right. This is due to a few disturbances that cannot be identified by the different clutter and interference detection algorithms, e.g. wide spikes. In Fig. 4b, each algo-rithm is considered separately. Most clutter range gates are identified by multiple algorithms. Therefore, the sum of all algorithms is higher than 100 %. The distribution of each clutter detection algorithm will be discussed in the follow-ing sections. The blue bar at 5 % in Fig. 4a and at 100 % in Fig. 4b corresponds to cases where there were no radar mea-surements and the reflectivity field is empty. In these cases, no clutter detection algorithm is operational but the static clutter algorithm. Therefore, all clutter (100 %) identified in these cases is static clutter, which corresponds to approxi-mately 5 % of all range gates.
All range gates detected as clutter or interference are thresholded and removed after applying all algorithms. Two different approaches were used to fill these gates with infor-mation:
a. For individual radars, data gaps are filled by using an inverse distance weighting interpolation procedure with an area of influence of 50 range bins.
b. In regions covered by multiple radars within the net-work, gaps caused by clutter are filled using the mation of at least one other radar or the averaged infor-mation where more than one radar is available.
3.2.1 Static clutter algorithm
K. Lengfeld et al.: The PATTERN example 4157
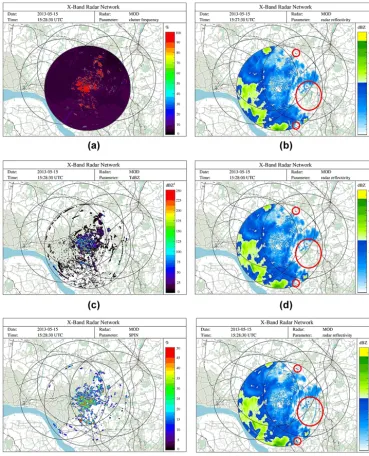
Figure 5. Clutter detection for radar MOD for 15 May 2013, 15:28:30 UTC: (a) static clutter map, (b) TDBZ field, (c) SPIN field. Clutter
detection using previous PPIs: (d) dBZ field for 15:27:30 UTC, (e) dBZ field for 15:28:00 UTC, (f) dBZ field for 15:28:30 UTC.
between static clutter and long-lasting rainfall needs to be made. We assume at least 5 % of the time period of ten days is rain free. Therefore, range gates that exceed the thresh-old in more than 95 % of the 28 800 time steps are marked as static clutter. 14–27 % of the range gates are identified as static clutter for the four network radars. That corresponds to 8–12 % of the area covered, because static clutter primarily occurs in the vicinity of the radar where the radar beam is close to the ground.
The long-term study reveals that for radar MOD, up to 20 % of all clutter range gates is static clutter (Fig. 4b). This
means that around 80 % of the clutter range gates are not static, but are dynamic clutter, and cannot be detected by the clutter map. Therefore, dynamic clutter algorithms need to be applied. In some images, 100 % seems to be static clut-ter. This occurs if there are no measurements for certain time steps and if the other clutter detection algorithms do not op-erate.
3.2.2 Dynamic clutter algorithms for single radars
field and a comparison to the last time steps. First, two com-mon methods for detecting dynamic clutter are used: the texture of the logarithmic reflectivity (TDBZ) field, and the SPIN field (Hubbert et al., 2009). The TDBZ field is com-puted as the average of the squared logarithmic reflectivity difference between adjacent range gates:
TDBZ=
" N X
i
(dBZi−dBZi−1)2 #
/N (2)
where “dBZ” is reflectivity and N is the number of range gates used. If the mean of squared reflectivity difference (Fig. 5b) within five consecutive range gates is higher than 3 dBZ, the range gate is flagged as clutter. If the threshold is set too high, some clutter remains undetected; if it is set too low, small-scale light rain events might falsely be clas-sified as clutter. The threshold of 3 dBZ is based on several case studies to optimise the performance of the algorithm. In order to optimise computing time, the TDBZ field is only cal-culated in the beam direction following Hubbert et al. (2009), and the number of consecutive range gates is limited to five. The SPIN field (Fig. 5c) is a measure of how often the reflectivity gradient changes sign along the radial direction. Two conditions must be fulfilled:
sign{Xi−Xi−1} = −sign{Xi+1−Xi} (3) and
|Xi−Xi−1| + |Xi+1−Xi|
2 > spinthres, (4)
whereXi+1,Xi andXi−1 represent three consecutive dBZ values along a radar radial, and “spinthres” is a reflectivity threshold. The number of sign changes is calculated within a window of 11 range gates around the centre range gate in a radial direction, as suggested by Hubbert et al. (2009). The reflectivity threshold is set to 5 dBZ in Hubbert et al. (2009). Nevertheless, in several case studies, a threshold of 3 dBZ turned out to perform best for the X-band radars used in this study. If both criteria are fulfilled in more than 10 % of the consecutive range gates, the centre range gate is flagged as clutter.
Interferences caused by other radars occur in the form of spikes or rings in the radar image. Spikes are characterised and identified by a sign change in reflectivity difference be-tween neighbouring radar beams, rings by a sign change in differences between neighbouring range gates. In order to identify spikes, the reflectivity difference between range gates of neighbouring radar beams is calculated and, from that, the sign change in differences is derived. If Eq. (3) is fulfilled in more than three cases within a window of five range gates in radial direction around the centre range gate, it is flagged as interference. The window of five range gates is chosen in order to be able to identify spikes that do not affect the entire radar beam. Equation (3) needs to be fulfilled for
three instead of for all five range gates within the window to allow for detection of the edges of spikes, otherwise the first and last two range gates would remain in the radar image. To detect rings, the same procedure is applied by interchanging the radial and angular direction.
Despite the application of TDBZ, SPIN as well as spike and ring algorithms, some clutter remains in the radar image. The unique feature of high temporal resolution gives addi-tional information for further clutter detection, in contrast to common radar systems: range gates with high reflectivities that are present in the current plan position indicator (PPI) image but not in the two previous ones are most likely clutter or interferences. In Fig. 5d–f, the PPI images of reflectivity fields without noise for 13:28:30 UTC (Fig. 5f) and the two previous time steps (13:27:30 UTC in Fig. 5d and 13:28 UTC in Fig. 5e) are shown. Red circles indicate examples of range gates that have reflectivity values greater than the noise level only at 13:28:30 UTC and are, therefore, identified as clut-ter. Clutter caused by moving objects as well as interferences due to external emitters are present for a short period of time. Therefore, it appears in only one time step, whereas precip-itation structures remain nearly constant and between two time steps. For radars with a temporal resolution of the or-der of a few minutes, this method is not applicable.
Comparing the performance of the described dynamic clutter algorithms, the most efficient method is the TDBZ filter (Fig. 4b). It detects between 40 and 60 % of all clut-ter, followed by the SPIN filter with 20 to 40 %. The algo-rithm for spike and ring identification can only detect inter-ferences of other radars. These interinter-ferences are more rare than the static and dynamic clutter that is present in every radar image. Therefore, the spike and ring algorithms detect only between 15 and 35 % of all clutter. The algorithm de-pendent on the advantage of high temporal resolution of the radar network comparing three time steps (PPI comp) is de-signed to identify both, clutter and interferences. It operates in rain-free areas and is, therefore, not directly comparable to the performance of the other three algorithms. Despite its limited applicability, it detects up to 10 % of all clutter. 3.2.3 Network-based clutter algorithm
K. Lengfeld et al.: The PATTERN example 4159
Figure 6. (a) Sketch of obstacles and precipitation as seen from two different radars; (b) coverage within the X-band radar network and (c) clutter range gates detected any clutter algorithm (violet) by the network algorithm and any other clutter algorithm (yellow), and by the
network algorithm only (red).
applied in areas covered by at least three radars. If a range gate of one radar shows reflectivity, but the corresponding range gates of the other (at least two) radars do not, it is most likely to be clutter.
The areas covered by more than two radars for the exam-ple of 15 May 2013 at 15:28:30 UTC are indicated in dark blue and red in Fig. 6b. In this case that amounts to approxi-mately 60 % of the area covered by the radar. The area around the radar site is of special interest for clutter detection algo-rithms because most of the clutter occurs where the radar beam is close to the ground. This area is mostly covered by more than two radars and, therefore, the network-based clut-ter algorithm is applicable using the advantage of multiple coverage.
The added value of the network-based clutter algorithm is highlighted by the clutter map in Fig. 6c. The red area de-picts all clutter range gates that are detected by no others than the network-based algorithm totals to approximately 30 % of the clutter-affected area. In case of using a single radar only instead of a network, these disturbed range gates would re-main in the radar image and cause erroneous precipitation estimates.
The long-term study of the performance of the network-based clutter algorithm shows that this algorithm is the most
efficient one (Fig. 4b). More than 60 % and up to 80 % of the clutter range gates are detected by the network algorithm. This is a very good performance, especially considering the fact that the network algorithm only works in areas that are covered by more than two radars.
3.3 Calibration
Figure 7. Sketch of the set-up for calibration of X-band radars with
MRR.
a height resolution of 35 m and, therefore, it is common to omit the two lowest levels. The P–r relation is applicable from the third level. MRR measurements are corrected for at-tenuation with the spectral scheme proposed by Peters et al. (2010) based on the classical attenuation correction scheme of Hitschfeld and Bordan (1954). This scheme avoids the un-certainty in the relationship between reflectivityZ and rain rateRby calculating attenuationκandRfrom Doppler spec-tra using the drop size distribution. Three-hour averages of rain rate are calibrated with rain gauge measurements. The logarithmic calibration factor for MRR (CMRR) rain ratesR and, therefore, also reflectivities, is the mean difference be-tween the logarithmic rain rates of MRR (dBRMRR) and the rain gauge (dBRRG):
CMRR=dBRMRR−dBRRG with dBR=10·log(R). (5) The received signals of the MRR are transformed to drop size distributions (DSDs) using single-particle backscatter-ing cross sections that are calculated with Mie theory usbackscatter-ing the code of Morrison and Cross (1974). ReflectivityZMRRis derived from the MRR DSDs using Rayleigh approximation (Peters et al., 2005) and, thus, is independent of the wave-length. For the X-band radar, scattering is assumed to ap-pear mainly as Rayleigh scattering, which is a good approx-imation for light and moderate rainfall. For high rain rates, it is difficult to separate the non-Rayleigh scattering effect from attenuation completely, due to rain. In this rain inten-sity range, attenuation by liquid water is of the same order or outweighs non-Rayleigh scattering effects. The good agree-ment between X- and C-band systems that is found by Bar-bieri et al. (2014) confirms the applicability of the Rayleigh approximation for X-band radars.
The X-band radars are calibrated with reflectivity mea-surements of MRRs. Therefore, directly measured reflectiv-ity of the X-band radar is used for calibration, and not the precipitation product that is used for calibration with rain gauges. Another advantage of this method is that both sys-tems observe reflectivity at the same height and, therefore, more or less in the same volume (Fig. 7). This volume is derived for each combination of X-band radar and MRR in-dividually. The MRRs are between 1 km and 17.75 km away from the X-band radars. Depending on the distance to the radar, the radar beam is up to 870 m wide at the MRR sites.
Figure 8. Comparison of X-band radar MOD (ordinate) to micro
rain radar WST (abscissa) for April to October 2013. Frequency relative to the highest frequency is shown in different colours, from low levels in light blue to high levels in dark blue.
Therefore, up to 25 MRR gates are within the radar beam. Reflectivities from all MRR gates that fall within the radar beam are averaged using a linear weighting function depend-ing on their distance to the centre of the X-band radar beam, because the mean received power of the X-band radar comes from the centre of the beam. A linear fit of the form
ZMRR=a·ZX (6)
is applied, whereZMRR is the reflectivity of the MRR,ZX the reflectivity of the X-band radar, andais the calibration coefficient:
a=100.1·(dBZX−dBZMRR). (7)
As an example, a comparison between radar MOD and ref-erence station WST is depicted in Fig. 8a for April to Octo-ber 2013. Overall X-band radar MOD fits MRR WST mea-surements quite well, with a mean bias of 2.34 dBZ. The RMSE of 3.33 dBZ is due to comparison on a 30 s basis. With a correlation coefficient of 0.95, both systems are in very good agreement. A list of the calibration coefficients can be found in Table 2.
3.4 Attenuation correction
K. Lengfeld et al.: The PATTERN example 4161
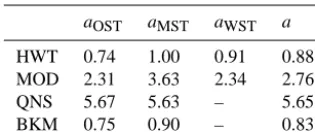
Table 2. Calibration coefficientsafor every possible combination of X-band radar (HWT, MOD, QNS and BKM) and MRR (OST, MST and WST) and the average coefficient in dBZ.
aOST aMST aWST a
HWT 0.74 1.00 0.91 0.88 MOD 2.31 3.63 2.34 2.76
QNS 5.67 5.63 – 5.65
BKM 0.75 0.90 – 0.83
δC(see Table 1):
Zm(r)=Z(r)δCA(r). (8)
Attenuation influences the radar beam in both ways, away from and back to the radar. Therefore, two-way apparent at-tenuationKis calculated as an integral along the path from range gate 0 to range gaterand back:
K(r)=2 r
Z
0
Z
m(s) α
1β
ds, (9)
with coefficientsα=132 250 andβ=1.2 for the X-band fre-quency range (Delrieu et al., 1997). The attenuation factorA
for a certain range gateris then calculated as
A(r)=
1−0.23
β Km(r) β
. (10)
The determination of attenuation works along a path with undisturbed measurements. Because of the elimination of clutter-affected range gates, data gaps occur that need to be filled. A common method for single radars is interpolation of data gaps. Thereby, information on the small-scale vari-ability of the rain event gets lost. In the overlapping areas within the network, the advantages of multiple information from different radars are used to fill data gaps. Therefore, the structure of precipitation is kept, and allows for more precise attenuation estimation within the network compared to single radars. The attenuation factor field is presented in Fig. 9a. It is in good agreement with the finding in Doviak and Zrnic (1993). In areas of high reflectivities in the most southern and western parts of the radar image, the attenuation factor
A(r) is higher than 0.5. The corrected reflectivity field af-ter clutaf-ter filaf-tering, calibration and attenuation correction is shown in Fig. 9b.
3.5 Composite of network radars
The X-band radar network derives multiple information on reflectivity, clutter and attenuation, because a large area is covered by more than one radar. To combine information of all four radars, a composite is calculated on a rotated Carte-sian grid; i.e., the Equator is shifted into the network-covered
area to allow for equidistant grid cells. A grid resolution of 250 m is used. Each radar range gate is assigned to the grid cell its centre is located in and the average of reflectivity val-ues of all radar range gates in a certain grid cell is calculated. In the outer parts of the radar-covered area, radar range gates are much larger in the azimuthal direction than grid cells and, therefore, not every grid cell includes a radar range gate cen-tre. To make sure that grid boxes far away from the radar sites contain at least one radar range gate centre, the resolution of the radar is artificially enhanced by dividing each azimuth angle into 0.1◦steps. In order to determine rainfall ratesR
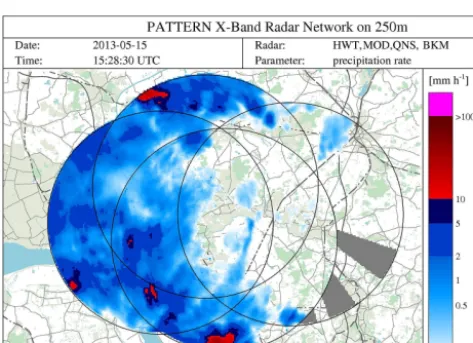
of the composite of reflectivities (Fig. 10), a common Z–R relation is applied:
R=aZb, (11)
with coefficientsa=320, 200 or 77 andb=1.4, 1.6 or 1.9, respectively, depending on the strength of the rain event. These coefficients are used for precipitation estimation in Germany by the DWD, and are adopted for the X-band radar measurements in order to allow for comparison with precip-itation rates obtained from the C-band radar operated by the DWD. The result is a nearly undisturbed precipitation field that covers the western half of the network area.
4 Comparison to C-band radar
In the last section, it was shown that several algorithms are needed to obtain nearly undisturbed calibrated reflectivity fields from raw data. In order to give an estimation on the quality of products from the PATTERN X-band radar net-work, reflectivity data are compared to the products of radar Fuhlsbüttel operated by the DWD in Hamburg 40 km south-east of the network area. Radar Fuhlsbüttel provides reflec-tivity measurements in the C-band frequency range, with a range resolution of 1 km, an azimuthal resolution of 1◦and a temporal resolution of 5 min. In this study, the precipitation scan with an elevation angle of 0.7◦is used for comparison to X-band radar data. The PATTERN network observes reflec-tivity with a temporal resolution of 30 s. Therefore, reflectiv-ity fields obtained by the PATTERN network are compared to the closest 5 min measurements of radar Fuhlsbüttel.
Figure 9. Attenuation correction for radar MOD for 15 May 2013, 15:28:30 UTC: (a) attenuation factor field and (b) corrected dBZ field.
Figure 10. Composite of the precipitation fields of all four
PAT-TERN radars for 15 May 2013, 15:28:30 UTC.
the different calibrations of both systems. The precipitation field is slightly shifted to the east in the image derived by radar Fuhlsbüttel. This is due to the time shift of 1.5 min be-tween Fig. 11a and b.
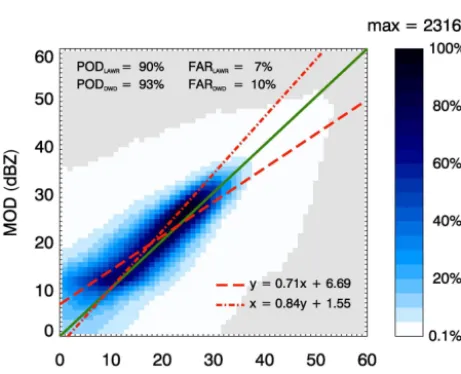
The good agreement between the PATTERN network and radar Fuhlsbüttel in terms of reflectivity is also evident in a long-term comparison of both systems shown in Fig. 12. Reflectivities from the PATTERN network are averaged on the grid of radar Fuhlsbüttel. All precipitation events that occur from May to September 2013 are taken into account, and reflectivity values are divided into 1 dBZ steps. Overall, both systems are in good agreement. The PATTERN network slightly overestimates measurements of radar Fuhlsbüttel for reflectivities lower than 15 dBZ, which results in an intercept of 6.7 dBZ when DWD radar is used as a regressor. For PAT-TERN radar as a regressor, the intercept is clearly smaller, at 1.5 dBZ. The probability of detection (POD) and the false alarm ratio (FAR) give additional information on the accor-dance of both systems. One system serves as a reference, and the other system’s ability to observe the same precipitation
events is tested. POD is a measure of how many of all pre-cipitation events detected by the reference system are also observed by the test system. It is 90 % for LAWR as a test system, and 93 % for DWD C-band radar as a test system. This means that at least 90 % of all rain events are measured by both systems. POD is slightly smaller for the X-band radar because small-scale structures, especially at the border of rain events, cannot be resolved by the C-band radar. FAR is a measure of how often the test system detects rainfall, while the reference does not observe any precipitation. It does not exceed 10 % for either system. The good agreement in terms of POD, FAR and reflectivity values between PATTERN and radar Fuhlsbüttel demonstrates that, overall, the PATTERN network provides reliable reflectivity data and promising re-sults in terms of higher resolution.
The higher resolution of the PATTERN product compared to radar Fuhlsbüttel allows for enhanced and more detailed spatial allocation of precipitation. In order to investigate the variability of reflectivity within a single range gate of radar Fuhlsbüttel with a range resolution of 1 km and an azimuthal resolution of 1◦, the number of rain range gates from the PATTERN network is calculated for each DWD range gate (Fig. 13a). The lower the percentage of rain range gates, the smaller the rain-covered area within a certain DWD range gate is. The western part of the network is completely cov-ered by rain and, therefore, the percentage of rain range gates from the network is 100 % for almost all DWD range gates. At the edges of the precipitation field in the centre of the network area, the percentage drops to less then 10 %. These small-scale structures cannot be observed with the coarse res-olution of radar Fuhlsbüttel. The standard deviation within each DWD range gate, depicted in Fig. 13b, stresses the im-portance of high-resolution precipitation observations, with values of up to 3 dBZ at the edges of the rain events.
5 Conclusions
K. Lengfeld et al.: The PATTERN example 4163
Figure 11. (a) Composite of reflectivity fields of all four network radars for 15 May 2013, 15:28:30 UTC, and (b) reflectivity field from radar
Hamburg for 15 May 2013, 15:30 UTC.
Figure 12. Comparison of reflectivity values from radar Fuhlsbüttel
(abscissa) and radar MOD (ordinate) from May to September 2013. Frequency relative to the highest frequency is shown in different colours, from low levels in light blue to high levels in dark blue. Dashed and dashed–dotted red lines denote linear fits with radar Fuhlsbüttel and radar MOD as regressors, respectively. The proba-bility of detection (POD) and the false alarm ratio (FAR) are also given.
Attenuation Estimates from a High-Resolution Weather Radar Network (PATTERN) project that has been operational since January 2012. The radars provide reflectivity fields with a range resolution of 60 m, a sampling resolution of 1◦ in the azimuthal direction, and a temporal resolution of 30 s. Algorithms have been developed to remove disturbances in raw reflectivity fields of single radars. The performance of these algorithms is exemplary, as shown for one of the net-work radars (MOD). The simple radar systems presented in this study cannot measure background noise directly. There-fore, noise level is estimated for each radar using the 5th per-centile of the smoothed reflectivity field and the noise levels of the last 10 time steps.
Approximately 10 % of the radar-covered area is disturbed by reflection from obstacles such as trees or houses or from other transmitters. In order to identify clutter range gates, two different types of clutter detection algorithms are ap-plied: single-radar and network-based algorithms. Some of the single-radar algorithms are based on classic clutter detec-tion methods, such as the texture of the dBZ field (TDBZ), sign changes in reflectivity gradient between neighbouring range gates (SPIN), the shape of disturbances from other transmitters (spikes or rings), or a static clutter map. The most efficient of these single-radar algorithms is the TDBZ filter, which detects up to 60 % of all clutter, followed by the SPIN filter with up to 40 %.
Figure 13. (a) Percentage of PATTERN network range gates with rain on the DWD grid and (b) standard deviation of reflectivity in the
PATTERN network on the DWD grid for 15 May 2013, 15:28:30 UTC.
due to interpolation is avoided, and the small-scale structure of rain events is kept.
Three reference stations are deployed within the network-covered area for calibration purposes, consisting of a rain gauge, a wind sensor, and micro rain radar (MRR). Using MRRs for X-band radar calibration has the advantage of comparing reflectivity measurements at the same height level instead of to observations at the ground from rain gauges. A slight overestimation of MRR measurements is detected and corrected for radar MOD. X-band radars are highly influ-enced by attenuation from liquid water. Therefore, a simple single-radar algorithm for attenuation correction is applied to the network radars. In order to apply this algorithm, a con-tinuous reflectivity field without data gaps caused by clutter and interferences is needed. Here, the network benefits again from the large area covered by more than one radar. Informa-tion from other radars is used to fill these gaps and maintain the small-scale structure of rain events instead of smoothing the precipitation field by interpolation.
A composite of all four radars is calculated on a 250 m×250 m grid by averaging reflectivities from all range gates whose centres fall within a certain grid cell. A com-parison to measurements from a C-band radar operated by DWD indicates that the PATTERN network slightly overes-timates reflectivity but also displays the spatial structure of rain events very well in higher resolution than nationwide radar networks can do. This is in good agreement with case studies conducted by Allegretti et al. (2012) and Trabal et al. (2013), who recommend the use of low-cost X-band radars in complementation to large-scale C- or S-band networks.
A long-term study showed that both systems are in good agreement for all rain events that occurred from May to September 2013. It has been shown that, especially at the border of rain events, where only parts of the C-band radar range gates are covered by rain, higher resolution of the X-band radar network provides more detailed information on the structure of the precipitation. Within a C-band radar range gate, the standard deviation can be up to 3 dBZ. Due to
its low costs compared to other radar systems (less than 20 % of the price of dual-polarisation systems), a single LAWR or a network of LAWRs is affordable not only for weather ser-vices, but also for private companies and local authorities, and can be set up in areas of special interest, e.g. urban areas or mountainous regions. They can serve as a sort of magnify-ing glass to investigate the spatial and temporal structures of rain events in addition to large S- or C-band radar systems.
6 Outlook
It has been shown in this paper that a network of LAWRs gives reliable precipitation estimates and can be a useful ad-dition to nationwide radar networks. For further improve-ment, the next step will be the implementation of attenua-tion correcattenua-tion algorithms that use the advantage of a net-work (e.g. Chandrasekar and Lim, 2008; Srivastava and Tian, 1996; Testud and Amayenc, 1989). Better estimation of at-tenuation can lead to better precipitation estimates, because the relation between attenuation and precipitation is more stable than the relation between reflectivity and precipitation. Furthermore, the fixed relation between radar reflectivity and precipitation will be replaced by a dynamic relation de-termined operationally using measurements of seven MRRs installed in the PATTERN catchment. This allows for adap-tation of Z–R relations to current weather conditions, e.g. showers and light or stratiform rain.
K. Lengfeld et al.: The PATTERN example 4165
Acknowledgements. The Precipitation and Attenuation Estimates from a High-Resolution Weather Radar Network (PATTERN) project is a joint project between the University of Hamburg and the Max-Planck-Institute for Meteorology. It is funded by the Deutsche Forschungsgemeinschaft (grant AM308/3-1).
The authors thank the German Weather Service (DWD) for making products of their C-band radar network available for research purposes within the PATTERN project.
Edited by: G. Vulpiani
References
Allegretti, M., Bertoldo, S., Prato, A., Lucianaz, C., Rorato, O., No-tarpietro, R. and Gabella, M.: X-Band Mini Radar for Observing and Monitoring Rainfall Events, Atmos. Clim. Sci., 2, 290–297, 2012
Atlas, D. and Banks, H. C.: The Interpretation of Microwave Re-flections from Rainfall, J. Meteor., 8, 271–282, 1951
Atlas, D. and Ulbrich, C. W.: Path- and Area-Integrated Rainfall Measurement by Microwave Attenuation in the 1-3 cm Band, J. Appl. Meteor., 1, 1322–1331, 1977
Barbieri, S., Piciotti, E., Montopoli, M., Di Fabio, S., Lidori, R., Marzano, F., Kalogiros, J., Anagnostou, M., and Baldini, L.: Intercomparison of Dual-Polarization X-Band Mini-Radar Per-formances with Reference Radar Systems at X- and C-Band in Rome Supersite, Proceedings of 8th European Conference on Radar in Meteorology and Hydrology, Garmisch-Partenkirchen, Germany, 1–5 September 2014
Beck, J. and Bousquet, O.: Using Gap-Filling Radars in Moun-tainous Regions to Complement a National Radar Network: Im-provements in Multiple-Doppler Wind Syntheses, J. Appl. Me-teor., 52, 1836–1850, 2013
Chandrasekar, V. and Lim, S.: Retrieval of Reflectivity in a Net-worked Radar Environment, J. Atmos. Oceanic Technol., 25, 1755–1767, 2008
Delrieu, G., Caoudal, S., and Creutin, J. D.: Feasibility of Using Mountain Return for the Correction of Ground Based X-Band Weather Radar, J. Atmos. Ocean. Technol., 14, 368–385, 1997 Doviak, R. J. and Zrnic, D. S.: Doppler Radar and Weather
Obser-vations, Dover Publications, 2nd Edn., 42, 1993
Dutton, E. J.: Estimation of Radio Attenuation in Convective Rain-falls, J. Appl. Meteor., 6, 622–668, 1967
Einfalt, T.: A User Perspective in Germany: What is Espected by Agencies and Government from Radar Data?, Int. J. River Basin Management, 1, 1–5, 2003
Gunn, K. L. S. and East, T.: The Microwave Properties of Precipi-tation Particles, Quart. J. R. Meteor. Soc, 80, 522–545, 1954 Hitschfeld, W. and Bordan, J.: Errors Inherent in the Radar
Mea-surement of Rainfall at Attenuating Wavelengths, J. Meteorol., 11, 58–67, 1954.
Hubbert, J. C., Dixon, M., and Ellis, S. M.: Weather Radar Ground Clutter. Part II: Real-Time Identification and Filtering, J. Atmos. Ocean. Technol., 26, 1181–1197, 2009
Kabeche, A. C. and Testud, J.: Stereoradar Meteorology: A New Unified Approach to Process Data from Airborne or Ground-Based Meteorological Radars., J. Atmos. Ocean. Technol., 12, 783–799, 1995
Lengfeld, K., Clemens, M., Feiertag, N., and Ament, F.: Precipita-tion and AttenuaPrecipita-tion Estimates from a High-ResoluPrecipita-tion Weather Radar Network (PATTERN): Design of the Experiment, in: Pro-ceedings of the 7th European Conference on Radar in Meteorol-ogy and HydrolMeteorol-ogy, Toulouse, France, 24–29 June 2012 Lengfeld, K., Clemens, M., Münster, H., and Ament, F.: PATTERN:
Advantages of High-Resolution Weather Radar Networks, in: Proceedings of American Meteorological Society 36th Confer-ence on Radar Meteorology, Breckenridge, CO, USA, 16–20 September 2013.
Lim, S., Chandrasekar, V., Lee, P., and Jayasumana, A. P.: Real-Time Implementation of a Network-Based Attenuation Correc-tion in the CASA IP1 Testbed, J. Atmos. Ocean. Technol., 28, 197–209, 2011
Mahale, V. N., Brotzge, J. A., and Bluestein, H. B.: The Advantages of a Mixed-Band Radar Network for Severe Weather Operations: A Case Study of 13 May 2009, Weather Forecast., 29, 78–98, 2014
Marzoug, M. and Amayenc, P.: A Class of Single- and Dual-Frequency Algorithms for Rain-Rate Profiling from a Space-borne Radar. Part I: Principle and Tests from Numerical Simu-lations, J. Atmos. Ocean. Technol., 11, 1480–1506, 1994 Matrosov, S. Y., Cifelli, R., and Gochis, D.: Measurements of Heavy
Convective Rainfall in the Presence of Hail in Flood-Prone Ar-eas Using an X-Band Polarimetric Radar, J. Appl. Meteorol., 52, 395–407, 2013
McLaughlin, D., Pepyne, D., Chandrasekar, V., Philips, B., Kurose, J., Zink, M., Droegemeier, K., Cruz-Pol, S., Junyent, F., Brotzge, J., Westbrook, D., Bharadwaj, N., Wang, Y., Lyons, E., Hondl, K., Liu, Y., Knapp, E., Xue, M., Hopf, A., Kloesel, K., DeFonzo, A., Kollias, P., Brewster, K., Contreras, R., Dolan, B., Djaferis, T., Insanic, E., Frasier, S. and Carr, F.: Short-Wavelength Tech-nology and the Potential for Distributed Networks of Small Radar Systems, B. Am. Meteor. Soc., 90, 1797–1817, 2009 Morrison, J. A. and Cross, M. J.: Scattering of a Plane
Electromag-netic Wave by Axissymmetric Raindrops, Bell. Syst. Tech. J., 53, 955–1019, 1974
Peters, G., Fischer, B., and Clemens, M.: Rain Attenuation of Radar Echeos Considering Finite-Range Resolution and Using Drop Size Distributions, J. Atmos. Ocean. Technol., 27, 829–842, 2010
Peters, G., Fischer, B., Münster, H., Clemens, M. and Wagner A.: Profiles of Raindrop Size Distributions as Retrieved by Micro Rain Radars, J. Appl. Meteorol., 44, 1930–1949, 2005
Rubel, F. and Hantel, M.: Correction of Daily Rain Gauge Mea-surements in the Baltic Sea Drainage Basin, Nord. Hydrol., 30, 191–208, 1999
Shakti, P. C., Maki, M., Shimizu, S., Maesaka, T., Kim, D.-S., Lee, D. I., and Iida, H.: Correction of Reflectivity in the Presence of Partial Beam Blockage over a Mountainous Region Using X-Band Dual Polarization Radar, J. Hydrometeorol., 14, 744–764, 2013
Skolnik, M. I. (Ed.): Radar Handbook, McGraw-Hill, New York, 3rd Ed, 2008.
Tian, L. and Srivastava, R. C.: Measurements of Attenuation at C-Band in a Convective Storm by a Dual-Radar Method, J. Atmos. Ocean. Technol., 14, 184–196, 1997
Testud, J. and Amayenc, P.: Stereoradar Meteorology: A Promising Technique for Observation of Precipitation from a Mobile Plat-form, J. Atmos. Ocean. Technol., 6, 89–108, 1989
Trabal, J. M., Colom-Ustariz, J., Cruz-Pol, S., Pablos-Vega, G. A., and McLaughlin, D. J.: Remote Sensing of Weather Hazards Us-ing a Low-Cost and Minimal Infrastructure Off-the-Grid Weather Radar Network, IEEE Trans. Geosci. Remote Sens., 51, 2541– 2555, 2013
Turso, S., Zambotto, M., Gabella, M., Orione, F., Notarpietro, R., and Perona, G.: Microradarnet: An Innovative Wireless Micro Radar Network for High Resolution Weather Monitoring, pre-sented at 9th European Conference on Applications of Meteorol-ogy, Toulouse, France, 28 September–2 Oktober 2009, 2009 Ventura, J. F. I. and Tabary, P.: The New French Operational
Polari-metric Radar Rainfall Rate Product, J. Appl. Meteor., 52, 1817– 1835, 2013