www.earth-syst-dynam.net/5/197/2014/ doi:10.5194/esd-5-197-2014
© Author(s) 2014. CC Attribution 3.0 License.
Earth System
Dynamics
Quantifying uncertainties in soil carbon responses to changes
in global mean temperature and precipitation
K. Nishina1, A. Ito1, D. J. Beerling6, P. Cadule7, P. Ciais7, D. B. Clark4, P. Falloon3, A. D. Friend5, R. Kahana3, E. Kato1, R. Keribin5, W. Lucht2, M. Lomas6, T. T. Rademacher5, R. Pavlick8, S. Schaphoff2, N. Vuichard7, L. Warszawaski2, and T. Yokohata1
1National Institute for Environmental Studies, 16-2, Onogawa, Tsukuba, Ibaraki, Japan
2Potsdam Institute for Climate Impact Research, Telegraphenberg A 31, 14473 Potsdam, Germany 3Met Office Hadley Centre, FitzRoy Road, Exeter, Devon, EX1 3PB, UK
4Centre for Ecology and Hydrology, Wallingford, OX10 8BB, UK
5Department of Geography, University of Cambridge, Downing Place, Cambridge, CB2 3EN, UK 6Department of Animal and Plant Sciences, University of Sheffield, Sheffield, S10 2TN, UK
7Laboratoire des Sciences du Climat et de l’Environment, Joint Unit of CEA-CNRS-UVSQ, Gif-sur-Yvette, France 8Max Planck Institute for Biogeochemistry, Hans-Knöll-Str. 10, 07745 Jena, Germany
Correspondence to: K. Nishina ([email protected])
Received: 27 August 2013 – Published in Earth Syst. Dynam. Discuss.: 12 September 2013 Revised: 19 January 2014 – Accepted: 21 February 2014 – Published: 2 April 2014
Abstract. Soil organic carbon (SOC) is the largest carbon pool in terrestrial ecosystems and may play a key role in bio-spheric feedbacks with elevated atmobio-spheric carbon dioxide (CO2) in a warmer future world. We examined the simulation
results of seven terrestrial biome models when forced with climate projections from four representative-concentration-pathways (RCPs)-based atmospheric concentration scenar-ios. The goal was to specify calculated uncertainty in global SOC stock projections from global and regional perspectives and give insight to the improvement of SOC-relevant pro-cesses in biome models. SOC stocks among the biome mod-els varied from 1090 to 2650 Pg C even in historical periods (ca. 2000). In a higher forcing scenario (i.e., RCP8.5), in-consistent estimates of impact on the total SOC (2099–2000) were obtained from different biome model simulations, rang-ing from a net sink of 347 Pg C to a net source of 122 Pg C. In all models, the increasing atmospheric CO2concentration
in the RCP8.5 scenario considerably contributed to carbon accumulation in SOC. However, magnitudes varied from 93 to 264 Pg C by the end of the 21st century across biome mod-els. Using the time-series data of total global SOC simu-lated by each biome model, we analyzed the sensitivity of the global SOC stock to global mean temperature and global precipitation anomalies (1T and1P respectively) in each
biome model using a state-space model. This analysis sug-gests that1T explained global SOC stock changes in most models with a resolution of 1–2◦C, and the magnitude of global SOC decomposition from a 2◦C rise ranged from
al-most 0 to 3.53 Pg C yr−1among the biome models. However,
1P had a negligible impact on change in the global SOC changes. Spatial heterogeneity was evident and inconsistent among the biome models, especially in boreal to arctic re-gions. Our study reveals considerable climate uncertainty in SOC decomposition responses to climate and CO2 change
among biome models. Further research is required to im-prove our ability to estimate biospheric feedbacks through both SOC-relevant and vegetation-relevant processes.
1 Introduction
the maintenance of SOC is important for global and social sustainability (e.g., Mol and Keesstra, 2012). In climate sys-tems, because of the vast carbon pool of SOC, the behavior of SOC is key for understanding the feedback of terrestrial ecosystems to atmospheric CO2concentrations in a warmer
world (Heimann and Reichstein, 2008; Thum et al., 2011). However, a large number of uncertainties exist in the ob-servation and modeling of SOC dynamics (e.g., Post et al., 1982; Todd-Brown et al., 2013). For example, in the Cou-pled Model Intercomparison Project Phase 5 (CMIP5), Todd-Brown et al. (2013) reported that the (simulated) present-day global SOC stocks range from 514 to 3046 Pg C among 11 Earth system models (ESMs). Soil processes in terrestrial ecosystem models are significantly simpler than actual pro-cesses or above-ground propro-cesses, and thus exist structural uncertainties in SOC dynamics in ESMs.
Temperature and precipitation are critical factors for the feedback of terrestrial ecosystems to atmospheric CO2
(Seneviratne et al., 2006). Similarly, SOC dynamics are strongly affected by temperature and precipitation, because SOC dynamics in biome models are parameterized as a func-tion of soil temperature, moisture, and other factors (e.g., Davidson and Janssens, 2006; Ise and Moorcroft, 2006; Falloon et al., 2011). The differences in these functions and their parameters have important effects on the projec-tion of global SOC stocks and their behavior (Davidson and Janssens, 2006; Ise and Moorcroft, 2006).
In this study, we examined the SOC dynamics simulated by seven biome models as part of the Inter-Sectoral Im-pact Model Intercomparison Project (ISI-MIP) (Warszawski et al., 2014), which were forced using the bias-corrected out-puts of five global climate models (GCMs) in newly de-veloped climate scenarios, i.e., representative concentration pathways (RCPs). We aimed to investigate the impact of cli-mate change on the global SOC stock with respect to changes in global mean temperature and precipitation and explore the uncertainties in future global SOC stock projections.
In order to analyze the first-order behavior of the simu-lated global SOC-dynamics, we focused on the interannual responses of the biome models under the assumption that SOC is one-compartment of Earth’s system. First, we con-sidered global SOC dynamics as the following simple, dif-ferential equation:
dSOC
dt =Input−kSOC, (1)
where Input is carbon derived primarily from photosynthesis products via chemical and microbial humification (Wershaw, 1993), andkis the global SOC turnover rate. In most conven-tional models (Li et al., 2014), SOC decomposition functions as a first-order decay process as in Eq. (1). SOC dynamics are regulated by the balance between the input from vegeta-tion biomass carbon and SOC decomposivegeta-tion. In this study, we examined a simple hypothesis: can global mean tem-perature and precipitation anomalies (1T (◦C) and1P(%),
respectively) be used as explanatory variables of global SOC decomposition dynamics in future (projections over the 21st century). If true, this would mean that1T and1P can ex-plain k during a projection period in biome models. This simplification enables us to review the global impact of cli-mate change on SOC dynamics and identify the character-istics of biome models especially in global SOC behavior. Subsequently, we assessed whether the time evolution of the estimation uncertainties for SOC can be explained by1T
and1P sensitivities during the 21st century for each biome model. Furthermore, we compared the spatial distributions of global SOC pools and their changes to evaluate regional differences, focusing on detailed processes in the interaction with vegetation dynamics.
2 Materials and methods
2.1 Method and models
In this study, we examined SOC processes using seven biome models obtained from the ISI-MIP. The biome models are Hybrid4 (Friend and White, 2000), JeDi (Jena Diversity-Dynamic Global Vegetation model) (Pavlick et al., 2013), JULES (Joint UK Land Environment Simulator; Clark et al., 2011; Best et al., 2011), LPJmL (Lund–Potsdam–Jena man-aged land Sitch et al., 2003), SDGVM (Sheffield Dynamic Global Vegetation Model; Woodward et al., 1995), VISIT (Vegetation Integrative Simulator for Trace gases) (Ito and Oikawa, 2002; Ito and Inatomi, 2012), and ORCHIDEE (Or-ganizing Carbon and Hydrology in Dynamic Ecosystems; Krinner et al., 2005). In this study, Hybrid4, JeDi, JULES, and LPJmL are dynamic global vegetation models, and the others are fixed vegetation models, in this study. General in-formation about SOC processes is summarized in Table 1.
In the ISI-MIP framework, these models were run with 5 GCM×4 RCP scenarios and a fixed CO2control was also
run with RCP8.5 climate condition scenarios. In this study, for the biome model forcing, we used climate variables in HadGEM2-ES (HadGEM – Hadley Centre Global Environ-mental Model) with bias correction for temperature and pre-cipitation from Hempel et al. (2013). For the spin-up of each model, we used de-trending forcing data for the years 1951– 1980 repeatedly until reaching equilibrium of VegC (vegeta-tion carbon) and SOC. For CO2, we used the CO2
concentra-tion for 1950 while running the 30 yr spin-ups. The global climate variables (atmospheric CO2 concentration, global
mean terrestrial temperature anomaly1T (◦C), and global
terrestrial precipitation anomaly1P(%)) in each RCP sce-nario for HadGEM are summarized in Fig. 1.1T and1P
Table 1. Description of SOC-relevant processes in each biome model.
Model f (T )∗ f (M)∗ Compartment Permafrost Soil Citation
depth
Hybrid4 Exponential with optimum Optimum curve 8 None Non-explicit Friend and White (2000)
JeDi Exponential (Q10; 1.4) none 1 None Over 5 m Pavlick et al. (2013)
JULES Exponential (Q10; 2.0) Linear with plateau 4 None Non-explicit Clark et al. (2011)
LPJmL Lloyd & Taylor Linear 2 Considered 3 m Sitch et al. (2003)
SDGVM Optimum curve Optimum curve 4 None 1 m Woodward et al. (1995)
VISIT Lloyd & Taylor Optimum curve 1 None 1 m Ito and Inatomi (2012)
ORCHIDEE Exponential (Q10; 2.0) Quadratic 3 None Non-explicit Krinner et al. (2005)
∗f (T )andf (M)indicate the function of temperature and moisture sensitivities of SOC. Compartments indicates the number of SOC compartment considered in SOC pool
(e.g., slow, fast decomposition compartments included in LPJmL).
2.2 Estimation of1T and1P sensitivity of global SOC
We used a state-space model (more properly vector autore-gression) (Sims and Zha, 1998) to evaluate the sensitivity of global SOC decomposition to global temperature and pre-cipitation anomalies in each biome model. This vector au-toregression model considers only process uncertainty, not observation uncertainty in a state-space model. We applied this analysis to annual global SOC time-series data in each biome model simulated in the five scenarios (three scenar-ios for ORCHIDEE), i.e., the four RCPs and the fixed CO2
experiment with RCP8.5 climate conditions in HadGEM (Figs. 1, 2).
We first modeled the likelihood function using the follow-ing equation. The model outputs were archived for each year; therefore, we discretized the equation as the annual time stept.
SOC[n,t]∼normal µ[n,t−1], σps, (2)
where SOC[n,t] is the global SOC stock at timet (year) in
scenarion, andσpsis the process error.µ[n,t−1]is defined as
follows:
µ[n,t−1]=αVegC[n,t−1]+e(
−k−β11T[n,t−1]−β21P[n,t−1])SOC
[n,t−1],(3) where VegC[n,t] indicates the global vegetation biomass C
stock at timet in scenario n, andαis the fraction of VegC transformed into SOC per year, which is assumed to repre-sent the annual input of SOC.kis the turnover rate for global SOC (yr−1) under standardized global mean temperature and
precipitation conditions (averages between 1980 and 2000).
β1andβ2 are the global SOC sensitivities to1T and1P,
respectively (units: yr−11T−1and yr−11P−1). The priors of these parameters are defined as follows:
σps ∼uniform(0,100), (4)
α∼uniform(0, 0.1), (5)
k∼uniform(0,1), (6)
β1 ∼normal(0, 100), (7)
β2 ∼normal(0, 100). (8)
CO2
400
600
800
CO
2
(ppmv)
Historical RCP2.6 RCP4.5 RCP6.0 RCP8.6
Fixed CO2 experiment
Temperature
−1
1
2
3
4
5
6
∆
T [
°
C]
Precipitation
1980 2000 2020 2040 2060 2080 2100
−5
0
5
10
15
∆
P [%]
Year
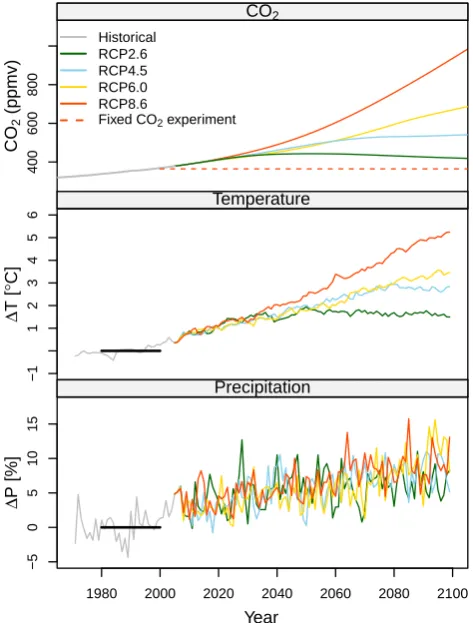
Fig. 1.
Climate variables for CO
2(RCPs), and global mean annual temperature and global annual
pre-cipitation anomalies in HadGEM.
figure
31
Fig. 1. Climate variables for CO2(RCPs), and global mean annual
temperature and global annual precipitation anomalies in HadGEM.
We used vague priors forβ1andβ2to estimate the1T and
1P effect onk. Forαandk, we used uniform priors, which are sufficiently broad theoretically.
Then, the joint posterior is given by following equation.
p α, β1, β2, k, σpr|data
∼p data|α, β1, β2, k, σpr
We used the Hamiltonian Monte Carlo method to sample the posterior with STAN (Stan Development Team, 2012) and R (R Core Team, 2012).
2.3 Evaluation of stimulated global SOC decomposition in1T from posteriors
Using posteriors in the steady-state model, we simulated the global SOC decomposition stimulated by increased global mean temperature at12,13, and14◦C.
Stimulated SOC decomposition=e(−k−β11T )SOC
2000−e−kSOC2000 (10)
We used the global SOC stock SOC for the year of 2000 for each biome model to calculate the global SOC de-composition and obtained posterior simulations by draw-ing 1000 samples from the posterior distributions. From the 1000 iterations, we evaluated the predictive posterior inter-vals for the stimulated global SOC decomposition values at each1T.
In addition, to standardize the SOC2000 in each biome
model, we used the value of 1255 Pg C (95 % CI; 891– 1657 Pg C) estimated by Todd-Brown et al. (2013) instead of the original SOC2000of each biome model to evaluate the
ef-fect of current SOC stocks on the global SOC decomposition to1T in each model. This procedure enable us to evaluate the effects of the estimated current global SOC stock in each model on the response to1T raising.
3 Results
3.1 Global SOC and VegC projection in HadGEM
The increase of 1T depends on the RCP scenario, with the maximum increase in RCP8.5 being 7.5◦C in 2099 in HadGEM2. In RCP2.6, the maximum1T was 1.9◦C during the entire simulation period and showed signs of leveling off in 2050. In all RCP scenarios,1P increased to 11 (RCP4.5) and 16 % (RCP8.5). However, there were high amplitudes of
1P within each RCP scenario; thus, there were no obvious differences between RCPs.
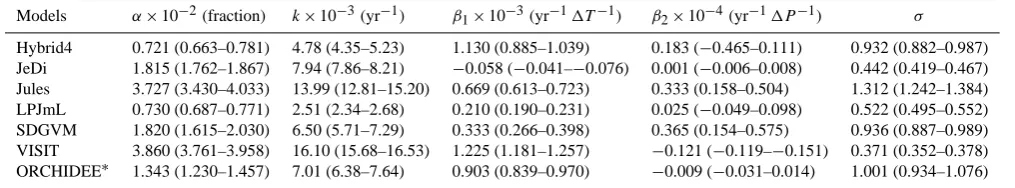
For 2000, in HadGEM, the global SOC stocks varied from 1090 (Hybrid4) to 2646 Pg C (JULES) between the biome models (Fig. 2). The mean global SOC stock in the six mod-els was 1772 Pg C (standard deviation; 568 Pg C). An esti-mated empirical global SOC stock was 1255 Pg C (Todd-Brown et al., 2013). However, global VegC stocks in 2000 ranged from 510 (VISIT) to 1023 Pg C (JULES). The mean global VegC among the seven biome models was 809 Pg C (SD (standard deviation); 223 Pg C) (Fig. 2). The global VegC stocks in most models were comparable with the VegC (493 Pg C) estimated by the IPCC Tier-1 method (Ruesch and Gibbs, 2008).
In the projection period (2000–2099), the SOC stock in the six models (except for Hybrid4) increased in all RCPs
compared to that in 2000. The global SOC stock in Hybrid4 continuously decreased in all RCPs during the projection pe-riod (Fig. 2). Under the RCPs, the maximum SOC stock in-crease for the projection period was observed in JeDi with RCP8.5, with a value of 347 Pg C. In the fixed CO2
scenar-ios, the global SOC stocks continuously decreased in most biome models, showing global SOC changes from−299 to 65 Pg C at the end of the simulation period.
The global VegC stocks increased in nearly all RCPs and biome models compared to the global VegC in 2000. How-ever, the global VegC stocks in Hybrid4 and LPJmL with RCP8.5 did not continuously increase in the projection pe-riod and were not the largest stock at the end of the simula-tion period during the projecsimula-tion period. In the fixed CO2
sce-narios, the global VegC stocks also continuously decreased, and global VegC changes ranged from−517 to−40 Pg C at the end of the simulation period (Fig. 2).
The rank order of the SOC stock over each RCP at the end of the simulation (2099) is in good agreement with the rank order of each corresponding VegC stock in the same period in JeDi, JULES, LPJmL, and SDGVM. However, the orders of the SOC stock in the other biome models are different than those of the global VegC stocks. These stock changes are attributed to the different SOC decomposition processes. 3.2 Posteriors of the state-space model; global SOC
sensitivity to1T and1P
The Gelman and Rubin convergence statistics (Rˆ) of all pa-rameters were lower than 1.01 in all models; therefore, the parameters represented successful convergences (data not shown). The posterior distributions of the parameters for each biome model are summarized in Table 2.
α, which is the fraction of annual translation of VegC to SOC, among the biome models varied from 0.721 % in Hy-brid4 to 3.860 % in VISIT. The SOC turnover ratek (yr−1) ranged from 2.51×10³ in LPJmL to 16.10×10³yr−1 in VISIT.
The 95 % credible intervals (CI) in sensitivity of global SOC to 1T (β1) in each biome model did not cover 0 in
all models (Table 2). And the 95 % CI ofβ1in each model
was not partially duplicated, which means that the sensi-tivity to 1T could be statistically distinguished between the biome models. The highest β1 was observed in VISIT,
with a median value of 1.225×10⁻³yr−11T−1(or◦C−1). The lowestβ1was observed in JeDi and was approximately
0 yr−11T−1.
The sensitivity of global SOC to1P (β2) in the biome
models was lower compared to the SOC turnover ratekand
β1. Their values (yr−11P−1) were nearly one order of
mag-nitude less thanβ1. Considering the range of the values of
Table 2. Posteriors of statistical time-series analysis of each biome model.
Models α×10−2(fraction) k×10−3(yr−1) β1×10⁻³(yr−11T−1) β2×10⁻⁴(yr−11P−1) σ
Hybrid4 0.721 (0.663–0.781) 4.78 (4.35–5.23) 1.130 (0.885–1.039) 0.183 (−0.465–0.111) 0.932 (0.882–0.987) JeDi 1.815 (1.762–1.867) 7.94 (7.86–8.21) −0.058 (−0.041–−0.076) 0.001 (−0.006–0.008) 0.442 (0.419–0.467) Jules 3.727 (3.430–4.033) 13.99 (12.81–15.20) 0.669 (0.613–0.723) 0.333 (0.158–0.504) 1.312 (1.242–1.384) LPJmL 0.730 (0.687–0.771) 2.51 (2.34–2.68) 0.210 (0.190–0.231) 0.025 (−0.049–0.098) 0.522 (0.495–0.552) SDGVM 1.820 (1.615–2.030) 6.50 (5.71–7.29) 0.333 (0.266–0.398) 0.365 (0.154–0.575) 0.936 (0.887–0.989) VISIT 3.860 (3.761–3.958) 16.10 (15.68–16.53) 1.225 (1.181–1.257) −0.121 (−0.119–−0.151) 0.371 (0.352–0.378) ORCHIDEE∗ 1.343 (1.230–1.457) 7.01 (6.38–7.64) 0.903 (0.839–0.970) −0.009 (−0.031–0.014) 1.001 (0.934–1.076)
∗In ORCHIDEE, the parameters were estimated from time-series data compiled in three scenarios (RCP2.6, RCP8.5, and Fixed CO
2).
On the basis of the posterior parameters, we estimated the stimulated global SOC decomposition for12,13, and
14◦C, assuming that each global SOC stock is at the 2000
level (Fig. 3). A statistical difference was observed among the 12, 13, and 14◦C in five biome models (i.e., Hy-brid4, JULES, LPJmL, VISIT, and ORCHIDEE). However, the magnitudes of the stimulated global SOC decomposi-tion varied. At 14◦C, it ranged from 1.9 (in LPJmL) to 8.1 Pg C yr−1(in JULES). In SDGVM, there were no statis-tical differences in the stimulated global SOC decomposition between13 and14◦C. There were also no differences in this term among12,13, and14◦C in JeDi.
3.3 LatitudinalδSOC (2099–2000 and CO2-fixed CO2)
in HadGEM RCP8.5
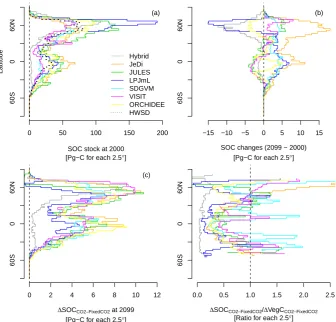
Latitudinal SOC stock in the HWSD (Figs. 4, 5a) displays a double peak in both the northern high latitudes and low latitudes. The most SOC stock is found around 60◦N. In all biome models, large SOC stocks were also observed in high-latitude zones (50–75◦N; Figs. 5a and S1 in the Sup-plement). However, the range of simulated SOC change dur-ing this century (kg C m−2) in each biome model was differ-ent. The upper 99 percentile of SOC accumulation in each biome model varied from 23.8 in SDGVM to 97.6 kg C m−2 in LPJmL (Fig. S1 in the Supplement).
For differences between 2099 and 2000 in HadGEM RCP8.5, a large variance among biome models was ob-served between 30◦S and 10◦N (tropic region) and be-tween 40 and 75◦N (boreal to Arctic region) (Figs. 4, 5a) in the biome models. There were four types of latitudinal changes: (i) SOC increase in both regions (JeDi, SDGVM, ORCHIDEE), (ii) SOC increase in boreal to arctic regions and decrease in the tropics (JULES, VISIT), (iii) SOC in-crease in the tropics and dein-crease in boreal to arctic regions (LPJmL), and (iv) SOC decrease in both regions (Hybrid4). The maximum difference was observed in the boreal regions, where it reached more than 20 Pg 2.5◦−1.
There were also differences between the increasing CO2
scenario (RCP8.5) and the fixed CO2 scenario with the
RCP8.5 climate condition in SOC (1SOCCO2−fixed CO2)
(Fig. 5c). This suggests that the increases of plant production
and biomass due to CO2 fertilizer effects in the increasing
CO2 scenario (RCP8.5) contributed to the SOC stock
in-creases because of the increase of C input to soil (indirect CO2 effect). We observed bimodal increases in six biome
models, and the peaks were between 30 and 70◦N and be-tween 30◦S and 10◦N. In Hybrid4, the large SOC increase due to CO2 was unimodal around the boreal regions. The
maximum difference between the increasing CO2 scenario
and the fixed CO2 scenario was observed around 60◦N,
which was approximately 10 Pg 2.5◦−1
The different values of 1SOCCO2−fixed CO2/1
VegCCO2−fixed CO2 (Fig. 5d) indicate a different turnover
rate of vegetation carbon to SOC (via litter) among the biome models and regions. This is because of the assumption of almost the same states except in VegC dynamics between RCP8.5 and fixed CO2 scenarios.
1SOCCO2−fixed CO2/1VegCCO2−fixed CO2 varied with latitude
and among the biome models. In almost all the models,
1SOCCO2−fixed CO2/1VegCCO2−fixed CO2 was the highest
in the higher latitude regions. In the Hybrid4 model, the
1SOCCO2−fixed CO2/1VegCCO2−fixed CO2 was relatively low
in all regions, compared with other model results.
4 Discussion
4.1 Global mean temperature and precipitation impact(s) on global SOC decomposition and projection uncertainties
During the projection period (2000–2099), the global SOC stock changes in all RCPs (without the fixed CO2scenario)
ranged from −6 to 280 Pg C under RCP2.6 (mean±SD: 89±104 Pg C). Under RCP8.5, the SOC changes varied from−124 to 392 Pg C (113±176 Pg C) (Fig. 2) at the end of the projection period. These global SOC stock changes are equivalent to −185 to +58 ppmv in atmospheric CO2
1 Global SOC
1 11 Global VegC
0
1000
2500
[Pg−C]
Hybr
id
JeDi JULES LPJmL SDGVM VISIT
ORCHIDEE
1
0
1000
2500
Hybr
id
JeDi JULES LPJmL
SDGVM VISIT
ORCHIDEE
1
1 Hybrid
1 11 Hybrid
600
1000
SOC
[Pg−C] HistoricalRCP2.6
RCP4.5
RCP6.0 RCP8.5
Fixed CO2 (RCP8.5) 400
800
PC
1 JeDi
1 11 JeDi
1900
2200
2500
SOC
[Pg−C]
800
1100
PC
1 JULES
1 11 JULES
2400
2700
SOC
[Pg−C]
900
1200
1500
PC1
1 LPJmL
1 11 LPJmL
1900
2200
SOC
[Pg−C]
500
700
900
PC
1 SDGVM
1 11 SDGVM
1100
1400
SOC
[Pg−C]
300
500
700
PC
1 VISIT
1 11 VISIT
900
1100
1300
SOC
[Pg−C]
300
500
700
PC
1 ORCHIDEE
1 11 ORCHIDEE
1400
1700
2000
SOC
[Pg−C]
Year
1970 1990 2010 2030 2050 2070 2090
900
1200
1500
PC
Year
1970 1990 2010 2030 2050 2070 2090
Fig. 2.
Changes in global SOC and VegC stocks of each biome model in HadGEM forced by each RCP.
Upper bar charts indicate global SOC and VegC stocks in 2000. In the bar chart for global SOC, blue lines
indicate the empirical global SOC stock estimated by Todd-Brown et al. (2013) based on Harmonized
World Soil Database (solid line indicates mean and dotted lines indicate 95 % confidence intervals). In
the bar chart for global VegC, blue line indicates empirical global VegC stock estimated by Ruesch and
Gibbs (2008).
Fig. 2. Changes in global SOC and VegC stocks of each biome model in HadGEM forced by each RCP. Upper bar charts indicate global SOC and VegC stocks in 2000. In the bar chart for global SOC, blue lines indicate the empirical global SOC stock estimated by Todd-Brown et al. (2013) based on the Harmonized World Soil Database (solid line indicates mean and dotted lines indicate 95 % confidence intervals). In the bar chart for global VegC, blue lines indicates empirical global VegC stock estimated by Ruesch and Gibbs (2008).
stocks act as either sinks or sources depending on the biome model. There were similar SOC projections in the same pe-riod (2000–2100) from multiple model simulations in previ-ous studies. In the C4MIP study, for example, the global SOC stock changes ranged from approximately −50 to 300 Pg by the end of the simulation period among the 11 coupled climate–carbon models (Friedlingstein et al., 2006; Eglin et al., 2010). It has also been predicted that SOC stocks in
2100 differ by approximately 200 Pg among five DGVMs un-der forced A1FI and B1 scenarios (Sitch et al., 2008), which is the highest forcing scenario in the AR4 assessment. Com-pared with these studies, the SOC changes simulated in this study varied comparably or showed slightly higher uncer-tainty than those of previous projections.
Mean with 95%CI SOC standardized
Hybrid JeDi JULES
0 −2 −4 −6 −8 a b c
a a a
a b
c
LPJmL SDGVM VISIT
Stim
ulated global SOC changes in each
∆
T [Pg−C Y
ear − 1] 0 −2 −4 −6 −8 a b c
∆2°C ∆3°C ∆4°C
a b
b
∆2°C ∆3°C ∆4°C a b c ORCHIDEE 0 −2 −4 −6 −8
∆2°C ∆3°C ∆4°C a
b c
Fig. 3.
Estimated global SOC changes in response to each
∆
T
in each biome model based on the
original global SOC stock at 2000 (blue symbols) and standardized as the empirical global SOC stock
(1255 Pg C, 95 % C.I.; 891 Pg C–1657 Pg C) estimated in Todd-Brown et al. (2013). Different letters
indicate no partial duplication among 95 % CI for each biome model (Table 2).
33
Fig. 3. Estimated global SOC changes in response to each 1T
in each biome model based on the original global SOC stock at 2000 (blue symbols) and standardized as the empirical global SOC stock (1255 Pg C, 95 % CI; 891–1657 Pg C) estimated in Todd-Brown et al. (2013). Different letters indicate no partial duplication among 95 % CI for each biome model (Table 2).
global SOC stock and a turnover rate of SOC decomposi-tion process. As has been reported in a CMIP5 experiment (Todd-Brown et al., 2013), our study has also shown that simulated global present-day SOC stocks in seven ecosys-tem models show high variation (1090–2646 Pg C) com-pared to the variation of global present-day VegC stocks (Fig. 2). There were some estimations available for global SOC stock, ranging from 700 (Bolin, 1970) to 3000 Pg C (Bohn, 1976). The most widely cited studies (Post et al., 1982; Batjes, 1996) estimated global SOC stock to be about 1500 Pg C (0–100 cm depth). However, in the CMIP5 ex-periment, the simulated global SOC stock by ESMs var-ied from 510 to 3040 Pg C (Todd-Brown et al., 2013). Even though the global SOC stocks for the year 2000 in this study were within range of those in Todd-Brown et al. (2013), this SOC stock uncertainty could still invoke future projection uncertainty in SOC dynamics. To test this issue, we esti-mated the global SOC standardized impact of each1T by
Hybrid CDF 60S 0 60N 0 0.5 1 JeDi CDF 60S 0 60N 0 0.5 1 JULES CDF 60S 0 60N 0 0.5 1 LPJmL CDF 60S 0 60N Latitude [ ° ] 0 0.5 1 SDGVM CDF 60S 0 60N 0 0.5 1 VISIT CDF 60S 0 60N 0 0.5 1 ORCHIDEE CDF 60S 0 60N
180W 90W 0 90E 180E
Longtitude [°]
0
0.5
1
∆SOC [kg−C m−2]
−12 8 −4 0 4 8 12
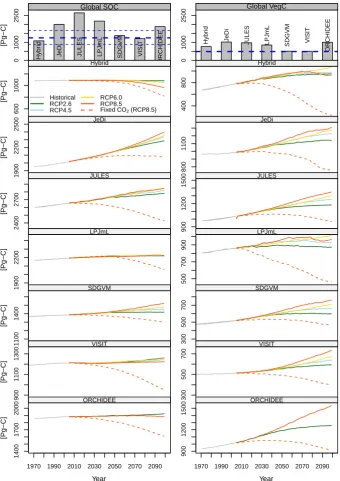
Fig. 4.
Maps of SOC changes by 2099 from 2000 and cumulative density function (CDF) in each biome
model in HadGEM RCP8.5. In the plot of CDF, red lines indicate 2.5 and 97.5 percentiles of SOC
changes.
34
Fig. 4. Maps of SOC changes by 2099 from 2000 and cumulativedensity function (CDF) in each biome model in HadGEM RCP8.5. In the plot of CDF, red lines indicate 2.5 and 97.5 percentiles of SOC changes.
0 50 100 150 200
SOC stock at 2000 [Pg−C for each 2.5°]
Latitude
(a)
Hybrid JeDi JULES LPJmL SDGVM VISIT ORCHIDEE HWSD
60S
0
60N
−15 −10 −5 0 5 10 15
SOC changes (2099 − 2000) [Pg−C for each 2.5°]
(b)
60S
0
60N
0 2 4 6 8 10 12
∆SOCCO2−FixedCO2 at 2099
[Pg−C for each 2.5°] (c)
60S
0
60N
0.0 0.5 1.0 1.5 2.0 2.5
∆SOCCO2−FixedCO2/∆VegCCO2−FixedCO2
[Ratio for each 2.5°]
60S
0
60N
Fig. 5.Latitudinal SOC stocks(a), SOC changes (2099–2000 in RCP8.5)(b), and indirect CO2effect on
SOC (CO2experiment – Fixed CO2experiment at 2099 in RCP8.5)(c), and indirect CO2effect on SOC
(CO2experiment – Fixed CO2experiment at 2099 in RCP8.5) in HadGEM. In (a), the line of HWSD
(broken black line) indicates the data from harmonized soil database (Hiederer and K¨ochy, 2011) 35
Fig. 5. Latitudinal SOC stocks (a), SOC changes (2099–2000 in RCP8.5) (b), and indirect CO2 effect on SOC (CO2 experiment–fixed
CO2experiment at 2099 in RCP8.5) (c), and indirect CO2effect on SOC (CO2experiment–fixed CO2experiment at 2099 in RCP8.5) in
HadGEM. In (a), the line of HWSD (broken black line) indicates the data from harmonized soil database (Hiederer and Köchy, 2011).
that the sensitivity of global SOC to1T varied among the biome models and that the present-day global SOC stock can be used to make more reliable SOC projections. Although actual global SOC stock estimation still has significant un-certainty, global SOC stock constraints are essential for re-ducing uncertainty in global SOC projections in ecosystem models.
Our simplified global dynamic model for the global SOC stock revealed that the balance of the global SOC stock turnover and input from VegC is quite different among the biome models, which further implies the different sensitivi-ties to1T of the global SOC stocks among the biome mod-els (Table 1). Hybrid4-simulated global SOC stocks decrease by 2099 in all RCPs because of the relatively high1T sen-sitivity in addition to the low turnover rate (high residence time) in VegC to SOC (Table 2, Friend et al., 2014). Al-though temperature is the most significant regulation fac-tor of SOC dynamics (Raich and Schlesinger, 1992), discus-sion of the effect of increasing global mean temperature on SOC stocks is still lacking. According to our statistical anal-ysis (Table 2), most biome models had adequate resolution to describe the global SOC stock change among the11◦C
(or 2◦C for SDGVM) difference in the projection period. In these models, the global mean temperature 1T could be a measure of the robustness of global SOC stock projection. However, the global SOC in JeDi was not sensitive to1T
in this projection period. According to our estimation, the highest global SOC sensitivity was observed in VISIT, in which the rate of global SOC stock change was enhanced by−6.95 Pg C yr−1in14◦C (Fig. 3). However, the highest magnitude of SOC decomposition stimulated by increasing
1T was observed in JULES (−8.13 Pg C yr−1in14◦C) due to high global SOC stock in JULES. The Carnegie–Ames– Stanford approach model showed global SOC decomposition sensitivity of 2.26 Pg C yr−11◦C−1, which is nearly equiv-alent to results obtained from JULES when the14◦C value was derived from simple extrapolation (Zhou et al., 2009). There is still a lack of observation-based estimation of global SOC response intensity to1T. Both global SOC stocks and data-oriented parameters such in Raich et al. (2002) could represent important information for the constraint and vali-dation of global SOC dynamics.
However,β2was not effective for global SOC dynamics in
that precipitation is not important in SOC dynamics. Precip-itation trends are globally heterogeneous; therefore, the rep-resentative1P might not be a useful index of SOC stock dy-namics at a global scale in this projection period. However, precipitation is quite important in both soil decomposition (Falloon et al., 2011) and vegetation processes (Seneviratne et al., 2006), which considerably contribute to regional SOC dynamics.
4.2 SOC stock changes from vegetation dynamics and regional aspect
There were consistent latitudinal (geographic) patterns among the biome models (Figs. 5a, 1), and the highest SOC stock was observed between 40 and 75◦N. However, we found that the amount of SOC stocks among the biome mod-els significantly vary in this region. The modmod-els’ SOC densi-ties are different, possibly because of the balance of input and decomposition and the consideration of depth in the biome models (1 to 3 m or not explicit, Table 1). Tarnocai et al. (2009) estimated SOC stock depth up to 3 m, with a value of 1672 Pg C in permafrost-affected regions only. Thus, the SOC stock of this region and the global SOC stock in the biome models may be significantly underestimated.
From a regional perspective, the biome models showed quite different spatial patterns of SOC changes under HadGEM RCP8.5 (Figs. 4, 5), while the spatial patterns of VegC changes were generally more consistent among the biome models (Friend et al., 2014). We found that this spa-tial heterogeneity among the biome models was also present in the SOC stock changes in different scenarios (data not shown). In particular, in boreal to arctic regions, SOC acts as a sink and source of C depending on the biome model (Fig. 5). This result indicates that there is an underlying mechanistic difference among the biome models in these re-gions. Two models show decreased SOC stocks by 2099 in this region in HadGEM RCP8.5. LPJmL shows unique fea-tures in SOC stocks and changes in this region. This implies that high SOC accumulations (over 80 kg-C m−2) (Figs. 5 and S1 in the Supplement) will be reduced with decreasing VegC by 2099 (Fig. S2 in the Supplement) in this region. This trend would result in low water availability in the permafrost regions, because the prediction is based on a mechanistic per-mafrost scheme (Beer et al., 2007; Schaphoff et al., 2013). Because LPJmL incorporated a freeze-and-thaw thermody-namics explicitly in discrete layers, it can simulate vertical water and carbon distributions in the model. This scheme en-ables LPJmL to describe the surface soil water deficit due to permafrost melting. Whereas, in Hybrid4, SOC decomposi-tion is the main factor contributing to reduced SOC in this region. Dynamic vegetation and freeze–thaw schemes are important for SOC dynamics in permafrost zones, because they provide more accurate prediction of the balance of C input from successive vegetation and old soil carbon decom-position (Schuur et al., 2008, 2009; Schaphoff et al., 2013).
However, in this study, dynamic vegetation and freeze–thaw schemes are only implemented in LPJmL. The potential re-lease from SOC in permafrost regions could have a large im-pact on the global C cycle (Koven et al., 2011; Burke et al., 2012; MacDougall et al., 2012), and further model develop-ment is essential for the modification of projections for this region.
Previous extensive field research has shown that the CO2
fertilizer effect on plant growth in higher CO2
concentra-tions could also result in the accumulation of SOC (De Graaff et al., 2006). For the RCP8.5 climate forcing, the fixed CO2
experiment suggested that the CO2fertilizer effect on plant
production contributed considerably to the global SOC stock increase in all biome models. The indirect CO2 fertilizer
effect on the global SOC stock varied from 93 (Hybrid4) to 264 Pg C (VISIT) (mean±SD; 196±60 Pg C) at the end of the simulation period, while VegC stock increased from 295 to 645 Pg C (275±150 Pg C) by 2099 because of in-creasing CO2(Figs. 2 and S2 in the Supplement). Thus, the
CO2 fertilizer effect on global SOC accumulation strongly
affects the biome models, and further quantitative assessment might be needed. For example, Friend et al. (2014) focused their attention on the effects of CO2fertilizers on biomass
production and turnover rate of biomass. In addition to the indirect CO2effects, other nutrient limitations (e.g., nitrogen
and phosphorus) and their sensitivities could be large sources of uncertainty in SOC projection via vegetation production (Goll et al., 2012; Exbrayat et al., 2013). In our study frame-work, we cannot adequately validate these issues since only a few models consider them in their current versions (e.g., Hy-brid4). Therefore, further interactions must be validated to more comprehensively understand the uncertainty sources in SOC projection.
A large variance in1SOCCO2−fixed CO2/1VegCCO2−fixed CO2
4.3 SOC modeling issues
The accurate estimation of the present-day global SOC stock remains difficult because of a lack of appropriate broad and non-destructive investigation techniques to measure SOC stock, such as satellite-based remote sensing. In fact, current SOC was formed in slow turnover fractions over thousands of years (Trumbore, 2000). Therefore, when getting an ini-tial SOC by the spin-up phase in biome models, there may not be enough information on the historical climate condi-tions and vegetation dynamics to duplicate in the entire SOC formation history. This is potentially one of the biggest is-sues for accurate estimation of SOC stock in biome mod-els. In addition, observations of global long-term SOC stock dynamics for model validation are limited. Thus, it is very difficult to assess projected global SOC trends in each biome model. Therefore, in addition to quantitatively understanding the SOC stock, deductive inferences based on the extensive understanding of the processes are essential for minimizing uncertainties in SOC stock prediction. For example, the ap-parent variability in global SOC sensitivity to1T may result from differences in model structures and parameters. Regard-ing temperature sensitivity and the magnitude of response to rising temperatures, the following topics require improve-ment: (i) SOC compartments and their turnover rates (Jones et al., 2005; Conant et al., 2011), (ii) the temperature sensi-tivity parameter (e.g.,Q10) (Davidson and Janssens, 2006;
Allison et al., 2010), and (iii) soil temperature prediction (ra-diation, heat production by microbes) (Luke and Cox, 2011; Khvorostyanov et al., 2008). In addition, microbial dynamics are a key component for the temperature acclimation of SOC decomposition (Todd-Brown et al., 2012; Wang et al., 2013). The acclimation response of SOC decomposition by micro-bial physiology is not included in the biome models used in this study. For SOC accumulation, soil mineralogical prop-erties control soil C turnover (Torn et al., 1997). However, the biome models do not exploit global soil classification in-formation (i.e., volcanic or non-volcanic soils), which still has significant uncertainties (Guillod et al., 2012; Hiederer and Köchy, 2011). In this study, peat and wetland soils are not explicitly simulated because of the large simulation grid size. Because of large carbon stock and water regime changes in future climates in such ecosystems, the SOC and soil-water-holding capacity feedback should also be considered in the SOC process in biome models (Ise et al., 2008). The interactions between SOC decomposition and nutrients (ni-trogen) are also influential factors for global SOC projection (Manzoni and Porporato, 2007).
However, the details of these processes are beyond the scope of this study; therefore, we did not explore these issues in depth. A more specific model intercomparison, such as an environmental-response-function-based assessment (e.g., Falloon et al., 2011; Sierra et al., 2012; Exbrayat et al., 2013) is recommended. Furthermore, land-use change is not included in our projection; however, the effect of land-use
changes on SOC dynamics is critical (Eglin et al., 2010). Es-timating land-use change with high confidence is essential for accurate global SOC stock projections and could be used as a basis for policies that moderate the impacts of climate change.
5 Conclusions
The uncertainties associated with SOC projections are sig-nificantly high. The projected global SOC stocks by 2099 act as CO2sources or sinks depending on the biome model,
even though models have similarly simulated historical SOC trends. The uncertainties of the SOC changes increase with higher forcing scenarios, and the global SOC stock change varies from −157 to 225 Pg C in HadGEM under RCP8.5 across biome models.
By adopting the simplified approach of global SOC as one compartment in the Earth system we can understand the comprehensive characteristics of each biome model on a global scale. The magnitude of SOC responses to global mean temperature increase considerably differed depending on the biome model. Our results confirmed that the SOC pro-cess implementations are dissimilar among the biome models at the global scale. In addition, global precipitation anoma-lies could not explain the simulated future global SOC stock changes. Moreover, the indirect CO2 fertilizer effect
con-tributed strongly to global SOC stock changes and projection uncertainties. For more reliable projections, both SOC dy-namics and vegetation processes require reliable global SOC stock estimation and region-based improvements.
Supplementary material related to this article is available online at http://www.earth-syst-dynam.net/5/ 197/2014/esd-5-197-2014-supplement.pdf.
Acknowledgements. The authors wish to thank the ISI-MIP
Japan. This study was also supported by the MEXT KAKENHI (no. 21114010). We also appreciate the editors, 3 reviewers, and Jeff Exbrayat (CCRC) for fundamental improvement of this manuscript.
Edited by: D. Lapola
References
Allison, S. D., Wallenstein, M. D., and Bradford, M. A.: Soil-carbon response to warming dependent on microbial physiology, Nat. Geosci., 3, 336–340, 2010.
Batjes, N.: Total carbon and nitrogen in the soils of the world, European J. Soil Sci., 47, 151–163, doi:10.1111/j.1365-2389.1996.tb01386.x, 1996.
Beer, C., Lucht, W., Gerten, D., Thonicke, K., and Schmullius, C.: Effects of soil freezing and thawing on vegetation carbon den-sity in Siberia: A modeling analysis with the Lund-Potsdam-Jena Dynamic Global Vegetation Model (LPJ-DGVM), Global Bio-geochem. Cy., 21, GB1012, doi:10.1029/2006GB002760, 2007. Best, M. J., Pryor, M., Clark, D. B., Rooney, G. G., Essery, R .L. H., Ménard, C. B., Edwards, J. M., Hendry, M. A., Porson, A., Gedney, N., Mercado, L. M., Sitch, S., Blyth, E., Boucher, O., Cox, P. M., Grimmond, C. S. B., and Harding, R. J.: The Joint UK Land Environment Simulator (JULES), model description – Part 1: Energy and water fluxes, Geosci. Model Dev., 4, 677–699, doi:10.5194/gmd-4-677-2011, 2011.
Bohn, H. L.: Estimate of organic carbon in world soils, Soil Sci. Soc. Am. J., 40, 468–470, 1976.
Bolin, B.: The carbon cycle, Scient. Am., 223, 125–132, 1970. Bonan, G. B., Hartman, M. D., Parton, W. J., and Wieder, W. R.:
Evaluating litter decomposition in earth system models with long-term litterbag experiments: an example using the Commu-nity Land Model version 4 (CLM4), Global Change Biol., 19, 957–974, 2013.
Breure, A., De Deyn, G., Dominati, E., Eglin, T., Hedlund, K., Van Orshoven, J., and Posthuma, L.: Ecosystem services: a use-ful concept for soil policy making!, Curr. Opin. Environ. Sus., 4, 578–585, 2012.
Burke, E. J., Hartley, I. P., and Jones, C. D.: Uncertainties in the global temperature change caused by carbon release from per-mafrost thawing, The Cryosphere, 6, 1063–1076, doi:10.5194/tc-6-1063-2012, 2012.
Clark, D. B., Mercado, L. M., Sitch, S., Jones, C. D., Gedney, N., Best, M. J., Pryor, M., Rooney, G. G., Essery, R. L. H., Blyth, E., Boucher, O., Harding, R. J., Huntingford, C., and Cox, P. M.: The Joint UK Land Environment Simulator (JULES), model descrip-tion – Part 2: Carbon fluxes and vegetadescrip-tion dynamics, Geosci. Model Dev., 4, 701–722, doi:10.5194/gmd-4-701-2011, 2011. Conant, R., Ryan, M., Ågren, G., Birge, H., Davidson, E.,
Elias-son, P., Evans, S., Frey, S., Giardina, C., Hopkins, F., Hyvö-nen, R., Kirschbaum, M. U. F., Lavallee, J. M., Leifeld, J., Par-ton, W. J., Megan Steinweg, J., Wallenstein, M. D., Martin Wet-terstedt, J. Å., and Bradford, M. A.: Temperature and soil or-ganic matter decomposition rates–synthesis of current knowl-edge and a way forward, Global Change Biol., 17, 3392–3404, doi:10.1111/j.1365-2486.2011.02496.x, 2011.
Davidson, E. and Janssens, I.: Temperature sensitivity of soil carbon decomposition and feedbacks to climate change, Nature, 440, 165–173, 2006.
De Graaff, M. A., Van Groningen, K. J. A. N., Six, J., Hungate, B., and van Kessel, C.: Interactions between plant growth and soil nutrient cycling under elevated CO2: A meta-analysis, Global
Change Biol., 12, 2077–2091, 2006.
Eglin, T., Ciais, P., Piao, S., Barre, P., Bellassen, V., Cadule, P., Chenu, C., Gasser, T., Koven, C., Reichstein, M., and Smith, P.: Historical and future perspectives of global soil carbon response to climate and land-use changes, Tellus B, 62, 700–718, 2010. Exbrayat, J.-F., Pitman, A. J., Zhang, Q., Abramowitz, G., and
Wang, Y.-P.: Examining soil carbon uncertainty in a global model: response of microbial decomposition to temperature, moisture and nutrient limitation, Biogeosciences, 10, 7095– 7108, doi:10.5194/bg-10-7095-2013, 2013.
Falloon, P., Jones, C., Ades, M., and Paul, K.: Direct soil mois-ture controls of fumois-ture global soil carbon changes: An impor-tant source of uncertainty, Global Biogeochem. Cy., 25, GB3010, doi:10.1029/2010GB003938, 2011.
Friedlingstein, P., Cox, P., Betts, R., Bopp, L., Von Bloh, W., Brovkin, V., Cadule, P., Doney, S., Eby, M., Fung, I., Bala, G., John, J., Jones, C., Joos, F., Kato, T., Kawamiya, M., Knorr, W., Lindsay, K., Matthews, H. D., Raddatz, T., Rayner, P., Reick, C., Roeckner, E., Schnitzler, K. G., Schnur, R., Strassmann, K., Weaver, A. J., Yoshikawa, C., and Zeng, N.: Climate-carbon cy-cle feedback analysis: Results from the C4MIP model intercom-parison, J. Climate, 19, 3337–3353, 2006.
Friend, A. D. and White, A.: Evaluation and analysis of a dynamic terrestrial ecosystem model under preindustrial conditions at the global scale, Global Biogeochem. Cy., 14, 1173–1190, 2000. Friend, A. D., Betts, R., Cadule, P., Ciais, P., Clerk, D., Dankers,
R., Falloon, P., Gerten, D., Itoh, A., Kahana, R., Keribin, R. M., Kleidon, A., Lomas, M. R., Nishina, K., Ostberg, S., Pavlick, R., Peylin, P., Rademacher, T. T., Schaphoff, S., Vuichard, N., Wilt-shire, A., and Woodward, F. I.: Anticipating terrestrial ecosystem response to future climate change and increase in atmospheric CO2, P. Natl. Acad. Sci. USA, 111, 3225–3227, 2014.
Goll, D. S., Brovkin, V., Parida, B. R., Reick, C. H., Kattge, J., Re-ich, P. B., van Bodegom, P. M., and Niinemets, Ü.: Nutrient lim-itation reduces land carbon uptake in simulations with a model of combined carbon, nitrogen and phosphorus cycling, Biogeo-sciences, 9, 3547–3569, doi:10.5194/bg-9-3547-2012, 2012. Guillod, B., Davin, E., Kündig, C., Smiatek, G., and Seneviratne,
S.: Impact of soil map specifications for European climate simu-lations, Clim. Dynam., 40, 1–19, 2012.
Heimann, M. and Reichstein, M.: Terrestrial ecosystem carbon dy-namics and climate feedbacks, Nature, 451, 289–292, 2008. Hempel, S., Frieler, K., Warszawski, L., Schewe, J., and Piontek, F.:
A trend-preserving bias correction – the ISI-MIP approach, Earth Syst. Dynam., 4, 219–236, doi:10.5194/esd-4-219-2013, 2013. Hiederer, R. and Köchy, M.: Global soil organic carbon
esti-mates and the harmonized world soil database, EUR 25225EN, Publ. Off. of the Eur. Union, Luxembourg, 2011.
Ise, T., Dunn, A., Wofsy, S., and Moorcroft, P.: High sensitivity of peat decomposition to climate change through water-table feed-back, Nat. Geosci., 1, 763–766, 2008.
Ito, A. and Inatomi, M.: Water-use efficiency of the terrestrial bio-sphere: a model analysis focusing on interactions between the global carbon and water cycles, J. Hydrometeorol., 13, 681–694, 2012.
Ito, A. and Oikawa, T.: A simulation model of the carbon cycle in land ecosystems (Sim-CYCLE): a description based on dry-matter production theory and plot-scale validation, Ecol. Model., 151, 143–176, 2002.
Jones, C., McConnell, C., Coleman, K., Cox, P., Falloon, P., Jenkin-son, D., and PowlJenkin-son, D.: Global climate change and soil carbon stocks; predictions from two contrasting models for the turnover of organic carbon in soil, Global Change Biol., 11, 154–166, 2005.
Khvorostyanov, D., Krinner, G., Ciais, P., Heimann, M., and Zimov, S.: Vulnerability of permafrost carbon to global warming, Part I: model description and role of heat generated by organic matter decomposition, Tellus B, 60, 250–264, 2008.
Koven, C., Ringeval, B., Friedlingstein, P., Ciais, P., Cadule, P., Khvorostyanov, D., Krinner, G., and Tarnocai, C.: Permafrost carbon-climate feedbacks accelerate global warming, P. Natl. Acad. Sci. USA, 108, 14769–14774, 2011.
Krinner, G., Viovy, N., de Noblet-Ducoudré, N., Ogée, J., Polcher, J., Friedlingstein, P., Ciais, P., Sitch, S., and Prentice, I.: A dynamic global vegetation model for studies of the coupled atmosphere-biosphere system, Global Biogeochem. Cy., 19, GB1015, doi:10.1029/2003GB002199, 2005.
Lal, R.: Soil carbon sequestration impacts on global climate change and food security, Science, 304, 1623–1627, 2004.
Lal, R.: Beyond Copenhagen: mitigating climate change and achieving food security through soil carbon sequestration, Food Secur., 2, 169–177, 2010.
Li, J., Wang, G., Allison, S., Mayes, M., and Luo, Y.: Soil carbon sensitivity to temperature and carbon use efficiency compared across microbial-ecosystem models of varying complexity, Bio-geochemistry, doi:10.1007/s10533-013-9948-8, in press, 2014. Luke, C. and Cox, P.: Soil carbon and climate change: from the
Jenkinson effect to the compost-bomb instability, Eur. J. Soil Sci., 62, 5–12, 2011.
MacDougall, A., Avis, C., and Weaver, A.: Significant contribution to climate warming from the permafrost carbon feedback, Nat. Geosci., 5, 719–721, doi:10.1038/ngeo1573, 2012.
Manzoni, S. and Porporato, A.: A theoretical analysis of nonlinear-ities and feedbacks in soil carbon and nitrogen cycles, Soil Biol. Biochem., 39, 1542–1556, 2007.
Mol, G. and Keesstra, S.: Soil science in a chang-ing world, Curr. Opin. Environ. Sus., 4, 473–477, doi:10.1016/j.cosust.2012.10.013, 2012.
Pavlick, R., Drewry, D. T., Bohn, K., Reu, B., and Kleidon, A.: The Jena Diversity-Dynamic Global Vegetation Model (JeDi-DGVM): a diverse approach to representing terrestrial biogeog-raphy and biogeochemistry based on plant functional trade-offs, Biogeosciences, 10, 4137–4177, doi:10.5194/bg-10-4137-2013, 2013.
Post, W., Emanuel, W., Zinke, P., and Stangenberger, A.: Soil car-bon pools and world life zones, Nature, 298, 156–159, 1982.
Raichi, J. W. and Schlesinger, W.: The global carbon dioxide flux in soil respiration and its relationship to vegetation and climate, Tellus B, 44, 81–99, 1992.
Raichi, J. W., Potter, C. S., and Bhagawati, D.: Interannual variabil-ity in global soil respiration, 1980–94, Global Change Biol., 8, 800–812, 2002.
R Core Team: R: A Language and Environment for Statistical Com-puting, available at: http://www.R-project.org/, R Foundation for Statistical Computing, Vienna, Austria,2012.
Ruesch, A. and Gibbs, H. K.: New IPCC Tier-1 global biomass car-bon map for the year 2000, Carcar-bon Dioxide Information Analysis Center (CDIAC), available at: http://cdiac.ornl.gov, Oak Ridge National Laboratory, Oak Ridge, Tennessee, 2008.
Schaphoff, S., Heyder, U., Ostberg, S., Gerten, D., Heinke, J., and Lucht, W.: Contribution of permafrost soils to the global car-bon budget, Environ. Res. Lett., 8, 014026, doi:10.1088/1748-9326/8/1/014026, 2013.
Schuur, E., Bockheim, J., Canadell, J., Euskirchen, E., Field, C., Goryachkin, S., Hagemann, S., Kuhry, P., Lafleur, P., Lee, H., Mazhitova, G., Nelson, F. E., Rinke, A., Romanovsky, V. E., Shiklomanov, N., Tarnocai, C., Venevsky, S., Vogel, J. G., and Zi-mov, S. A.: Vulnerability of permafrost carbon to climate change: Implications for the global carbon cycle, Bioscience, 58, 701– 714, 2008.
Schuur, E., Vogel, J., Crummer, K., Lee, H., Sickman, J., and Os-terkamp, T.: The effect of permafrost thaw on old carbon release and net carbon exchange from tundra, Nature, 459, 556–559, 2009.
Seneviratne, S., Lüthi, D., Litschi, M., and Schär, C.: Land– atmosphere coupling and climate change in Europe, Nature, 443, 205–209, 2006.
Sierra, C. A., Müller, M., and Trumbore, S. E.: Models of soil organic matter decomposition: the SoilR package, version 1.0, Geosci. Model Dev., 5, 1045-1060, doi:10.5194/gmd-5-1045-2012, 2012.
Sims, C. and Zha, T.: Bayesian methods for dynamic multivariate models, Int. Econ. Rev., 39, 949–968, 1998.
Sitch, S., Smith, B., Prentice, I., Arneth, A., Bondeau, A., Cramer, W., Kaplan, J., Levis, S., Lucht, W., Sykes, M., Thonicke, K., and Venevsky, S.: Evaluation of ecosystem dynamics, plant ge-ography and terrestrial carbon cycling in the LPJ dynamic global vegetation model, Global Change Biol., 9, 161–185, 2003. Sitch, S., Huntingford, C., Gedney, N., Levy, P., Lomas, M., Piao,
S., Betts, R., Ciais, P., Cox, P., Friedlingstein, P., Jones, C. D., Prentice, I. C., and Woodward, F. I.: Evaluation of the terres-trial carbon cycle, future plant geography and climate-carbon cycle feedbacks using five Dynamic Global Vegetation Models (DGVMs), Global Change Biol., 14, 2015–2039, 2008. Six, J., Conant, R., Paul, E., and Paustian, K.: Stabilization
mech-anisms of soil organic matter: implications for C-saturation of soils, Plant Soil, 241, 155–176, 2002.
Sollins, P., Homann, P., and Caldwell, B. A.: Stabilization and destabilization of soil organic matter: mechanisms and controls, Geoderma, 74, 65–105, 1996.
Tarnocai, C., Canadell, J., Schuur, E., Kuhry, P., Mazhitova, G., and Zimov, S.: Soil organic carbon pools in the northern circum-polar permafrost region, Global Biogeochem. Cy., 23, GB2023, doi:10.1029/2008GB003327, 2009.
Thum, T., Räisänen, P., Sevanto, S., Tuomi, M., Reick, C., Vesala, T., Raddatz, T., Aalto, T., Järvinen, H., Altimir, N., Pilegaard, K., Nagy, Z., Rambal, S., and Liski, J.: Soil carbon model alter-natives for ECHAM5/JSBACH climate model: Evaluation and impacts on global carbon cycle estimates, J. Geophys. Res., 116, G02028, doi:10.1029/2010JG001612, 2011.
Todd-Brown, K. E. O., Hopkins, F., Kivlin, S., Talbot, J., and Alli-son, S.: A framework for representing microbial decomposition in coupled climate models, Biogeochemistry, 109, 19–33, 2012. Todd-Brown, K. E. O., Randerson, J. T., Post, W. M., Hoffman, F. M., Tarnocai, C., Schuur, E. A. G., and Allison, S. D.: Causes of variation in soil carbon simulations from CMIP5 Earth system models and comparison with observations, Biogeosciences, 10, 1717–1736, doi:10.5194/bg-10-1717-2013, 2013.
Torn, M., Trumbore, S., Chadwick, O., Vitousek, P., and Hendricks, D.: Mineral control of soil organic carbon storage and turnover, Nature, 389, 170–173, 1997.
Trumbore, S.: Age of soil organic matter and soil respiration: radio-carbon constraints on belowground C dynamics, Ecol. Appl., 10, 399–411, 2000.
Wang, G., Post, W., and Mayes, M.: Development of microbial-enzyme-mediated decomposition model parameters through steady-state and dynamic analyses, Ecol. Appl., 23, 255–272, doi:10.1890/12-0681.1, 2013.
Warszawski, L., Frieler, K., Huber, V., Piontek, F., Serdeczny, O., and Schewe, J.: The Inter-Sectoral Impact Model Intercompar-ison Project (ISI-MIP): Project framework., P. Natl. Acad. Sci. USA, 111, 3228–3232, 2014.
Wershaw, R.: Model for humus in soils and sediments, Environ. Sci. Technol., 27, 814–816, 1993.
Woodward, F., Smith, T., and Emanuel, W.: A global land primary productivity and phytogeography model, Global Biogeochem. Cy., 9, 471–490, 1995.
Xia, J., Luo, Y., Wang, Y.-P., and Hararuk, O.: Traceable compo-nents of terrestrial carbon storage capacity in biogeochemical models, Global Change Biol., 2013.
Zhou, T., Shi, P., Hui, D., and Luo, Y.: Global pattern of temperature sensitivity of soil heterotrophic respiration (Q10) and its