www.nonlin-processes-geophys.net/20/965/2013/ doi:10.5194/npg-20-965-2013
© Author(s) 2013. CC Attribution 3.0 License.
Nonlinear Processes
in Geophysics
Correlation-based characterisation of time-varying dynamical
complexity in the Earth’s magnetosphere
R. V. Donner1,2and G. Balasis3
1Department of Biogeochemical Integration, Max Planck Institute for Biogeochemistry, Hans-Knöll-Straße 10, 07745 Jena, Germany
2Research Domain IV – Transdisciplinary Concepts & Methods, Potsdam Institute for Climate Impact Research, Telegrafenberg A31, 14473 Potsdam, Germany
3Institute for Astronomy, Astrophysics, Space Applications and Remote Sensing, National Observatory of Athens, I. Metaxa & Vas. Pavlou St., 15236, Penteli, Greece
Correspondence to: R. V. Donner ([email protected])
Received: 3 July 2013 – Revised: 23 September 2013 – Accepted: 26 September 2013 – Published: 12 November 2013
Abstract. The dynamical behaviour of the magnetosphere is known to be a sensitive indicator for the response of the system to solar wind coupling. Since the solar activity com-monly displays very interesting non-stationary and multi-scale dynamics, the magnetospheric response also exhibits a high degree of dynamical complexity associated with fun-damentally different characteristics during periods of quies-cence and magnetic storms. The resulting temporal complex-ity profile has been explored using several approaches from applied statistics, dynamical systems theory and statistical mechanics. Here, we propose an alternative way of looking at time-varying dynamical complexity of nonlinear geophys-ical time series utilising subtle but significant changes in the linear autocorrelation structure of the recorded data. Our ap-proach is demonstrated to sensitively trace the dynamic sig-natures associated with intense magnetic storms, and to dis-play reasonable skills in distinguishing between quiescence and storm periods. The potentials and methodological limi-tations of this new viewpoint are discussed in some detail.
1 Introduction
Accumulated evidence points to the complex nonlinear char-acter of magnetosphere dynamics. The seminal paper by Tsurutani et al. (1990) provided one of the first indications of nonlinear processes in the magnetosphere, claiming that there is a nonlinear response of the AE index to the south-ward component of the interplanetary magnetic field (IMF). Subsequently, several authors (Baker et al., 1990; Vassiliadis
et al., 1990; Sharma et al., 1993; Pavlos et al., 2003; Vörös et al., 2003) studied the occurrence of low-dimensional chaos in magnetospheric activity, while Klimas et al. (1996) dis-cussed the nonlinear characteristics of magnetosphere dy-namics and Angelopoulos et al. (1999) witnessed several as-pects of the dynamical complexity of the plasma sheet. Thus, recent advances in the study of complexity and complex sys-tems open new research perspectives to the investigation of the magnetospheric dynamics (Wanliss, 2005; Chang et al., 2010; De Michelis et al., 2012).
Dynamical complexity detection for output time series of complex systems is one of the foremost problems in physics, biology, engineering and economic sciences. Especially in geomagnetism and magnetospheric physics, accurate detec-tion of the dissimilarity between normal and abnormal states (e.g. pre-storm activity and magnetic storms) can vastly im-prove geomagnetic field modelling as well as space weather forecasting, respectively.
transforms (Balasis et al., 2006). This convergence between entropies and linear analyses provides a more reliable detec-tion of the transidetec-tion from the quiet-time to the storm-time magnetosphere, thus showing evidence that the occurrence of an intense magnetic storm is imminent.
Moreover, based on the general behaviour of complex sys-tem dynamics, it has been recently found that Dst time series exhibit discrete scale invariance, which in turn leads to log-periodic corrections to scaling that decorate the pure power law (Balasis et al., 2011c). The latter can be used for the determination of the time of occurrence of an approaching magnetic storm.
In this work, we propose a complementary view on the time-varying dynamical complexity of the Earth’s magneto-sphere by making use of higher-order characteristics based on the linear autocorrelation structure of Dst time series. Specifically, we modify a recent approach to quantifying the fraction of dynamically relevant variables in multivariate data sets, the linear variance decay (LVD) dimension density method (Donner and Witt, 2006), in such a way that it be-comes applicable to univariate time series. Subsequently, the method is applied to a well-studied part of the Dst time series covering the entire year of 2001, which exhibited two partic-ularly marked periods with several intense magnetic storms. Necessary details on both the method and the data are de-scribed in Sects. 2 and 3, respectively. The results of our analysis are summarised in Sect. 4, and indicate that the pro-posed measure has a good capability of tracing temporal vari-ations in the dynamical complexity of nonlinear geophysical time series as reflected in their linear autocorrelation struc-ture. The potentials and methodological limitations of this new approach are studied and discussed in detail. Finally, a methodological framework is proposed for comparing the performance of different dynamical characteristics display-ing signatures of time-dependent complexity in geophysical systems.
2 Method
In order to characterise the time-varying dynamical complex-ity of geophysical time series, we exploit some characteris-tic scaling properties associated with the linear autocovari-ance structure of the data. Specifically, we utilise a univari-ate variant of the recently proposed LVD dimension den-sity, which was originally introduced for studying temporal changes in the effective number of linearly independent com-ponents in multivariate geophysical recordings (Donner and Witt, 2006).
In the classical multivariate framework, the LVD dimen-sion density characterises the exponential decay of nor-malised residual variances when performing a dimensional-ity reduction based on the matrix of pairwise linear (Pearson) correlation coefficients between the individual components (i.e. a principal component analysis, PCA). Specifically, with
σi2being the eigenvalues of the correlation matrix given in descending order and normalised to unit sum, it has been shown (Donner and Witt, 2006) that one can find an approx-imate scaling law:
ρp= N
X
i=p+1 σi2
, N X
i=1
σi2'exp−p
N .
δ(p). (1)
The scaling parameterδ(p)characterises how fast the resid-ual variancesρpdecay towards zero, i.e. how much
dynami-cally relevant information is contained in the leading princi-pal components in comparison with the “background noise”. A continuous estimate of this parameter as a function of the fractionf ∈(0,1)of explained variance, which has been re-ferred to as the (non-normalised) LVD dimension density δ(f ), has been introduced by Donner and Witt (2006); details about the corresponding estimator have been given in Don-ner et al. (2008). Notably,f acts as a free parameter (though with typically only minor relevance for the estimator), which is typically chosen asf =0.95 orf =0.99 in many real-world situations.
Considering the theoretical minimum and maximum val-ues ofδ(f )(for perfectly linearly correlated or pairwise lin-early independent components, respectively), the normalised LVD dimension density is defined as (Xie et al., 2011)
δLVD(f )=
δ(f )−δmin(f )
δmax(f )−δmin(f ). (2)
Notably, we have δLVD=0 if all pairwise linear correla-tion coefficients between the components of the considered record approach±1, andδLVD=1 if they are linearly inde-pendent.
the estimates of δLVD obtained using this framework com-monly approach stationary values asNis increases (Donner, 2012)1.
3 Description of the data
The hourly Dst index values have been widely used as a proxy of the magnetospheric ring current strength and, con-sequently, the intensity of geospace magnetic storms, which are considered the most complex phenomenon of magne-tospheric dynamics (Gonzalez et al., 1994; Daglis, 2006). The Dst index is computed as the average change of the horizontal component of the Earth’s magnetic field recorded at four mid-latitude magnetic observatories (http://wdc.kugi. kyoto-u.ac.jp/index.html). Here, we consider about one year of Dst data (1 January 2001–31 January 2002) including two particularly intense magnetic storms, which occurred on 31 March 2001 and 6 November 2001 with minimum Dst values of−387 and−292 nT, respectively, as well as a number of weaker events (e.g. in May and August 2001 with Dst.−100 nT in both cases).
4 Results
4.1 Time-varying complexity
We obtain a quantitative characterisation of the time-varying dynamical complexity of the Earth magnetosphere in terms of the univariate normalised LVD dimension density (see Sect. 2), which is utilised here for the first time in a sliding window analysis. Specifically, we study the Dst time series for windows of widthwand a mutual offset of1w, using an “embedding” dimensionN < w−1w.
The results of our analysis for some reasonable choice of the method’s intrinsic parameters (see below for a more de-tailed discussion) are shown in Fig. 1. In general, we find the qualitative behaviour being relatively robust under modifica-tions of these parameters over a reasonable range. Specifi-cally, given a sufficiently large choice ofN which takes all relevant scales of magnetospheric dynamics (short-term fluc-tuations as well as relaxation processes to equilibrium con-ditions after magnetic storms) into account, we observe sev-eral distinct minima ofδLVD coinciding with the timing of intense magnetic storms. This result is understood as indicat-ing a very high degree of temporal organisation of the system (i.e. the system exhibits a continuous variability mode for a significant amount of time, representing storm onset and sub-sequent relaxation as persistent trends without remarkable stochastic fluctuations superimposed to this mode).
1Note that in a similar way, one could additionally consider multiples of a fixed time shiftτ (also known as embedding delay) for resolving the scaling properties with respect to a given basic timescale, an approach that we will not further discuss here. In the following, we will always considerτ=1 (the basic time unit as defined by the original sampling step of the data under study).
4.2 Comparison with other methods
The obtained results regarding qualitative changes in the dy-namical properties during intense magnetic storms coincide well with recent findings using frequency-domain character-istics as well as concepts from non-equilibrium statistical mechanics (see Fig. 2).
On the one hand, Balasis et al. (2006, 2011a) applied two independent estimates of the Hurst exponentH (Hurst, 1951) – a fractal spectral analysis technique based on wavelet transforms and the rescaled range analysis method – to the Dst index variations for 2001. Their analyses allowed for discrimination between normal and abnormal states of the magnetosphere by showing that the abnormal state (associ-ated with intense magnetic storms) complies with the frac-tional Brownian motion (fBm) model with persistent be-haviour (H >0.5), while, conversely, the normal state fol-lows the same model but with anti-persistent behaviour (H < 0.5).
On the other hand, Balasis et al. (2008, 2009) analysed the same Dst data set in terms of non-extensive Tsallis entropy (Tsallis, 1988). It is well known that the traditional Shannon entropy (Shannon, 1948) works best in dealing with systems composed of subsystems which can assess all the available phase space and which are either independent or interact via short-range forces. For systems exhibiting long-range cor-relations, memory or fractal properties, non-extensive Tsal-lis entropy becomes the most appropriate mathematical tool (Balasis et al., 2011b, d; Tsallis, 2011). A central property of magnetic storm emergence is the occurrence of coher-ent large-scale collective behaviour with a very rich struc-ture, resulting from repeated nonlinear interactions among the constituents of the global geospace system. In this re-spect, Tsallis entropy is an appropriate tool for identifying magnetic storm precursors. Specifically, it sensitively shows the dissimilarity of complexity among different “physiolog-ical” (normal) and “patholog“physiolog-ical” states (intense magnetic storms) – similar to the fBm Hurst exponent, Tsallis entropy implies the emergence of two distinct patterns: (i) a pattern associated with intense magnetic storms, which is charac-terised by a higher degree of organisation, and (ii) a pat-tern associated with normal (quiet-time) periods, which ex-hibits a lower degree of organisation. We stress that the anti-persistent time windows correspond to the time windows of high entropy, while the persistent time windows correspond to the time windows of low entropy.
0 50 100 150 200 250 300 350 −400
−300 −200 −100 0 100
Dst [nT]
0 50 100 150 200 250 300 350
−2 −1.5 −1 −0.5
Time [days in 2001]
log
10
(
δLVD
)
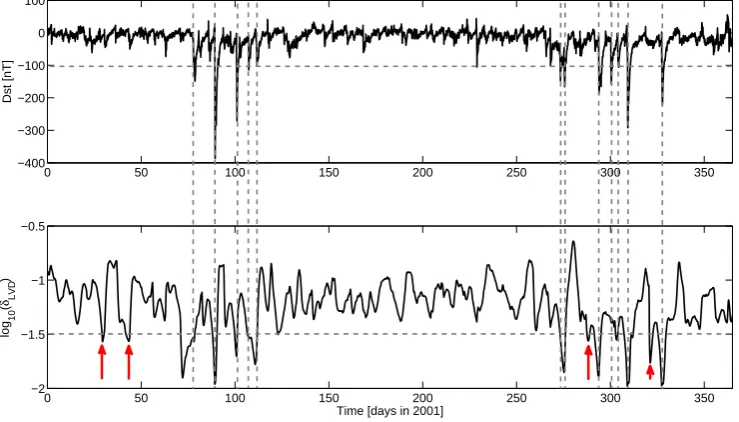
Fig. 1. Dst time series for the year 2001 (top) and temporal profile of the LVD dimension densityδLVD(in logarithmic scale) forf =0.95,
w=168 h,1w=1 h andN=96. For better visibility, intense magnetic storms are indicated by vertical dashed lines; almost all of them are characterised by particularly low values ofδLVD(the corresponding horizontal dashed line displayed in the lower panel is intended to guide the reader’s eye and does not represent any kind of optimality criterion for distinguishing between storm and quiescence periods). In turn, we find some additional episodes of lowδLVDwithout adjoint intense magnetic storms (marked by red arrows), pointing to a different kind of strong temporal organisation in the data over the considered time window.
Figure 1 demonstrates thatδLVDprimarily traces the grad-ual trend associated with the sudden drop in the Dst in-dex followed by the recovery of the magnetosphere, which provides the generic signature of intense magnetic storms. Specifically,δLVD is plotted as a function of the beginning of the time window of widthw=7 days used for its estima-tion (this choice ofwis motivated by the typical duration of magnetic storms including post-storm magnetospheric relax-ation phases as well as the intention of resolving temporal changes on the associated timescale; see Sect. 4.4 for further discussion). In this representation, most sharp minima of the LVD dimension density coincide precisely with the timing of intense magnetic storms, implying that the decrease in dy-namical complexity is actually associated with the recovery phase of the magnetosphere.
The latter behaviour is clearly different from the findings reported for the Hurst exponent and Tsallis entropy, which show consistent trends even considerably before and after the storm and thus can be thought of as indicating possible pre-cursory structures. However, note that besides their general trends, both the Hurst exponent and Tsallis entropy often ex-hibit sharp increases or decreases at the timing of a magnetic storm, respectively (Fig. 2) – whereas these signatures even enhance the trend towards persistent dynamics for the Hurst exponent, they actually decrease the discriminatory power of the Tsallis entropy by leading to values similar to those ob-tained during periods of magnetospheric quiescence.
4.3 Which properties are captured byδLVD?
There are multiple possible reasons for the apparently differ-ent behaviour ofδLVDin comparison with the other recently studied measures. In the following, we discuss some of these effects in order to develop a better understanding of the spe-cific properties captured by our “linear” complexity measure.
4.3.1 Short-range fluctuations vs. temporary trends
δLVDhas been previously found to often display a certain re-lationship with the decay of correlations as expressed by, for example, the lag-one autocorrelation value (Donner, 2012). In turn, systematic differences between the autocorrelation values of processes with short- and long-range memory can be expected to mainly exist at considerably large time in-crementsτ, which in turn would provide only minor contri-butions to the Toeplitz matrix of autocorrelations, and thus affect the scaling of the residual variances obtained from this matrix to a somewhat lesser extent. With this is mind,δLVD could be expected to be a less sensitive indicator for the type of persistence (which has been studied before in terms of the Hurst exponent, cf. Balasis et al., 2006, 2011a), but rather for the associated de-correlation time.
31/3 6/11 −400
−300 −200 −100 0
Dst
(nT)
0 30 60 120 150 180 210 240 270 330 360
−400 −300 −200 −100 0
31/3 6/11
0 0.25 0.5 0.75 1
Hurst exponent, H
0 30 60 120 150 180 210 240 270 330 360
0 0.25 0.5 0.75 1
31/3 6/11
0.25 0.4 0.55 0.7 0.85 1
Tsallis Entropy, S
q
0 30 60 120 150 180 210 240 270 330 360
0.25 0.4 0.55 0.7 0.85 1
31/3 6/11
0 0.05 0.1 0.15 0.2 0.25
Lin. Var. Dec., ä
LVD
0 30 60 120 150 180 210 240 270 330 360
0 0.05 0.1 0.15 0.2 0.25
Time (days) in 2001
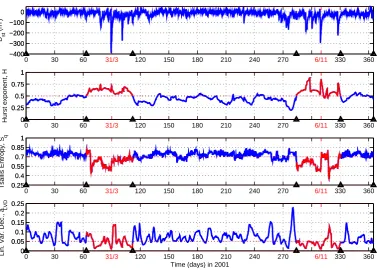
Fig. 2. From top to bottom: Dst time series along with time variations of Hurst exponent (H, wavelet spectra-based estimate of Balasis et al., 2006), Tsallis entropy (Sq) and linear variance decay dimension density (δLVD). The activity periods around 31 March and 6 November 2001 magnetic storms are marked red. In the subplot ofH, the red dashed line marks the transition between anti-persistent and persistent behaviour (H=0.5). In the subplot ofSq, the red dashed line gives a possible boundary value for the transition to lower complexity, characterising the
different state of the magnetosphere during intense magnetic storms. In the subplot ofδLVD, the red dashed line can be related to transitions between physiological and pathological behaviours of the magnetosphere during low and intense magnetic activity, respectively. The triangles denote five time intervals, in which the first, third and fifth intervals correspond to anti-persistent (0< H <0.5) epochs with high Tsallis entropies, whereas the second and fourth time windows exhibit persistent (0.5< H <1) behaviour of Dst with lower Tsallis entropies.
taken into account for the first time (i.e. for time windows starting aboutwtime steps before the storm). In turn, these drops are very well localised in time and persist only for a time interval of at most about one day before returning again to values close to 1 when data corresponding to the post-storm relaxation phase of the magnetosphere contribute. In this spirit, for the performed running window analysis, there is no clear relationship betweenδLVD and α1 like recently found within an ensemble of temperature time series (Don-ner, 2012), where the same methodology has been utilised for studying spatial patterns of average dynamical complex-ity over a time span of more than 50 yr.
The observed behaviour ofα1underlines that the autocor-relation function is generally sensitive to temporary trends associated with magnetic storms, and as such different mea-sures based on this function display different sensitivity with respect to changes in the short-term fluctuations contained in the data. Notably, this observation also applies to other techniques that do not make explicit use of detrending tech-niques.
300 310 320 330 340 350 360
−400 −200 0 200
Dst [nT]
300 310 320 330 340 350 360
0.4 0.6 0.8 1
Time [days in 2001]
α 1
In addition toδLVDandα1, we have also considered other eigenvalue-based measures (not shown), such as the (nor-malised) largest eigenvalueσ12as well as the associated par-ticipation ratio
PRσ12= N
N
X
j=1
|v1j|4
!−1 ,
which quantifies the degree of homogeneity with which all considered “modes” (i.e. time lags) contribute to the lead-ing eigenvectorv1=(v11, . . . , v1N)(Plerou et al., 2002). We
find that similar to the signature ofδLVD,σ12exhibits marked
peaks at the timing of the six strongest magnetic storms
within the considered observation period. In turn, the partic-ipation ratio behaves rather likeα1 in showing sharp min-ima at those time intervals ending with intense magnetic storms. Both observations taken together imply that both the largest eigenvalue andδLVD(being clearly influenced byσ12) trace the presence of gradual trends associated with storms and their associated recovery phases (i.e. take their max-ima/minima during time windows which fully cover such a large-scale pattern), whereas the associated eigenvector indi-cates the non-stationarity associated with the storm (which is most pronounced for time windows ending at the peak phase of the storm).
4.3.2 Linear vs. nonlinear statistical associations
As indicated by the interpretation of other dynamical char-acteristics (Sect. 4.2), magnetic storms are strongly nonlin-ear phenomena. In this regard, it is possible that some of the more subtle variations in the underlying nonlinear dynamics during magnetic storms are not sufficiently traced by linear autocorrelations yielding the foundation of the LVD dimen-sion density method.
In order to test this hypothesis, one possible way is to study a “nonlinear” version of this measure, where the lin-ear autocorrelation function is replaced by a nonlinlin-ear statis-tical association measure such as the (auto-)mutual informa-tion funcinforma-tion. Similar approaches using different measures of dynamical similarity have been recently used for reduc-ing the effect of non-Gaussianity in LVD dimension den-sity estimates for small multivariate data sets (Donner, 2011) and studying phase synchronisation processes in networks of coupled oscillators (Donner, 2008). Figure 4 displays the corresponding results, which are qualitatively consistent with those of the “linear” LVD dimension density. Specifically, the main storm periods (note that the emergence of intense mag-netic storms is typically clustered in time, which is consis-tent with the known persistence (H >0.5) of magnetic fluc-tuations during storm phases) are characterised by a marked reduction in temporal complexity, which appears, however, less marked than in the case of the linear version.
There are several reasons for the less clear signature of magnetic storms in the considered nonlinear dimension den-sity.
First, the typically required amount of data (i.e. window widthw) for properly estimating nonlinear interdependence measures is much larger than in the case of the linear (Pear-son) correlation function. In this spirit, the choice ofw con-sidered in most calculations presented here is most prob-ably too low to guarantee proper mutual information esti-mates, especially at large delays, i.e. small differencesw−N as studied here. Notably, these large delays most probably become particularly important in storm periods due to the presence of increased long-term memory. We emphasise that there are various competing estimators of mutual informa-tion, all of them sharing the problem of large variance (or even potential bias) at short time series lengths (Kraskov et al., 2004; Cellucci et al., 2005).
Second, the decay behaviour of the mutual information function is known to be different from that of the autocorre-lation function. This is already a consequence of the fact that mutual information is positive semi-definite, whereas linear correlations are not. Consequently, the considered Toeplitz matrix has only non-negative coefficients, which leads to an essentially different spectrum of eigenvalues (i.e. there are no studies on the presence of an approximate exponential decay of the residual sum of eigenvalues, which is the basis of the applied methodology). We do not further explore this point here, since it is beyond the scope of the present work.
Finally, there is the conceptual problem that the eigenval-ues of the mutual information matrix do not directly corre-spond to component variances of some statistical decompo-sition of the data (such as least-dependent component analy-sis based on mutual information minimisation, which would be the associated nonlinear counterpart of PCA (Stögbauer et al., 2004)). In this respect, the notion of “residual vari-ances” is not well defined either.
In general, the applied “brute-force” combination of linear and nonlinear approaches has severe methodological draw-backs in comparison with the “classical” LVD dimension density method, requires consideration of larger time win-dows, and is computationally much more demanding. Given these facts, further research is necessary to provide a fully operational “nonlinear” variant of the LVD dimension den-sity.
4.3.3 Beyond the exponential decay model
0 50 100 150 200 250 300 350 −400
−300 −200 −100 0 100
Dst [nT]
0 50 100 150 200 250 300 350
−0.5 −0.4 −0.3 −0.2 −0.1 0
Time [days in 2001]
log
10
(
δLVD
(MI)
)
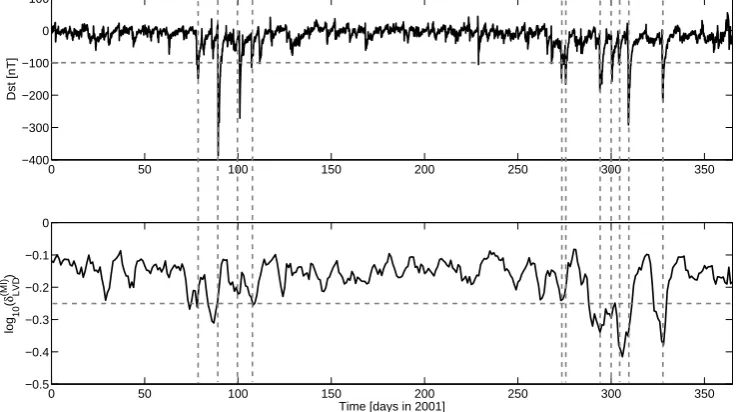
Fig. 4. As in Fig. 1 for a “nonlinear” version of the LVD dimension density (obtained with same values off,wandN, but1w=24 h) based on nearest-neighbour estimates of the (auto-)mutual correlation function introduced by Kraskov et al. (2004) (usingk=6 neighbours).
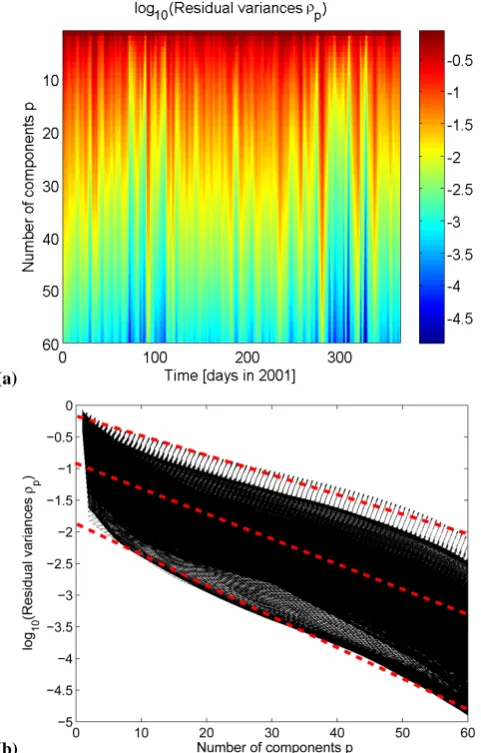
Instead of performing an explicit goodness-of-fit evalua-tion, Fig. 5 allows for a general visual assessment by dis-playing the logarithm of the residual variancesρp. As can
be seen, the overall behaviour can be reasonably well ap-proximated by an exponential model in all cases. Notably, during storm periods, we have a higherσ12 (see above) and thus generally smaller values ofρp for allp. As it follows
from Fig. 5, in such cases the decay of the residual vari-ances is considerably faster than during “normal” periods, which is expressed by lower values ofδLVD. This observa-tion confirms the already discussed linkage between δLVD andσ12, whereas there is no direct correspondence with other correlation-based statistics.
4.4 Performance analysis
In order to evaluate the performance ofδLVD as a means to detecting signatures of intense magnetic storms, a receiver-operating characteristics (ROC) analysis has been performed. For this purpose, we first coarse-grained the Dst time series into periods of width 1T (in the following, 1T =1 day). Regarding the timing of intense magnetic storms, we define a storm day as coinciding with one of these periods if at least 50 % of the hourly Dst values within the given time window fall below a threshold Dst value (Dst∗). For Dst∗= −100 nT (i.e. the common definition of an intense magnetic storm), we thus find 13 storm days, which are considered as “events” to be traced by extended minima ofδLVD. In order to estab-lish if the latter is indeed the case, we apply the same ap-proach to our complexity measure, but with a varying thresh-oldδ∗LVD. With increasingδLVD∗ , the fraction of correct “de-tections” of magnetic storms (true positive rate, TPR) nec-essarily converges towards 1, whereas the fraction of time
intervals without intense magnetic storm erroneously identi-fied as storm periods (false positive rate, FPR) rises as well. Plotting these two fractions against each other yields the ROC curve ofδLVDas a means of characterising the perfor-mance of this measure.
Figure 6 displays the obtained ROC curves for the same parameters as used before but with different values of the embedding dimensionN. It can be seen that the choice of N has only a minor influence on the resulting relationship between TPR and FPR, indicating a reasonable degree of robustness of our method. Moreover, since the ROC curves are not only clearly separated from the diagonal TPR = FPR (which would correspond to zero skills of our measure) but are also close to the limiting curve for a perfect discrimina-tion of storm periods (i.e. FPR = 0 for TPR<1 and TPR = 1 for FPR>0), we can judge thatδLVD displays a close rela-tionship with the underlying Dst index variability.
(a)
(b)
Fig. 5. (a) Residual variancesρp for running windows of the Dst
time series (same parameters as before). (b) Detailed inspection of the approximately exponential decay behaviour ofρp. Dashed red
lines visualise the typical scale of the decay, which is faster in the case of generally lower residual variances (the typical situation for intense magnetic storms) corresponding to lower values ofδLVD.
In turn, when fixing the embedding dimensionN=96 and increasing the window width w (thus decreasing the ratio N/w), we find the best discrimination forN/w≈0.7, i.e. window sizes of around six days. In this spirit, we conjecture that this value could represent an optimum window width for resolving the signatures of time-varying dynamical complex-ity in space weather covering all necessary timescales of vari-ability yet allowing for a reasonable temporal resolution. We emphasise that this timescale is in excellent agreement with previous values for the nonlinear magnetospheric dependen-cies inferred by Johnson and Wing (2005), who explored the nonlinear behaviour of the magnetosphere as characterised by another geomagnetic activity index, i.e. the planetary 3 h range index, Kp, which is, however, less suited for studying magnetic storms. They demonstrated that strong nonlinear
0 0.2 0.4 0.6 0.8 1
0 0.1 0.2 0.3 0.4 0.5 0.6 0.7 0.8 0.9 1
FPR
TPR
N=48 N=72 N=96 N=120
Fig. 6. ROC curve forδLVDobtained using different embedding di-mensionsN(w=168 h,1w=1 h,f=0.95). The dashed diago-nal line displays the relation TPR = FPR corresponding to vanishing discriminatory skills ofδLVD.
magnetospheric dependencies tend to peak on a timescale around 40–50 h, and are statistically significant up to one week. This is in accordance with not only the time windows used earlier for the fractal spectral analysis and to derive Tsallis entropic measures of the Dst data but is also in agree-ment with the time windows used in this study to estimate the associated LVD dimension densities.
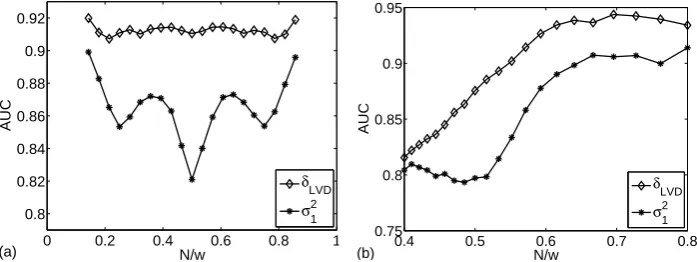
In order to fully explore the optimality of possible param-eter choices, it would be necessary to consider AUC with respect to the two-dimensional(N, w)space, possibly also taking further parameters of the method as additional vari-ables into account, such as f, the width 1T and phasing of the time intervals used for defining “events” for the ROC analysis, the threshold value Dst∗ for defining a storm, etc. To this end, we only highlight the possibility of performing such a more detailed analysis, and leave this open for fu-ture research activities. In a similar spirit, it is possible to extend the presented analysis to other dynamical characteris-tics (e.g. entropies, Hurst exponents and even further proper-ties). However, such a quantitative comparison between dif-ferent methodological approaches is beyond the scope of the present work.
5 Conclusions
0 0.2 0.4 0.6 0.8 1 0.8
0.82 0.84 0.86 0.88 0.9 0.92
N/w
(a)
AUC
δLVD σ12
0.4 0.5 0.6 0.7 0.8
0.75 0.8 0.85 0.9 0.95
N/w
(b)
AUC
δLVD
σ12
Fig. 7. Areas under the ROC curve AUC forδLVD(diamonds) andσ12(asterisks) in dependence onN(a,w=168 h) andw(b,N=96). In all cases,1w=1 h andf =0.95 have been used.
as time proceeds and thus appears widely applicable to data from a variety of different fields. Specifically, as we have shown,δLVDis largely influenced by the dominating “mode” of variability, e.g. short-term fluctuations, temporary trends, or even possible oscillatory patterns. In the same vein, if the associated main pattern type is changed,δLVDis expected to exhibit marked changes as well, which is supported by the present study. In order to avoid this behaviour and focus on only one specific timescale of variability, pre-filtering of the time series under study may present a reasonable method-ological extension of our proposed approach. We will further explore this possibility in future research.
It is important to note that there is no way to find an “op-timum” organisation or complexity measure (Kurths et al., 1995). Moreover, a combination of complexity measures, which refer to different aspects of a system, such as struc-tural versus dynamical properties, is the most promising way to deal with the complexity of a system. Figure 2 provides a synthesis of the results of three conceptually different com-plexity measures to the same Dst index time series, where each measure represents a different approach to the study of magnetosphere dynamics related to magnetic storms. Specif-ically, the Hurst exponent, non-extensive Tsallis entropy and univariate normalised LVD dimension density all catch dif-ferent aspects and features related to the complex charac-ter of the Earth’s magnetosphere as described in this study. In this spirit, although our new approach, which is utilised here for the first time in a sliding windows framework, gives results that are consistent with previously known findings, it provides a complemenatry view on magnetospheric com-plexity. Hence, we believe thatδLVDdoes not just provide an interesting alternative for characterising temporally varying complexity of magnetospheric fluctuations but could also be of interest in various other fields of application as an easily computable complexity measure.
We have successfully applied δLVD as a means to char-acterising time-varying dynamical complexity in the Earth’s magnetosphere associated with the emergence of magnetic storm periods. Unlike other measures like the Hurst exponent
or non-extensive Tsallis entropy, our characteristic is able to detect signatures directly associated with a magnetic storm event itself rather than changes in the dynamical properties in the preparatory phase. Along the same line,δLVD as consid-ered in this work appears unable to detect precursory struc-tures associated with strong magnetospheric perturbations. In turn, it allows for classifying the dynamical signatures of such activity phases a posteriori. Specifically, aδLVDvalue of 0.05 that has been used in Fig. 2 yields a reasonable bound-ary marking the different activity epochs of the quiet-time and storm-time magnetosphere. For the latter purpose, a de-tailed ROC analysis has revealed acceptable skills in discrim-inating between the dynamical characteristics during intense magnetic storms and periods of magnetospheric quiescence. The reduction in complexity with time could be related to the emergence of strong anisotropy in the system (recall that anisotropy is inherent to the system). The action of such strong anisotropy can lead to the appearance of a clearly pre-ferred direction of elementary activities (ion acceleration and earthward transport) before the main phase of the storm, i.e. to the massive and continuous earthward injection of acceler-ated ions. Theoretical and experimental evidence support the former hypothesis: throughout the entire main phase and dur-ing the early recovery phase of intense magnetic storms, the geometry of the energy flow produces a highly asymmetric ring current configuration (Daglis and Kozyra, 2002; Daglis et al., 2003).
Acknowledgements. This work has been financially supported by the joint Greek–German IKYDA 2013 project “Transdisci-plinary assessment of dynamical complexity in magnetosphere and climate: A unified description of the nonlinear dynamics across extreme events” funded by IKY and DAAD. G. Balasis additionally acknowledges partial support from the “Hellenic National Space Weather Research Network” co-financed by the European Union (European Social Fund – ESF) and Greek national funds through the Operational Program “Education and Lifelong Learning” of the National Strategic Reference Framework (NSRF) – Research Funding Program “Thales. Investing in knowledge society through the European Social Fund”. The Dst data are provided by the World Data Center for Geomagnetism, Kyoto (http://swdcwww.kugi.kyoto-u.ac.jp/). Valuable discussions with K. Eftaxias and C. Papadimitriou are gratefully acknowledged.
The service charges for this open access publication have been covered by the Max Planck Society.
Edited by: G. Lapenta
Reviewed by: two anonymous referees
References
Angelopoulos, V., Mukai, T., and Kokubun, S.: Evidence for intermittency in Earth’s plasma sheet and implications for self-organized criticality, Phys. Plasmas, 6, 4161–4168, doi:10.1063/1.873681, 1999.
Baker, D. N., Klimas, A. J., McPherron, R. L., and Büchner, J.: The evolution from weak to strong geomagnetic activity: An inter-pretation in terms of deterministic chaos, Geophys. Res. Lett., 17, 41–44, doi:10.1029/GL017i001p00041, 1990.
Balasis, G., Daglis, I. A., Kapiris, P., Mandea, M., Vassiliadis, D., and Eftaxias, K.: From pre-storm activity to magnetic storms: a transition described in terms of fractal dynamics, Ann. Geophys., 24, 3557–3567, doi:10.5194/angeo-24-3557-2006, 2006. Balasis, G., Daglis, I. A., Papadimitriou, C., Kalimeri, M.,
Anas-tasiadis, A., and Eftaxias, K.: Dynamical complexity in Dst time series using non-extensive Tsallis entropy, Geophys. Res. Lett., 35, L14102, doi:10.1029/2008GL034743, 2008.
Balasis, G., Daglis, I. A., Papadimitriou, C., Kalimeri, M., Anas-tasiadis, A., and Eftaxias, K.: Investigating dynamical complex-ity in the magnetosphere using various entropy measures, J. Geo-phys. Res., 114, A00D06, doi:10.1029/2008JA014035, 2009. Balasis, G., Daglis, I. A., Anastasiadis, A., and Eftaxias, K.:
De-tection of dynamical complexity changes in Dst time series us-ing entropy concepts and rescaled range analysis, in: The Dy-namic Magnetosphere, edited by: Liu, W. and Fujimoto, M., Springer, Berlin Heidelberg, 211–220, doi:10.1007/978-94-007-0501-2_12, 2011a.
Balasis, G., Daglis, I. A., Papadimitriou, C., Anastasiadis, A., Sand-berg, I., and Eftaxias, K.: Quantifying dynamical complexity of magnetic storms and solar flares via nonextensive Tsallis entropy, Entropy, 13, 1865–1881, doi:10.3390/e13101865, 2011b. Balasis, G., Papadimitriou, C., Daglis, I. A., Anastasiadis, A.,
Athanasopoulou, L., and Eftaxias, K.: Signatures of discrete scale invariance in Dst time series, Geophys. Res. Lett., 38, L13103, doi:10.1029/2011GL048019, 2011c.
Balasis, G., Papadimitriou, C., Daglis, I. A., Anastasiadis, A., Sand-berg, I., and Eftaxias, K.: Similarities between extreme events in the solar-terrestrial system by means of nonextensivity, Non-lin. Processes Geophys., 18, 563–572, doi:10.5194/npg-18-563-2011, 2011d.
Cellucci, C. J., Albano, A. M., and Rapp, P. E.: Statistical vidation of mutual information calculations: Comparison of al-ternative numerical algorithms, Phys. Rev. E, 71, 066208, doi:10.1103/PhysRevE.71.066208, 2005.
Chang, T., Wu, C. C., Podesta, J., Echim, M., Lamy, H., and Tam, S. W. Y.: ROMA (Rank-Ordered Multifractal Analyses) of inter-mittency in space plasmas – a brief tutorial review, Nonlin. Pro-cesses Geophys., 17, 545–551, doi:10.5194/npg-17-545-2010, 2010.
Daglis, I. A.: Ring current dynamics, Space Sci. Rev., 124, 183– 202, doi:10.1007/s11214-006-9104-z, 2006.
Daglis, I. A. and Kozyra, J. U.: Outstanding issues of ring current dynamics, J. Atmos. Solar-Terr. Phy., 64, 253–264, 2002. Daglis, I. A., Kozyra, J. U., Kamide, Y., Vassiliadis, D., Sharma,
A. S., Liemohn, M. W., Gonzalez, W. D., Tsurutani, B. T., and Lu, G.: Intense space storms: Critical issues and open disputes, J. Geophys. Res., 108, 1208, doi:10.1029/2002JA009722, 2003. De Michelis, P., Consolini, G., and Tozzi, R.: On the multi-scale nature of large geomagnetic storms: an empirical mode decom-position analysis, Nonlin. Processes Geophys., 19, 667–673, doi:10.5194/npg-19-667-2012, 2012.
Donner, R.: Advanced Methods for Analysing and Modelling of Multivariate Palaeoclimatic Time Series, Ph.D. thesis, University of Potsdam, Germany, 2007.
Donner, R.: Multivariate analysis of spatially heterogeneous phase synchronisation in complex systems: application to self-organised control of material flows in networks, Eur. Phys. J. B, 63, 349–361, doi:10.1140/epjb/e2008-00151-8, 2008.
Donner, R.: Spatial Correlations of River Runoffs in a Catchment, in: In Extremis, edited by: Kropp, J. and Schellnhuber, H.-J., Springer Berlin Heidelberg, 286–313, doi:10.1007/978-3-642-14863-7_14, 2011.
Donner, R. and Witt, A.: Characterisation of long-term cli-mate change by dimension esticli-mates of multivariate palaeocli-matic proxy data, Nonlin. Processes Geophys., 13, 485–497, doi:10.5194/npg-13-485-2006, 2006.
Donner, R. V.: Complexity Concepts and Non-Integer Dimensions in Climate and Paleoclimate Research, in: Fractal Analysis and Chaos in Geosciences, edited by: Ouadfeul, S.-A., InTech, Ri-jeka, 28 pp., doi:10.5772/53559, 2012.
Donner, R. V., Sakamoto, T., and Tanizuka, N.: Complexity of spatio-temporal correlations in Japanese air temperature records, in: Nonlinear Time Series Analysis in the Geosciences: Ap-plications in Climatology, Geodynamics and Solar-Terrestrial Physics, edited by: Donner, R. V. and Barbosa, S. M., Springer, Berlin Heidelberg, 124–154, doi:10.1007/978-3-540-78938-3_7, 2008.
Gonzalez, W. D., Joselyn, J. A., Kamide, Y., Kroehl, H. W., Rostoker, G., Tsurutani, B. T., and Vasyliunas, V. M.: What is a geomagnetic storm?, J. Geophys. Res., 99, 5771–5792, doi:10.1029/93JA02867, 1994.
Johnson, J. R. and Wing, S.: A solar cycle dependence of nonlinear-ity in magnetospheric activnonlinear-ity, J. Geophys. Res., 110, A04211, doi:10.1029/2004JA010638, 2005.
Klimas, A. J., Vassiliadis, D., Baker, D. N., and Roberts, D. A.: The organized nonlinear dynamics of the magnetosphere, J. Geophys. Res., 101, 13089–13113, doi:10.1029/96JA00563, 1996. Kraskov, A., Stögbauer, H., and Grassberger, P.:
Estimat-ing mutual information, Phys. Rev. E, 69, 066138, doi:10.1103/PhysRevE.69.066138, 2004.
Kurths, J., Voss, A., Saparin, P., Witt, A., Kleiner, H., and Wessel., N.: Quantitative analysis of heart rate variability, Chaos, 5, 88– 94, doi:10.1063/1.166090, 1995.
Pavlos, G. P., Athanasiu, M. A., Rigas, A. G., Sarafopoulos, D. V., and Sarris, E. T.: Geometrical characteristics of magnetospheric energetic ion time series: evidence for low dimensional chaos, Ann. Geophys., 21, 1975–1993, doi:10.5194/angeo-21-1975-2003, 2003.
Plerou, V., Gopikrishnan, P., Rosenow, B., Amaral, L. A. N., Guhr, T., and Stanley, H. E.: Random matrix approach to cross correlations in financial data, Phys. Rev. E, 65, 066126, doi:10.1103/PhysRevE.65.066126, 2002.
Shannon, C. E.: A mathematical theory of communication, Bell Syst. Techn. J., 27, 379–423, 1948.
Sharma, A. S., Vassiliadis, D. V., and Papadopoulos, K.: Re-construction of low-dimensional magnetospheric dynamics by singular spectrum analysis, Geophys. Res. Lett., 20, 355–358, doi:10.1029/93GL00242, 1993.
Stögbauer, H., Kraskov, A., Astakhov, S. A., and Grass-berger, P.: Least-dependent-component analysis based on mutual information, Phys. Rev. E, 70, 066123, doi:10.1103/PhysRevE.70.066123, 2004.
Toonen, C., Lappe, D., Donner, R., and Scholz-Reiter, B.: Im-pact of Machine-Driven Capacity Constellations on Perfor-mance and Dynamics of Job-Shop Systems, in: Enabling Man-ufacturing Competitiveness and Economic Sustainability, edited by ElMaraghy, H. A., Springer Berlin Heidelberg, 611–616, doi:10.1007/978-3-642-23860-4_100, 2012.
Tsallis, C.: Possible generalization of Boltzmann-Gibbs statistics, J. Stat. Phys., 52, 479–487, doi:10.1007/BF01016429, 1988. Tsallis, C.: The nonadditive entropy Sq and its applications in
physics and elsewhere: Some remarks, Entropy, 13, 1765–1804, doi:10.3390/e13101765, 2011.
Tsurutani, B. T., Sugiura, M., Iyemori, T., Goldstein, B. E., Gonzalez, W. D., Akasofu, S. I., and Smith, E. J.: The nonlinear response of AE to the IMF BS driver: A
spec-tral break at 5 hours, Geophys. Res. Lett., 17, 279–282, doi:10.1029/GL017i003p00279, 1990.
Vassiliadis, D. V., Sharma, A. S., Eastman, T. E., and Papadopou-los, K.: Low-dimensional chaos in magnetospheric activity from AE time series, Geophys. Res. Lett., 17, 1841–1844, doi:10.1029/GL017i011p01841, 1990.
Vörös, Z., Baumjohann, W., Nakamura, R., Runov, A., Zhang, T. L., Volwerk, M., Eichelberger, H. U., Balogh, A., Horbury, T. S., Glaßmeier, K.-H., Klecker, B., and Rème, H.: Multi-scale mag-netic field intermittence in the plasma sheet, Ann. Geophys., 21, 1955–1964, doi:10.5194/angeo-21-1955-2003, 2003.
Wanliss, J. A.: Fractal properties of SYM-H during quiet and active times, J. Geophys. Res, 110, A03202, doi:10.1029/2004JA010544, 2005.