www.atmos-meas-tech.net/8/1043/2015/ doi:10.5194/amt-8-1043-2015
© Author(s) 2015. CC Attribution 3.0 License.
A new Dobson Umkehr ozone profile retrieval method optimising
information content and resolution
K. Stone1,2, M. B. Tully3, S. K. Rhodes3, and R. Schofield1,2
1School of Earth Sciences, University of Melbourne, Victoria, 3010, Australia
2ARC Centre of Excellence for Climate System Science, University of New South Wales, Sydney,
New South Wales, 2052, Australia
3Bureau of Meteorology, Melbourne, Victoria, 3001, Australia Correspondence to: K. Stone ([email protected])
Received: 13 June 2014 – Published in Atmos. Meas. Tech. Discuss.: 19 August 2014 Revised: 5 February 2015 – Accepted: 9 February 2015 – Published: 4 March 2015
Abstract. The standard Dobson Umkehr methodology to re-trieve coarse-resolution ozone profiles used by the National Oceanographic and Atmospheric Administration uses desig-nated solar zenith angles (SZAs). However, some informa-tion may be lost if measurements lie outside the designated SZA range (between 60◦and 90◦), or do not conform to the fitting technique. Also, while Umkehr measurements can be taken using multiple wavelength pairs (A, C and D), past retrieval methods have focused on a single pair (C). Here we present an Umkehr inversion method that uses measure-ments at all SZAs (termed operational) and all wavelength pairs. (Although, we caution direct comparison to other al-gorithms.)
Information content for a Melbourne, Australia (38◦S, 145◦E) Umkehr measurement case study from 28 Jan-uary 1994, with SZA range similar to that designated in previous algorithms is shown. When comparing the typical single wavelength pair with designated SZAs to the opera-tional measurements, the total degrees of freedom (indepen-dent pieces of information) increases from 3.1 to 3.4, with the majority of the information gain originating from Umkehr layers 2+3 and 4 (10–20 km and 25–30 km respectively). In addition to this, using all available wavelength pairs in-creases the total degrees of freedom to 5.2, with the most significant increases in Umkehr layers 2+3 to 7 and 9+(10– 40 and 45–80 km). Investigating a case from 13 April 1970 where the measurements extend beyond the 90◦SZA range
gives further information gain, with total degrees of freedom extending to 6.5. Similar increases are seen in the informa-tion content. Comparing the retrieved Melbourne Umkehr
time series with ozonesondes shows excellent agreement in layers 2+3 and 4 (10–20 and 25–30 km) for both C and A+C+D-pairs. Retrievals in layers 5 and 6 (25–30 and 30– 35 km) consistently show lower ozone partial column com-pared to ozonesondes. This is likely due to stray light effects that are not accounted for in the forward model, and under represented stratospheric aerosol.
1 Introduction
Dob-son Umkehr measurements began in the 1960s at the sites of Melbourne (38◦S, 145◦E), Brisbane (27◦S, 153◦E), Darwin
(12◦S, 131◦E), Macquarie Island (55◦S, 159◦E), and Perth
(32◦S, 116◦E). However, only three sites are still currently in operation: Perth, run by National Oceanographic and At-mospheric Administration (NOAA), Brisbane, and Darwin, noting also that measurements at Darwin suffered a hiatus period between 1972 and 1991. The remaining Australian-run sites ceased operating in the early 1990s. The processing of the Umkehr data, using the NOAA retrieval procedure, for the ongoing Australian sites at Perth and Brisbane are up to date. However, retrievals from the Darwin site have not been performed since 2000, leaving an important gap in the Aus-tralian Dobson data network.
The first algorithm constructed for consistent use among the global Dobson network was that by Mateer and Dütsch (1964). This algorithm was updated by Mateer and DeLuisi (1992) to incorporate optimal estimation retrieval techniques developed by Rodgers (1976, 1990). The a priori ozone pro-files used by Mateer and DeLuisi (1992) were constrained by coinciding measurements of total column ozone. This in-troduced a time-dependent bias to the a priori profiles that can affect the analysis of long-term trends, most notably in the troposphere (Dütsch and Staehelin, 1992; Mateer et al., 1996; Petropavlovskikh et al., 2004, 2005). Variability intro-duced by constraining the a priori profiles to total column ozone was removed in the updated NOAA-based algorithm by Petropavlovskikh et al. (2005), which was optimised for ozone layer trend analysis. To further reduce the a priori in-fluence on the derived trends, the construction of the a pri-ori covariance matrix, used as a smoothing constraint on the retrieval, was also updated to include full covariance recom-mendations from Rodgers (2000).
All algorithms to date use designated SZAs (60◦, 65◦, 70◦, 74◦, 77◦, 80◦, 83◦, 85◦, 86.5◦, 88◦, 89◦ and 90◦) by fitting a spline through the operational measurement data. This has the benefit of streamlining the retrieval process, but also means that only an approximation of the actual observed measurements are used. Data are not used if it is outside the designated SZA range and information can be lost if the data are not well represented. Further, while the Dobson spec-trometer is capable of taking Umkehr measurements using three separate wavelength pairs (A, C and D), current algo-rithms only make use of one wavelength pair (C), while a previous study used all wavelength pairs in a “short” Umkehr method (Deluisi et al., 1985). To obtain the maximum in-formation from the Australian measurements these consid-erations are important, because, especially during the earlier years, it was common for measurements at Australian sites to extend beyond the typical SZA range or not use consistent SZAs, and also at times, to use multiple wavelength pairs.
The algorithm presented here is based on the optimal es-timation technique described by Rodgers (2000), and used by Petropavlovskikh et al. (2005), from which, however, it has two major differences as stated above: it is set up to use
the operational measurements from all SZAs, and it uses all available wavelength pairs in the retrieval. Using the opera-tional measurements at their associated SZAs allows the use of interactive refraction in the forward model.
The scope of this paper is focused on investigating the benefits of these changes to the Umkehr retrieval technique. Due to this, important components of the retrieval algorithm have been left out, such as: multiple scattering, surface reflec-tion correcreflec-tions, stray light effects, and more robust aerosol corrections. Multiple scattering and surface reflectivity have a small effect on the retrieval, but are nonetheless important and it is planned that they be implemented in the future. The associated effects of these components have been described by Petropavlovskikh et al. (2004). Errors due to aerosols have a larger impact and have previously been described extensively (Dave, 1972a, b; Mateer and DeLuisi, 1992; Petropavlovskikh et al., 2004). Instrumental stray light ef-fects can also have a significant effect, with Petropavlovskikh et al. (2011) reporting a negative stratospheric retrieval bias for C-pair Umkehr retrievals. Thus, due to these deficiencies, we caution the direct comparison of the algorithm presented here to other algorithms.
The Umkehr observations and how they are simulated in the forward model will first be described, followed by a de-scription of the inversion technique. An analysis of the infor-mation content of the retrievals for a case study at the site of Melbourne will be presented, as well as a comparison of the retrieved Melbourne time series with ozonesonde data.
2 Dobson Umkehr observations
The interaction of solar radiation with the atmosphere is de-pendent heavily on the SZA. Thus, the zenith sky measure-ment technique has been described extensively in the past (Solomon et al., 1987), and has been used with different in-struments to retrieve multiple different products (for exam-ple, Hendrick et al., 2004; Schofield et al., 2004b). In the Umkehr technique, the typical UV wavelength pairs used with the Dobson instrument are: A, C and D at 305.5, 325.4; 311.4, 332.4; and 317.6, 339.8 nm respectively, where the shorter UV wavelength within each pair is more strongly ab-sorbed by ozone compared to the longer wavelength.
0 0.005 0.01 0.015 0.02 0.025 0.03 0.035 0.04 0
5
10
15
20 25 30 35 40
45
50
A
lti
tu
de
(k
m
)
Intensity
0
1 2
3
4 5
6
Ozone number density (×1012molecules/cm3)
75◦ 80◦ 83◦ 85◦ 87◦ 90◦
¯
Iλ1 ¯Iλ2 Ozone profile Ozone maximum
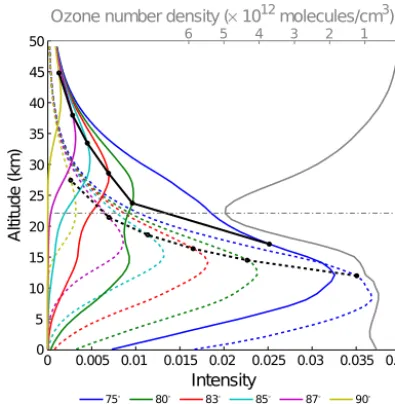
Figure 1. Zenith sky intensity contribution curves for C-pair
wave-lengths at selected SZAs for 28 January 1994. Intensity values are arbitrary. The black curves show the weighted average height for each curve. Dashed lines correspond to the longer wavelength, while solid lines correspond to the shorter wavelength. An ozone profile with highlighted ozone maximum is also plotted for refer-ence.
Here, the weighted average height is seen to be consistently higher for the shorter wavelength compared to the longer wavelength. The intensities of the shorter wavelength also decrease in magnitude with increasing SZA much faster than the longer wavelength while the weighted average height is below the ozone maximum. This is expected as the shorter wavelength is more strongly absorbed by ozone. When the shorter wavelength weighted average height goes above the ozone maximum, at a SZA of around 80◦, the intensity be-gins to decrease more slowly. Because this decrease is slower than the longer wavelength, where the intensity-weighted av-erage height is still below the ozone maximum, this leads to a point of inflection in the N value curve, which is the be-ginning of the turnaround in the N value curve. When the weighted average height of the longer wavelength also goes above the ozone maximum, seen here between 87◦and 90◦, a second point of inflection is expected, leading onto another turnaround in theN value curve at higher SZA.
TheNvalues are described formally as (Petropavlovskikh et al., 2004)
N =100 log10F
0
0×K
0×I0
F0×K×I
, (1)
where the prime denotes the longer wavelength,F is the ex-traterrestrial solar flux,Kis the instrument parameter andI is the intensity measured by the instrument. The instrument parameters are unknown and thus cannot be included within the forward model. Also, the extraterrestrial solar flux is not
known accurately. Therefore, normalisation of the measure-ments is required. This is done by subtracting the lowest SZA N value from the fullN value measurement vector for each subsequent wavelength pair. In the case of cloudy days, an offset can be introduced into the measurement. If this offset is present at the normalisation angle, it can be introduced into the retrieval. This is currently not taken into account.
In some cases, measurements are taken at SZAs that ex-ceed 90◦, which is the cut-off for Umkehr algorithms that use designated SZAs. Measurements taken at higher SZA will contain more information from the upper atmosphere, as can be discerned from Fig. 1, where the weighted average heights are situated at around 27 and 46 km at a SZA of 90◦ for the C-pair long and short wavelengths respectively, and continue to increase as SZA increases. Due to the combina-tion of low intensities and large intensity ratios received at the detector for high SZAs near the turn-around point, errors can be introduced due to stray light effects, which are cur-rently not taken into account. These errors have been shown to have minimal effect on C-pair Umkehr-derived, long-term ozone trends (Petropavlovskikh et al., 2011). Stray light ef-fects on Umkehr-derived time series are likely to be consis-tent if the same instrument is in operation for the duration of the time series. However, a step change may accompany in-strument replacements. As theN value is a ratio of intensity values that are referenced to the lowest SZA, the offsets due to multiple scattering on the absolute intensities are mostly removed (Hendrick et al., 2006). Taking measurements be-yond a SZA of 90◦also introduces ozone diurnal effects that have consequences above 50 km, but is expected to be negli-gible due to the low ozone concentration at these altitudes. 2.1 Measurement uncertainty
The measurement uncertainties are constructed from those used by Petropavlovskikh et al. (2004). They are dependent on SZA, with relatively small errors at low SZA and increas-ing error at high SZA. The errors are extended beyond 90◦ through a spline interpolation. As the uncertainties were orig-inally constructed for C-pair only measurements, and the ma-jority of measurements at Australian sites are taken manu-ally, the values have been scaled to account for human error and potentially larger errors present in A+C+D-pair measure-ments, for which we have used a factor of 10.
3 Dobson Umkehr simulations
The forward model simulates measurements for a given at-mospheric state, such that
y=F (x,b)+, (2)
forward model parameters that are known, such as temper-ature and pressure, and is the measurement uncertainty (Rodgers, 2000). Seasonal- and latitudinal-dependent tem-perature, pressure, and a priori ozone profiles are constructed from the binary database of profiles and the vertically re-solved ozone database (Hassler et al., 2008, 2009). A sim-ple aerosol profile is also included based on that used by Schofield et al. (2004a) for the site of Lauder, New Zealand. The aerosol extinction values are given for 500 nm and are scaled to be used with the Umkehr wavelengths by
Scale factor= 500
λ 1.2
. (3)
3.1 Radiative transfer model
The radiative transfer model is set up using spherical geome-try to describe the ray tracing of light through the atmosphere (Rodgers, 2000), and is similar to that described in Schofield et al. (2004a). This includes scattering, absorption and re-fraction of light as it passes through 80 vertical layers with 1 km vertical resolution.
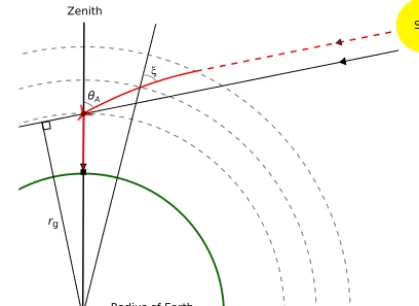
Inclusion of interactive refraction is required as the op-erational measurements are used in the retrieval rather than fixed values of SZA. Calculation of the atmospheric refrac-tive index follows that of Bucholtz (1995). The refracted ray path is calculated by using Snell’s law in circular symmetry to obtain the geometric impact parameter:
rg=n(r)rsin(θT), (4)
wheren(r) is the refractive index,r is the altitude andθT
is the true SZA associated with the unrefracted path. Here, θT is calculated from the time the measurements were taken.
From this equation the SZA associated with any point along the path is calculated, which in turn can be used to calculate the path lengths for each discrete layer of the forward model atmosphere.
The Rayleigh scattering cross-sections and phase func-tions are taken from Bucholtz (1995). Mie scattering cross-sections and phase functions are also included for scattering and absorption from atmospheric aerosols. As the state pa-rameter is ozone, the ozone cross-section is also required. This is a measure of the probability of single-scattering events along the zenith downwards into the Dobson spec-trometer, as well as the scattering and absorption of light be-fore and after the zenith scattering event.
Using the calculated refracted light paths, the Rayleigh and Mie scattering sections, and the ozone cross-sections, the intensities received at the detector from each wavelength can be simulated. The intensity equation follows Beer–Lambert’s law and is described as
I =I∗exp(−σYNYs), (5)
where I∗ is the intensity without the absorber Y present (ozone in this case),σis the absorber cross-section,Nis the
rg
θA
Radius of Earth Zenith
Sun
ξ
Figure 2. Refracted ray path for a single zenith sky scattering event,
highlighting the geometric impact parameter (rg), the apparent SZA (θA) and the local SZA (ξ).
absorber concentration and s is the optical path traversed. The model is set up to use the ozone cross-section as de-scribed by Bass and Paur (1985), but can also use the more recent ozone cross-section studies by Daumont et al. (1992) and Gorshelev et al. (2014). However, the effect of the ozone cross-section used in C-pair Umkehr retrieval algorithms was studied by Petropavlovskikh et al. (2011) and found to have minimal effect.
As the Umkehr method measures the sum of all radiation scattered downwards from the zenith, the intensity is calcu-lated, such that
I=I0 N X
z=0
(βRay(θA, λ, z)+βMie(θA, λ, z))exp[−τ (z)]1z, (6)
whereβRay and βMie are the Rayleigh and Mie extinction
coefficients,I0is the arbitrary intensity before absorption,z
is the scattering altitude,λis the wavelength and θA is the
apparent SZA.τ is the optical depth, described as
τ (z)=
N
X
l=0
(βY(λ, l, ξ )+βRay(λ, l)+βMie(λ, l))s(l, z), (7)
wherelis the model layer,ξ is the local SZA andβY is the
ozone extinction coefficient.
Using the calculated intensity values, theNvalue is calcu-lated following Eq. (1). An illustration of the propagation of light through the atmosphere with a single scattering event is shown in Fig. 2, highlightingrg,θAandξ.
4 Inversion model
optimal estimation technique uses a maximum likelihood es-timation procedure as described by Rodgers (2000), where the optimal estimation iterative equation is
xi+1=xa+SaKiT KiSaKTi +S
−1
(y−F(xi)+Ki(xi−xa)), (8) wherexi+1is the iterative ozone profile retrieval, xi is the
retrieval from the previous iteration,xais the ozone a priori,
Kiis the weighting function from the previous iteration, used
to describe the sensitivity of the state to changes in ozone,y
is the measurement vector andF(xi)is the simulated
mea-surement vector.
The inversion technique is set up to use a measurement vector from any combination of wavelength pairs, allowing comparison of respective retrieved profiles. The procedure is started from the ozone a priori. The a priori ozone is set up as a monthly climatological average from 1979–2006 from Has-sler et al. (2009) that are not constrained to the total ozone column; this ensures that any retrieved trend information is independent of the a priori, consistent with Petropavlovskikh et al. (2005). The iterative procedure is run until convergence is reached.
4.1 A priori errors
The a priori covariance matrix (Sa) in this work uses monthly
standard deviations from zonally averaged ozone profiles from Hassler et al. (2009), spanning the time period from 1979–2006. The standard deviations calculated are used to determine the variance, used as the diagonal elements for Sa.
The off-diagonal elements are set to zero, and the variance above 35 km is consistently reduced as altitude increases. Sa
is then adjusted to determine the appropriate relationship be-tween error and information retrieval. This is done by con-structing an L-curve on select C-pair and A+C+D-pair re-trievals, where Sa is scaled from small to large values and
plotted against the root mean square (rms) of the retrievals to the measurements. The scaling value chosen is when there is no significant difference in the rms as the scaling fac-tor increases. The value derived from the selected retrievals is consistent for both the C and A+C+D-pair retrievals, and is used for all other retrievals. An option is also in-cluded to allow Sato be set up following Rodgers (2000) and
Petropavlovskikh et al. (2005), which includes non-diagonal elements such that
Sa=σa2exp
−|i−j|∂z h
, (9)
whereiandj are the vector elements of matrix Sa,σa2
con-stitutes the diagonal elements of the matrix,∂zis the change in altitude, and h is the half width at half maximum, and is used for the choice of correlation length between altitude levels, which has an impact on the amount of information able to be retrieved (Hendrick et al., 2004). The effect of us-ing these two methods to produce Sa has been discussed in
Table 1. Umkehr layer setup.
Umkehr layer Altitude (km)
0+1 0–10
2+3 10–20
4 20–25
5 25–30
6 30–35
7 35–40
8 40–45
9+ 45–top of atmosphere
Petropavlovskikh et al. (2005). Results shown in this paper have used the first method for the set-up of Sa.
4.2 Averaging kernels and layering system
To describe how the retrieved profile smooths the true atmo-spheric state, the averaging kernel matrix (A) is used, made up of averaging kernels for each altitude. An ideal A with no smoothing would be defined as the identity matrix. A is es-sential for understanding the information content from each retrieved altitude and is important for characterising and jus-tifying a correct layering system to be used for the retrieval. The Shannon information content (H) and the independent pieces of information, also known as the degrees of freedom for the signal (DOF), are very useful diagnostics that can be derived from A. The DOF defines the number of indepen-dent pieces of information retrieved from the measurements and can be determined from the trace of the A:
DOF=tr(A). (10)
His the factor by which knowledge of the state is improved when taking the measurements, and is defined as
H= −1
2ln|In−A|, (11)
where Inis the identity matrix, andnis the length of the state
vector.
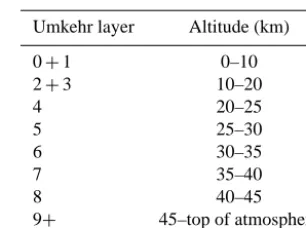
Figure 4 shows an example of averaging kernels for a lay-ering system which follows that of Petropavlovskikh et al. (2004). The atmosphere is split into distinct dynamical and chemical regions. The layering system used is given in Ta-ble 1.
5 Case study: Melbourne 5.1 Nvalue fit
55 60 65 70 75 80 85 90 −20 0 20 40 60 80 100 N − Value SZA
Melbourne 28/1/1994 N−Values
Measurements Retrieval − C pair Residual − C pair
55 60 65 70 75 80 85 90
−20 0 20 40 60 80 100 120 N − Value SZA
Melbourne 28/1/1994 N−Values
Measurements Retrieval − A pair Retrieval − C pair Retrieval − D pair Residual − A pair Residual − C pair Residual − D pair
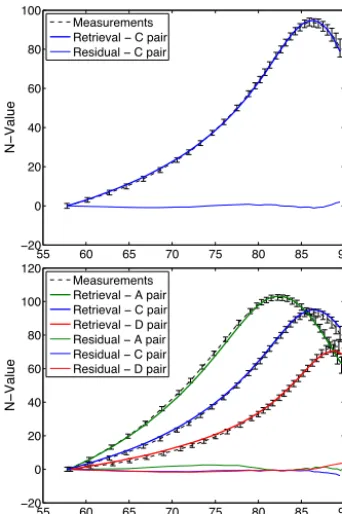
Figure 3. SimulatedNvalues compared to the measurements after
the iterative retrieval process when using only C-pair measurements (top panel) and using A+C+D-pair measurements (bottom panel) for 28 January 1994.
that the peak in the N value occurs at a different SZA for each wavelength pair. Referring back to Fig. 1, this means that for the A-pair, more information is obtained from higher up in the atmosphere, and for the D-pair, lower down in the atmosphere.
When comparing theN value fit for just the C-pair mea-surements, the forward model is able to match the measured N values very accurately, with the largest difference in the Nvalues occurring at high SZAs (shown in the residual line), being 1.8, and 9 % ofσ2(the associated diagonal element of S). When comparing the A+C+D curves, the differences
are slightly more pronounced, especially at higher SZAs, with the largest difference in the N values being 3.8, and 18 % ofσ2. For measurements that extend beyond a SZA of 90◦, the magnitude of these differences can increase signif-icantly. For example, from the case at 13 April 1970 with a cut off SZA of 94◦, the biggest difference in theN value is 30.4. This corresponds to only 13 % ofσ2, but is outside the errors assigned to the measured N values. The inability to accurately simulate the measurements within the constraints of S and Sa is due to inadequacies of the forward model.
The most likely cause is multiple scattering effects, that are largest at higher SZAs, and are currently not accounted for. The N value fit gives confidence that the forward model is able to simulate the measurements accurately when includ-ing multiple wavelength pairs in the measurement vector for angles less than 90◦.
−0.2 0 0.2 0.4 0.6 0.8
0+1 2+3 4 5 6 7 8 9+ La ye r N o. Averaging kernel
Melbourne 28/1/1994 Averaging Kernel
−0.2 0 0.2 0.4 0.6 0.8
0+1 2+3 4 5 6 7 8 9+ La ye r N o. Averaging Kernel
Melbourne 28/1/1994 Averaging Kernel
−0.2 0 0.2 0.4 0.6 0.8
0+1 2+3 4 5 6 7 8 9+ La ye r N o. Averaging kernel
Melbourne 28/1/1994 Averaging Kernel C pair: designated SZA
A+C+D pair
C pair: measured SZA
0+1 2+3 4 5 6 7 8!9+ 0+1 2+3 4 5 6 7 8 9+ 0+1 2+3
0 20 40 60 80 100
10 20 30 40 50 60 70 80 A lti tu de (k m )
1/diag(A)(km)
Resolution
C pair: designated SZA C pair: measured SZA A+C+D pair 4 5 6 7 8 9+ Resolution
Figure 4. Averaging kernels and resolution for a retrieval at
Mel-bourne for 28 January 1994 for 8 Umkehr layers defined when us-ing just the C-pair measurements and the A+C+D-pair measure-ments in the retrieval. The averaging kernel for each layer is labelled in each plot.
5.2 Retrieval information
Figure 4 shows the Umkehr layer averaging kernels and reso-lutions for an Umkehr retrieval from 28 January 1994 at Mel-bourne. Three cases are run: (1) running a spline through the operational C-pair measurements at designated SZAs (this is simulating the WMO reporting and fitting procedure for use in the presented algorithm), (2) using the operational C-pair measurements, and (3) using all available information from the operational A+C+D-pair measurements. When look-ing at the designated C-pair measurement retrieval, it is seen that the least amount of influence from the a priori in the retrieval is seen in layer 4. It is also seen that layer 4 has significant influence on layer 5, with the most amount of in-formation retrieved at that layer from layer 4. The smoothing in the retrieval is much more pronounced at higher Umkehr layers. It is also seen that there is very little information re-trieved in layer 0+1.
When using the operational measurements instead of the designated measurements, the averaging kernels become slightly sharper. The greatest improvement is seen in layer 2+3. Layers 4 and 5 also improve slightly; however, layer 4 still has a significant influence on layer 5. There is still very little information retrieved in layer 0+1.
Table 2. Retrieval information content and degrees of freedom.
Layer 0+1 2+3 4 5 6 7 8 9+ Total
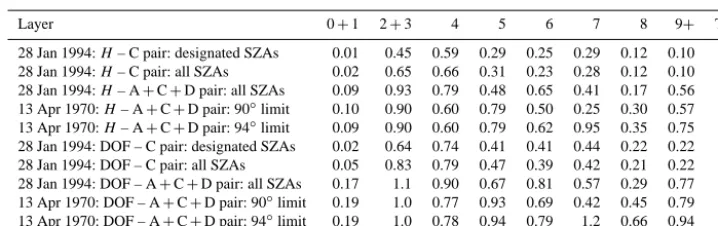
28 Jan 1994:H– C pair: designated SZAs 0.01 0.45 0.59 0.29 0.25 0.29 0.12 0.10 5.2 28 Jan 1994:H– C pair: all SZAs 0.02 0.65 0.66 0.31 0.23 0.28 0.12 0.10 6.5 28 Jan 1994:H– A+C+D pair: all SZAs 0.09 0.93 0.79 0.48 0.65 0.41 0.17 0.56 10.3 13 Apr 1970:H– A+C+D pair: 90◦limit 0.10 0.90 0.60 0.79 0.50 0.25 0.30 0.57 11.0 13 Apr 1970:H– A+C+D pair: 94◦limit 0.09 0.90 0.60 0.79 0.62 0.95 0.35 0.75 12.8 28 Jan 1994: DOF – C pair: designated SZAs 0.02 0.64 0.74 0.41 0.41 0.44 0.22 0.22 3.1 28 Jan 1994: DOF – C pair: all SZAs 0.05 0.83 0.79 0.47 0.39 0.42 0.21 0.22 3.4 28 Jan 1994: DOF – A+C+D pair: all SZAs 0.17 1.1 0.90 0.67 0.81 0.57 0.29 0.77 5.2 13 Apr 1970: DOF – A+C+D pair: 90◦limit 0.19 1.0 0.77 0.93 0.69 0.42 0.45 0.79 5.3 13 Apr 1970: DOF – A+C+D pair: 94◦limit 0.19 1.0 0.78 0.94 0.79 1.2 0.66 0.94 6.5
layers 7, 8 and 9+. In the A+C+D-pair case, layer 7 still has a large influence on layer 8, however much less on layer 9+. There is still very little information able to be retrieved in layer 0+1 in the A+C+D-pair case. The improvements seen in the upper Umkehr layers in the A+C+D-pair case are dominated by the inclusion of the A pair, where the as-sociated N value curve has a turnaround at a smaller SZA compared to the other wavelength pairs. Inclusion of the D-pair still results in an improvement, though it is much less than that of the A-pair, as most of the information contained in the D-pair measurements is at the lower altitudes.
The resulting resolution of the retrievals is also shown in Fig. 4. This clearly shows the marked increase in resolu-tion when using the designated C-pair measurements in the retrievals to using the operational A+C+D-pair measure-ments. The greatest resolution in this retrieval is seen be-tween around 12 and 40 km. With the C-pair retrievals, there is very little resolved information below 10 and above 40 km, while the resolution at these levels is slightly increased when using the A+C+D-pairs. The resolution between 25 and 40 km is seen to be have the most significant improvement in the A+C+D-pair case compared to the C-pair cases.
Table 2 shows H and DOF for each separate Umkehr layer in the retrieval averaging kernels shown in Fig. 4. An A+C+D retrieval case from 13 April 1970 is also included that has measurements spanning 56◦to 94◦SZAs, compared
to measurement SZAs from 58◦to 90◦in the 28 January 1994
case. To emphasise the extra information content obtained when measurements at SZAs greater than 90◦are included, we have provided two examples from 13 April 1970: one with the measurements limited to 90◦, and one with no limit. In the designated C-pair case from 28 January 1994, there is a total of 3.1 independent pieces of information for this particular retrieval. When looking at how this is split up into the assigned Umkehr layers, layers 2+3 and 4 are closest to having a single DOF. This independence is increased in the operational measurement C-pair case, where the total DOF is 3.4, with the most significant increase in the 2+3 Umkehr layer. When comparing with the A+C+D case from 28 January 1994, the total DOF is significantly increased to 5.2, around 2 DOF greater than the C-pair cases. Layer 2+3 is greater than 1, showing that more than one independent piece
of information is retrieved from this layer. Large increases in the DOF are also seen in layers 4, 5, 6, and 9+. The pattern of improvement inHfollows closely to that of the DOF. The totalH in the A+C+D case is seen to be almost double that of the C-pair cases at 10.3, with again significant im-provements in all Umkehr layers except 0+1 and 8. 1.2 ex-tra independent pieces of information are retrieved for the A+C+D case from 13 April 1970 with a SZA limit of 94◦, and the total information content increases by 1.8 bits compared to the 13 April 1970 case with measurements lim-ited to 90◦, and 2.5 bits compared to the 28 January 1994
case. The majority of the extra information retrieved from the A+C+D-pair case is due to the extra measurements taken at SZAs beyond 90◦, and referring back to Fig. 1, this
infor-mation is expected in the upper Umkehr layers. This can be seen in detail when looking at the individual layer contribu-tions. The DOF for layers 0+1, 2+3, 4, and 5 are almost identical to the case when the SZA is limited to 90◦. How-ever, layers 6, 7, 8, and 9+ all have a significantly larger DOF. The stand out layers are 7 and 8, with layer 7 increas-ing from 0.42 to 1.2 DOF, and layer 8 increasincreas-ing from 0.45 to 0.66 DOF. Similar increases are seen inH.
The reason why there are differences between the 90◦ limited A+C+D-pair cases from 28 January 1994 and 13 April 1970 can be attributed mostly to differences in Sa for
the two different cases, as Sa changes slightly with season.
Differences in measurement frequency and slight changes in the atmospheric profile over season, causing shifts of Umkehr information content into different Umkehr layers, may also be partly responsible. However, the increases in re-trieval information is still clearly seen in the upper Umkehr layers when comparing the 13 April 1970 case with no SZA limit to the 28 January 1994 case.
It is seen that by using the operational measurements in-stead of using those at designated SZA, the amount of infor-mation that can be retrieved is enhanced, most noticeably at layers 2+3 and 4. Including all wavelength pairs in the re-trieval has an even more noticeable effect. The information retrieved from all layers, except layers 0+1 and 8, is signif-icantly enhanced, especially in upper Umkehr layers. Also, for the case where measurements past a SZA of 90◦are in-cluded, a larger amount of information from Umkehr layers 5 and above, is able to be retrieved.
5.3 Comparison with observations
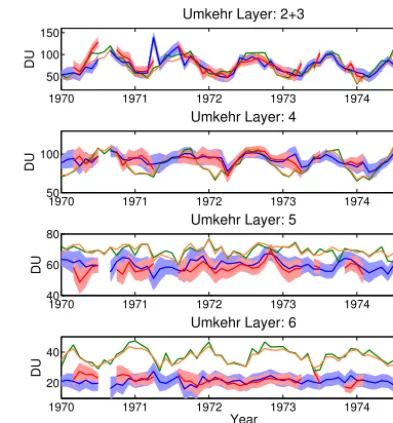
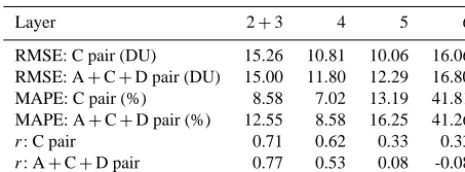
Figure 5 shows the comparison of monthly averaged Mel-bourne Umkehr C and A+C+D-pair retrievals with Mel-bourne ozonesonde data between 1970 and 1975 for Umkehr layers 2+3, 4, 5 and 6. During this time period both ozonesondes and Umkehrs were measured at Aspendale, Melbourne. Also, during this period, the same Dobson in-strument was used, and all ozonesonde data were measured using the Brewer–Mast instrument. Retrieved Umkehr stan-dard deviations are plotted as the shaded regions for both the C and A+C+D-pair time series. Monthly averaging was performed as the Umkehr and ozonesonde data were not measured at coincident times. To smooth the ozonesonde data to the lower resolution of the Umkehr retrievals, the difference between the monthly averaged ozonesonde data and the a priori is convolved with the monthly averaged C-pair averaging kernels, which is then added to the a priori (Rodgers and Conner, 2003). As ozonesonde data has an al-titude limit at around 35 km, the ozonesonde data were com-bined with ozone information from the vertically resolved ozone database for Umkehr layers 7 and above. This is re-quired as to accurately convolve the ozonesonde data with the Umkehr averaging kernels, ozone layer amounts for all lay-ers are required. The original ozonesonde data are also shown for comparison. For the site of Melbourne, measurements us-ing all three wavelength pairs were not taken as consistently as the C-pair case, and at times the A and D-pair wavelengths were only measured at high SZA. Due to these inconsisten-cies, and the infrequency of A+C+D-pair measurements, ozonesonde data were not convolved with the A+C+ D-pair averaging kernels. The root mean squared error (RMSE), the mean absolute percentage error (MAPE) and correlation coefficient (r) between the Umkehr and ozonesonde data sets are shown in Table 3.
In layer 2+3, the Umkehr retrievals agree very well with the ozonesonde data. The seasonal cycle is captured very well in the C and A+C+D-pair Umkehr retrievals using measured SZA. This is highlighted with r being 7.1 and 7.7 respectively for the C and A+C+D-pair comparison with ozonesonde data. Convolving the ozonesondes with the C-pair averaging kernels slightly reduces the variability to more closely match that of the Umkehr C-pair retrievals. The MAPE between the Umkehr and ozonesonde time series is
1970 1971 1972 1973 1974
50 100 150
DU
Umkehr Layer: 2+3
1970 1971 1972 1973 1974
50 100
DU
Umkehr Layer: 4
1970 1971 1972 1973 1974
40 60 80
DU
Umkehr Layer: 5
1970 1971 1972 1973 1974
20 40
Year
DU
Umkehr Layer: 6
Ozonesonde Ozonesonde*C−pair A Umkehr C−Pair Umkehr ACD−Pairs
Figure 5. Time series of Umkehr partial columns, in Dobson units,
compared to coincident ozonesondes layers. The C-pair A con-volved ozonesonde data were combined with a climatology of upper level ozone from the vertically resolved ozone database. Shading on Umkehr curves shows retrieved one standard deviation.
8.58 % and 12.55 % for the C and A+C+D-pair data re-spectively. The RMSE for the C and A+C+D-pair is 15.26 and 15.00 Dobson units respectively. The RMSE between the C and A+C+D-pair have a closer coincidence than the MAPE due to the RMSE being more sensitive to outliers in the time series, and the C-pair time series having the largest outlier in this layer. The C and A+C+D-pair retrievals are very similar to each other for these altitudes as can be ex-pected from the averaging kernels (Fig. 4).
In layer 4, again the Umkehr retrievals agree very well with ozonesonde layer amounts. The seasonal variability is still represented reasonably well, with r being .62 and .53 for the C and A+C+D-pair data respectively. Both the con-volved and unconcon-volved ozonesonde cases are similar in this layer. The C and A+C+D-pair cases are also similar to each other in this layer, with the RMSE being 10.81 and 11.80 Dobson units and the MAPE being 7.02 % and 8.58 % respectively.
dif-Table 3. Time series validation metrics.
Layer 2+3 4 5 6
RMSE: C pair (DU) 15.26 10.81 10.06 16.06 RMSE: A+C+D pair (DU) 15.00 11.80 12.29 16.80 MAPE: C pair (%) 8.58 7.02 13.19 41.81 MAPE: A+C+D pair (%) 12.55 8.58 16.25 41.26
r: C pair 0.71 0.62 0.33 0.33
r: A+C+D pair 0.77 0.53 0.08 -0.08
ferences are present when using all wavelength pairs in the retrieval.
The algorithm is seen to capture the partial column ozone amounts of ozonesondes in the lower Umkehr layers, show-ing that the algorithm is performshow-ing well. However, in Umkehr layers 5 and 6, slightly lower ozone partial column amounts are retrieved relative to ozonesondes. This is most likely due to unaccounted-for stray light effects, omission of the multiple scattering from the forward model, and inade-quacies in stratospheric aerosol representation.
6 Conclusions
The algorithm presented here illustrates potential improve-ments to the ozone retrieval from the Umkehr technique. Results clearly demonstrate an increase in the informational content of the retrieved ozone profile when using measure-ments at three Umkehr wavelength pairs. The single scatter-ing radiative transfer forward model is able to simulate the operational N value intensity measurements. For the case from 28 January 1994, which has a SZA limit at 90◦, the maximum residual of the N value fit at high SZA is 1.8, corresponding to 9 % ofσ2for the C-pair retrieval and 3.8, corresponding to 18 % of σ2for A+C+D-pair retrievals. When looking at the case from 13 April 1970, which has a SZA limit of 94◦, the largest residual inNvalue is 30.4 corre-sponding to 13 % ofσ2. These large residuals are most likely due to neglecting multiple scattering effects. The presented algorithm derives a priori profiles and the a priori covariance matrix from the zonally and monthly averaged climatolog-ical data set (Hassler et al., 2009). The algorithm retrieves Umkehr profiles using different combinations of wavelength pairs, depending on the availability of the observations.
Using the operational measurements with interactive re-fraction enables a small increase in the retrieval information compared to using designated SZAs. In the case from 28 Jan-uary 1994, the averaging kernel smoothing is slightly less pronounced, providing a slightly higher resolved retrieval be-tween 10 and 30 km. Also, the total information content in-creases from 5.2 to 6.5 bits, and the total degrees of freedom increases from 3.1 to 3.4. Therefore, as this case does not have measurements that extend beyond a SZA of 90◦, fitting
a spline through the operational measurement data does re-sult in a slight but direct loss of information.
Using multiple wavelengths in the retrieval procedure in-creases the amount of information obtained from the Umkehr measurements by a significant amount. The averaging ker-nels become much more distinct at higher Umkehr levels, allowing much more highly resolved retrievals between 25 and 40 km. Also the total information content approximately doubles compared to using only the C-pair wavelengths in the Melbourne retrieval for 28 January 1994. However, the increase in the information content for individual Umkehr layers are not as large, implying large information contribu-tion from other layers. Also, approximately two more inde-pendent pieces of information are able to be discerned, al-lowing for layers 2+3 and 4, between 10–20 and 20–25 km respectively, to have approximately 1 degree of freedom in the case presented.
The information gain is even more pronounced if the oper-ational measurements extend beyond a SZA of 90◦, as seen in the case from 13 April 1970, with measurements extend-ing to 94◦compared to the same measurements cut off at 90◦. Total information content increases from 11 to 12.8 bits, and the total degrees of freedom increases from 5.3 to 6.5. These increases are most significant for the retrieval above 30 km.
Comparison of the retrieved Melbourne Umkehr time se-ries with ozonesonde observations shows good agreement between the two measurement sets. The best agreement is seen at lower Umkehr layers 2+3 and 4, between 10–20 and 20–25 km respectively, for both the C and A+C+D wavelength pair retrievals. This is expected as these layers hold the largest amount of independent information. Sea-sonal variability closely matches that seen in the ozonesonde data for these layers. Umkehr layers 5 and 6, between 25– 30 and 30–35 km respectively, show poorer agreement be-tween the Umkehr retrievals and the ozonesonde data, where the Umkehr retrievals consistently retrieve a lower amount of ozone. The cause of this is likely due to unaccounted for stray light effects, omission of multiple scattering from the forward model, and under-represented stratospheric aerosol. Layer 5 shows the largest consistent difference between the C-pair and A+C+D-pair retrievals. This highlights that notable differences are present when using the C and A+C+D-pair retrievals.
corrections, will provide a more accurate algorithm for fu-ture work. Assessment of the errors in the fitting of Umkehr curves in partial cloud conditions, assessment of errors in measurements at three wavelengths, and further validation work is also needed to assess the improvement in operational A+C+D-pair retrievals.
Acknowledgements. This work was supported through funding by the Australian Research Council’s Centre of Excellence for Climate System Science (CE110001028), the Australian Bureau of Meteorology, the Australian Government’s Australian Antarctic Science Grant Program (FoRCES 4012), and the Commonwealth Department of the Environment (grant 2011/16853). The authors wish to thank all current and past observers at the Bureau of Meteorology and, previously, CSIRO, for taking the Umkehr observations on which this work is based. The authors are also grateful to S. Jacobs (Monash University) for the digitisation of the historical Melbourne Umkehr data.
Edited by: P. K. Bhartia
References
Bass, A. M. and Paur, R. J.: The ultraviolet cross-sections of ozone: I. The measurements, in: Atmospheric Ozone, edited by: Zere-fos, C. S. and Ghazi, A., Reidal, 606–610, 1985.
Bucholtz, A.: Rayleigh-scattering calculations for the terrestrial at-mosphere, Appl. Optics, 34, 2765–2773, 1995.
Daumont, D., Brion, J., Charbonnier, J., and Malicet, J.: Ozone UV spectroscopy I: Absorption cross-sections at room temperature, J. Atmos. Chem., 15, 145–155, 1992.
Dave, J. V.: Development of Programs for Computing Character-istics of Ultraviolet Radiation, Technical report – Vector Case, Federal Systems Div., International Business Machines Corp, Gaithersburg, MD, 1972a.
Dave, J. V.: Development of Programs for Computing Character-istics of Ultraviolet Radiation, Technical report – Scalar Case, Federal Systems Div., International Business Machines Corp, Gaithersburg, MD, 1972b.
DeLuisi, J. J., Mateer, C. L., and Bhartia, P. K.: On the corre-spondence between Standard Umkehr, Short Umkehr, and so-lar backscattered ultraviolet vertical ozone profiles, J. Geophys. Res., 90, 3845–3849, doi:10.1029/JD090iD02p03845, 1985. Dütsch, H. U.: Vertical ozone distribution from Umkehr
observa-tions, Arch. Meteor. Geophy. A, 11, 240–251, 1959.
Dütsch, H. U. and Staehelin, J.: Results of the new and old Umkehr algorithm compared with ozone soundings, J. Atmos. Terr. Phys., 54, 557–569, 1992.
Gorshelev, V., Serdyuchenko, A., Weber, M., Chehade, W., and Burrows, J. P.: High spectral resolution ozone absorption cross-sections – Part 1: Measurements, data analysis and comparison with previous measurements around 293 K, Atmos. Meas. Tech., 7, 609–624, doi:10.5194/amt-7-609-2014, 2014.
Gotz, F., Meetham, A. R., and Dobson, G. B.: The vertical distribu-tion of ozone in the atmosphere, Proc. R. Soc. Lon. Ser.-A, 145, 416–446, 1934.
Harris, N., Hudson, R., and Phillips, C.: SPARC/IOC/GAW Assess-ment of Trends in the Vertical Distribution of Ozone, World Cli-mate Research Program of WMO/ICSU, 289 pp., 1998. Hassler, B., Bodeker, G. E., and Dameris, M.: Technical Note: A
new global database of trace gases and aerosols from multiple sources of high vertical resolution measurements, Atmos. Chem. Phys., 8, 5403–5421, doi:10.5194/acp-8-5403-2008, 2008. Hassler, B., Bodeker, G. E., Cionni, I., and Dameris, M.: A
verti-cally resolved, monthly mean, ozone database from 1979 to 2100 for constraining global climate model simulations, Int. J. Remote Sens., 30, 4009–4018, 2009.
Hendrick, F., Barret, B., Van Roozendael, M., Boesch, H., Butz, A., De Mazière, M., Goutail, F., Hermans, C., Lambert, J.-C., Pfeilsticker, K., and Pommereau, J.-P.: Retrieval of nitrogen dioxide stratospheric profiles from ground-based zenith-sky UV-visible observations: validation of the technique through correlative comparisons, Atmos. Chem. Phys., 4, 2091–2106, doi:10.5194/acp-4-2091-2004, 2004.
Hendrick, F., Van Roozendael, M., Kylling, K., Petritoli, A., Rozanov, A., Sanghavi, S., Schofield, R., von Friedeburg, D., Wagner, T., Wittrock, F., Fonteyn, D., and De Mazière, M.: In-tercomparison excercise between differnt radiative transfer mod-els used for the interpretation of ground-based zenith-sky and multi-axis DOAS observations, Atmos. Chem. Phys., 6, 94–108, doi:10.5194/acp-6-93-2006, 2006.
Mateer, C. L.: A Study of the Information Content of Umkehr Ob-servations, Ph.D. thesis, University of Michigan, 4–8, 1964. Mateer, C. L. and DeLuisi, J. J.: A new Umkehr inversion algorithm,
J. Atmos. Terr. Phys., 54, 537–556, 1992.
Mateer, C. L. and Dütsch, H. U.: Uniform Evaluation of Umkehr Observations from the World Ozone Network, Tech. Rep., Boul-der, CO, 150 pp., 1964.
Mateer, C. L., Dütsch, H. U., Staehelin, J., and DeLuisi, J. J.: Influ-ence of a priori profiles on trend calculations from Umkehr data, J. Geophys. Res., 101, 16779–16787, 1996.
McElroy, C. T. and Kerr, J. B.: Table mountain ozone intercompar-ison: Brewer ozone spectrophotometer Umkehr observations, J. Geophys. Res., 100, 9293–9300, 1995.
Miyagawa, K., Sasaki, T., Nakane, H., Petropavlovskikh, I., and Evans, R. D.: Reevaluation of long-term Umkehr data and ozone profiles at Japanese stations, J. Geophys. Res., 114, D07108, doi:10.1029/2008JD010658, 2009.
Newchurch, M. J., Bishop, L., Cunnold, D., Flynn, L. E., Godin, S., Frith, S. H., Hood, L., Miller, A. J., Oltmans, S., Randel, W., Reinsel, G., Stolarski, R., Wang, R., Yang, E.-S., and Za-wodny, J. M.: Upper-stratospheric ozone trends 1979–1998, J. Geophys. Res., 105, 14625–14636, 2000.
Petropavlovskikh, I., Bhartia, P. K., and DeLuisi, J.: An improved Umkehr algorithm, NOAA Cooperative Institute for Research in Environmental Sciences, 10–15, 2004.
Petropavlovskikh, I., Bhartia, P. K., and DeLuisi, J.: New Umkehr ozone profile retrieval algorithm optimized for climatological studies, Geophys. Res. Lett., 32, L16808, doi:10.1029/2005GL023323, 2005.
At-mos. Meas. Tech., 4, 1841–1853, doi:10.5194/amt-4-1841-2011, 2011.
Reinsel, G. C.: Trend analysis of upper stratospheric Umkehr ozone data for evidence of turnaround, Geophys. Res. Lett., 29, 91-1– 91-4, 2002.
Reinsel, G. C., Tiao, G. C., Miller, A. J., Nagatani, R. M., Wueb-bles, D. J., Weatherhead, E. C., Cheang, W. K., Zhang, L., Flynn, L. E., and Kerr, J. B.: Update of Umkehr ozone profile data trend analysis through 1997, J. Geophys. Res., 104, 23881– 23898, 1999.
Rodgers, C. D.: Retrieval of atmospheric temperature and composi-tion from remote measurements of thermal radiacomposi-tion, Rev. Geo-phys., 14, 609–624, 1976.
Rodgers, C. D.: Characterization and error analysis of profiles re-trieved from remote sounding measurements, J. Geophys. Res., 95, 5587–5595, 1990.
Rodgers, C. D.: Inverse Methods for Atmopsheric Sounding: The-ory and Practice, 2nd edn., World Science, Hackensack, NJ, 2000.
Rodgers, C. D. and Conner, B. J.: Intercomparison of re-mote sounding instruments, J. Geophys. Res., 108, 4116, doi:10.1029/2002JD002299, 2003.
Schofield, R., Connor, B. J., Kreher, K., Johnston, P. V., and Rodgers, C. D.: The retrieval of profile and chemical informa-tion from ground-based UV-visible spectroscopic measurements, J. Quant. Spectrosc. Ra., 86, 115–131, 2004a.
Schofield, R., Kreher, K., Conner, B. J., Johnston, A., Thomas, A., Shooter, D., Chipperfield, M. P., Rodgers, C. D., and Mount, G. H.: Retrieved tropospheric and stratospheric BrO columns over Lauder, New Zealand, J. Geophys. Res., 109, D14304, doi:10.1029/2003JD004463, 2004b.