www.atmos-meas-tech.net/7/625/2014/ doi:10.5194/amt-7-625-2014
© Author(s) 2014. CC Attribution 3.0 License.
Atmospheric
Measurement
Techniques
High spectral resolution ozone absorption cross-sections – Part 2:
Temperature dependence
A. Serdyuchenko, V. Gorshelev, M. Weber, W. Chehade, and J. P. Burrows
Institute of Environmental Physics, Bremen University, Germany
Correspondence to: A. Serdyuchenko ([email protected])
Received: 12 May 2013 – Published in Atmos. Meas. Tech. Discuss.: 19 July 2013
Revised: 8 November 2013 – Accepted: 26 November 2013 – Published: 24 February 2014
Abstract. We report on the temperature dependence of ozone
absorption cross-sections measured in our laboratory in the broad spectral range 213–1100 nm with a spectral resolution of 0.02–0.24 nm (full width at half maximum, FWHM) in the atmospherically relevant temperature range from 193 K to 293 K. The temperature dependence of ozone absorp-tion cross-secabsorp-tions was established using measurements at eleven temperatures. This investigation is superior in terms of spectral range and number of considered temperatures com-pared to the previous studies. The methodology of the abso-lute broadband measurements, experimental procedures and spectra processing were described in our companion paper together with the associated uncertainty budget. In this paper, we report in detail on our data below room temperature and compare them with literature data using direct comparisons as well as the standard approach using a quadratic polyno-mial in temperature fitted to the cross-section data.
1 Introduction
Accurate information on the temperature dependence of the absorption cross-sections is vital for the retrievals of ozone profiles and columns from ultraviolet (UV) and visible (vis) spectra measured by modern remote sensing instruments. The origin of the temperature dependence of the ozone ab-sorption cross-section arises from changes in the population distribution in the rotational vibrational states of the ground electronic state. The features and structure of the ozone ab-sorption spectra and their changes with temperature were subject of extensive studies, mainly stimulated by ozone re-mote sensing applications (Barnes and Mauersberger, 1987; Brion et al., 1993; Bogumil et al., 2003, Burkholder and
Talukdar, 1994; Burrows et al., 1999; Malicet et al., 1989, 1995; Paur and Bass, 1984; Voigt et al., 2001). The Hart-ley absorption band in the UV comprises a very broad con-tinuum with series of narrow peaks superimposed near the absorption maximum. At the maximum of the Hartley band around 254 nm, the temperature variation is in the range of 0.5–1 % from 203 to 273 K (Barnes and Mauersberger, 1987; Malicet et al., 1989). The temperature variation in the Hug-gins band is strongly wavelength-dependent with differences up to 70 % and 30 % for minimum and maximum of the spec-tral feature around 335 nm (Brion et al., 1993; Malicet et al., 1995; Paur and Bass, 1984). The Chappuis absorption band in the visible consists of a continuum with a series of peaks superimposed on the blue side of the spectrum. Weak temperature dependence below 1 % was found for absorp-tion cross-secabsorp-tions on the top of the band (Burkholder and Talukdar, 1994). The continuum of the visible is extended in the near-infrared (NIR) wavelength region, and on this ex-tension the structure is superimposed. The Wulf absorption band in NIR exhibits temperature dependence similar to the Huggins band.
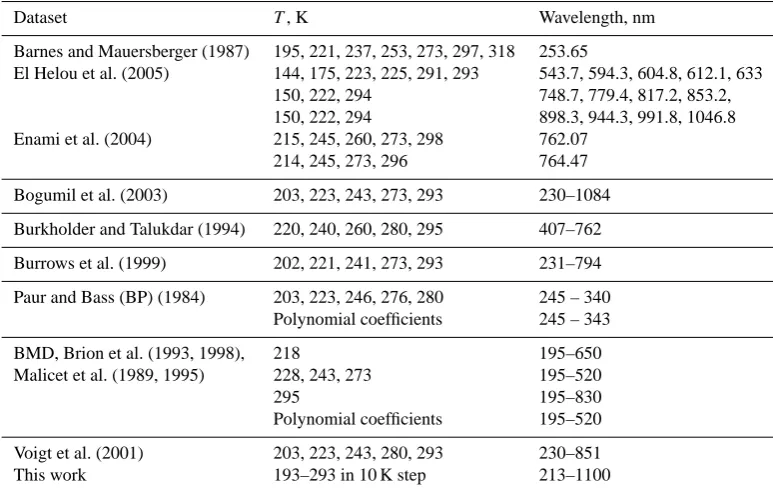
Table 1 provides an overview of the most relevant ozone cross-sections in the UV, visible, and near IR available at more than one temperature. More details on these datasets can be found in the review by Orphal (2003). In our compan-ion paper (Gorshelev et al., 2014), we found typical accura-cies of 2–3 % in the spectral regions with strong absorption (maximum of Hartley, Huggins, and Chappuis bands) for all literature data, including our own measurements.
Table 1. Characteristics of the datasets on ozone absorption cross-sections.
Dataset T, K Wavelength, nm
Barnes and Mauersberger (1987) 195, 221, 237, 253, 273, 297, 318 253.65
El Helou et al. (2005) 144, 175, 223, 225, 291, 293 543.7, 594.3, 604.8, 612.1, 633 150, 222, 294 748.7, 779.4, 817.2, 853.2, 150, 222, 294 898.3, 944.3, 991.8, 1046.8 Enami et al. (2004) 215, 245, 260, 273, 298 762.07
214, 245, 273, 296 764.47
Bogumil et al. (2003) 203, 223, 243, 273, 293 230–1084
Burkholder and Talukdar (1994) 220, 240, 260, 280, 295 407–762
Burrows et al. (1999) 202, 221, 241, 273, 293 231–794
Paur and Bass (BP) (1984) 203, 223, 246, 276, 280 245 – 340 Polynomial coefficients 245 – 343
BMD, Brion et al. (1993, 1998), 218 195–650
Malicet et al. (1989, 1995) 228, 243, 273 195–520
295 195–830
Polynomial coefficients 195–520
Voigt et al. (2001) 203, 223, 243, 280, 293 230–851
This work 193–293 in 10 K step 213–1100
only available for temperatures down to 218 K and for lim-ited spectral regions only. The measurements by Paur and Bass (1984), often abbreviated as BP, were scaled to Hearn’s value at 253.65 nm at room temperature (Hearn, 1961) and in turn used for scaling the broadband low-resolution data by Bogumil et al. (2003). Low-resolution data by Burrows et al. (1999) were measured absolutely using the titration method at 293 K and scaled at all temperatures assuming invariant integrated optical densities. The integrated absorp-tion cross-secabsorp-tions of Burrows et al. (1999) were later used for absolute scaling of the broadband high-resolution data by Voigt et al. (2001). Measurements by Burkholder and Taluk-dar (1994) were normalized using the absolute absorption cross-sections of Anderson and Mauersberger (1992) mea-sured at five specific wavelengths near the peak of the Chap-puis band at 298 K.
Broadband datasets are available as original experimental data at selected temperatures and as wavelength-dependent temperature coefficients from a quadratic polynomial fit (de-tails will be given below). Liu et al. (2007) derived polyno-mial coefficients from the BMD data at four temperatures excluding the 273 K data. Polynomial coefficients obtained from BP measurements are included in HITRAN 2008, a well-known high-resolution transmission molecular absorp-tion database (Rothman et al., 2009).
Absolute cross-section measurements at single wave-lengths by El Helou et al. (2005) and Barnes and Mauersberger (1987) were performed at all temperatures us-ing pure ozone, while data by Enami et al. (2004) were scaled using Hearn’s value at 253.65 nm.
There is an obvious lack of consistent and consolidated data on O3absorption cross-sections. The available literature data do not fulfil the criteria of being available for many tem-peratures including the lowest atmospheric temtem-peratures (be-low 200 K) and having broad spectral coverage from the UV to NIR and sufficient spectral resolution (better than 0.1 nm in the UV).
This paper is focused on the results on the temperature de-pendence of our new ozone cross-section measurements in the broad spectral region from 213 nm to 1100 nm obtained for temperatures from 293 K to 193 K in steps of 10 K. The experimental setup, associated uncertainties and methods for data analysis are briefly discussed in the Sects. 2 and 3; more details can be found in the companion paper (Gorshelev et al., 2014). In Sect. 3, the new data are analysed and com-pared with the data listed in Table 1. The assessment of data quality is performed using several approaches: comparison of the band-integrated cross-sections, polynomial tempera-ture parameterization and calculation of the scaling factors and wavelength shifts between different datasets in the Hug-gins band.
2 Experimental setup and uncertainties budget
trap for preparation of pure ozone for absolute measuments. Absolute measurements were done in the spectral re-gions with strong absorption (Huggins and Chappuis bands). All other spectra (obtained from relative measurements in an ozone–oxygen flow) were scaled and concatenated to the ab-solute spectra separately at each temperature. Relative spec-tra at 213–310 nm and 350–450 nm were recorded using the echelle spectrometer, which is a cross-dispersion instrument with spectral resolution of 0.02 nm in the 213–450 nm spec-tral region. Relative measurements were also performed for 335–350 nm and 780–1100 nm using the FTS with a spectral resolution of 1 and 2 cm−1respectively. Cross-sections were calibrated individually at each temperature, using absolute broadband measurements at 310–335 nm and 450–780 nm, recorded with the FTS at 1 cm−1 spectral resolution. This way, the new data are independent for every temperature and free from uncertainties of previous studies.
For accurate investigation of the temperature dependence, measurements were performed at eleven temperatures from 293 K down to 193 K in 10 K steps. Gas temperature in the absorption cells was stabilized by continuous flow of ethanol provided by the cryostats (Haake CT 90 W Phoenix 2). The cells are identical cylindrical double-jacketed quartz vessels having a total length of 140 cm and an inner diameter of 5 cm. For relative measurements performed at gas flow regimes, a system was equipped with pre-cooling units to assure ef-ficient cooling of the oxygen–ozone mixture, which spent only limited time in the absorption cells. The pre-cooler is a 10 m-long copper pipe fitted into the Haake thermostat ves-sel. The length of the pipeline exposed to ambient air is ap-proximately 50 cm. Such an arrangement, with proper ther-mal insulation, reduces ozone–oxygen mixture heating on its way from the cooler to the cell. In order to suppress the cop-per’s catalytic activity to destroy ozone, the inner surface of the pipe was passivated.
The cryostats were capable of limiting the statistical fluc-tuations to less than±0.3 K for all temperatures. The cali-bration of the internal sensors of the thermostats was verified using several alcohol thermometers. An agreement to within 1 K or better was found over the full range of operations. Several Pt sensors were used to assess the temperature homo-geneity inside the cell and in the cell jacket, which was found to be within 1 %. Homogeneity of the cell temperature was within 1 %. To exclude possible offsets of the Pt sensors due to contact with the cold surrounding walls, the gas tempera-ture was observed by means of an independent spectroscopic non-intrusive method using the absorption by the oxygen A-band at 760 nm. This method is based on the comparison of measured O2absorption spectrum with synthetic spectra cal-culated for different temperatures using line parameters from HITRAN 2008. The algorithm involves an iterative fitting of the rotational structure of the A-band using the dependence of line intensities on rotational temperature. The output is the mean over the cell temperature. The uncertainty of the
HITRAN parameters is about 1 %, and the signal-to-noise of the oxygen absorption spectrum was better than 1 %.
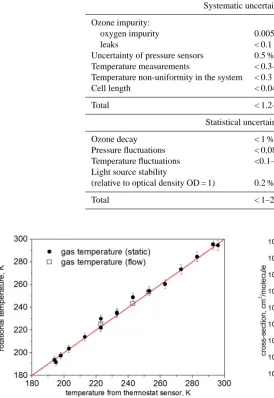
The Pt sensors, the cryostat internal sensor, and spectro-scopic measurements both in the static and flow regime were found to agree within 1–3 K for almost all temperatures, re-sulting in an uncertainty of 0.3–1.5 % for the whole range of the temperatures. The rotational temperature is shown in Fig. 1 as a function of the temperature measured by the cryo-stat sensor. A relative uncertainty of 1.5 % can be taken as the upper limit for the temperature-related uncertainty in the ab-solute measurements (also shown in Fig. 1 for convenience). For all absolute absorption measurements, ozone concentra-tion was derived using the temperature measured by the cryo-stat internal sensor.
The uncertainty budget is shown in Table 2. For most of the spectral regions, the largest contribution to the total un-certainty is due to the determination of the absolute ozone concentration. In our quartz cell the ozone concentration was found to fall by 10 % after 10–12 h at room temperature, and at temperatures below 243 K the decay rate is lower by at least one order of magnitude. Ozone decay in the cell during gas accumulation before measurements and during spectral recording had to be taken into account only for temperatures above 243 K. The uncertainty of the ozone pressure is about 1 % and better, improving towards lower temperatures.
During the absolute measurements, light source stability was 0.2 % and 2 % for Chappuis and Huggins bands respec-tively. The uncertainty of the absolute calibration applies as well to the relative spectra that were concatenated. For the majority of the spectral regions, the statistical uncertainty of the absorption measurements is well below 1 %; however, in the spectral regions with weak absorption (350–450 nm and longer than 900 nm) statistical uncertainty can reach up to 30 %. More details on the uncertainties, spectral limits of concatenated regions and corresponding measured optical densities can be found in our companion paper (Gorshelev et al., 2014).
3 Results and discussion
The absorption cross-sections from this work are presented in Fig. 2. The data cover the spectral region 213–1100 nm and span over more than seven orders of magnitude. We analysed the absorption cross-sections of O3at different temperatures by
– determining scaling factors between the new and
pub-lished band-integrated cross-sections;
– comparing our results and published datasets at
wave-lengths of the Hg lamp (254 nm) and those used rou-tinely in ozone remote sensing;
– determining scaling factors and wavelength shifts in
Table 2. Uncertainty associated with the absorption cross-section obtained from absolute measurements at 50 mbar and 193–293 K and path lengths of 135 and 270 cm in the Huggins and Chappuis bands.
Systematic uncertainty
Ozone impurity:
oxygen impurity 0.005 %
leaks < 0.1 %
Uncertainty of pressure sensors 0.5 %
Temperature measurements < 0.3–1.6 % (1–3 K) Temperature non-uniformity in the system < 0.3 % (1 K)
Cell length < 0.04–0.07 % (< 1 mm)
Total < 1.2–2.6 %, depending on temperature
Statistical uncertainty
Ozone decay < 1 %
Pressure fluctuations < 0.08 % (< 0.04 mb) Temperature fluctuations <0.1–0.16 % (< 0.3 K) Light source stability
(relative to optical density OD = 1) 0.2 % (vis)/2 % (UV)
Total < 1–2.2 %, depending on spectral region
Fig. 1. Correlation between the rotational temperature derived from the oxygen A-band and the temperature obtained using cryostat sen-sor (symbols).
to the high-resolution BMD and BP datasets and low-resolution data obtained by Bogumil et al. (2003).
3.1 Band-integrated cross-section comparison
Band-integrated absorption cross-sections are convenient for comparison of datasets with different spectral resolution. When available, considered cross-sections were integrated using the spectral regions suggested by Orphal (2003): 245– 340 nm in Hartley band, 325–340 nm in Huggins band, and 410–690 nm in Chappuis band. For the integration in the Wulf band we used the range 663–1000 nm suggested by Banichevich et al. (1993) from theoretical studies of the
Fig. 2. Overview of our new ozone cross-section data in the UV/vis/NIR measured at 11 temperatures ranging from 193 K to 293 K.
potential energy surfaces of ozone in its ground and the lowest-lying eight excited states.
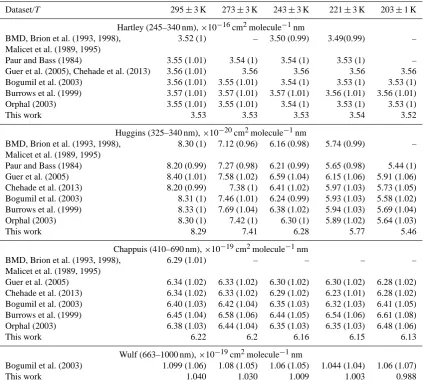
Table 3 contains integrated cross-sections calculated using the data obtained in this study, high-resolution BMD and BP datasets, and satellite FM datasets. It also contains the mean values obtained by Orphal (2003) by averaging over several data: BP, BMD, Burrows et al. (1999), Bogumil et al. (2003), Voigt et al. (2001) and Burkholder and Talukdar (1994). Among these datasets only two were measured absolutely: BMD and Burrows et al. (1999). This table also contains ra-tios of the published datasets over our new dataset.
Table 3. Integrated cross-sections, and their ratios (in brackets) to our new dataset.
Dataset/T 295±3 K 273±3 K 243±3 K 221±3 K 203±1 K
Hartley (245–340 nm),×10−16cm2molecule−1nm
BMD, Brion et al. (1993, 1998), 3.52 (1) – 3.50 (0.99) 3.49(0.99) –
Malicet et al. (1989, 1995)
Paur and Bass (1984) 3.55 (1.01) 3.54 (1) 3.54 (1) 3.53 (1) –
Guer et al. (2005), Chehade et al. (2013) 3.56 (1.01) 3.56 3.56 3.56 3.56 Bogumil et al. (2003) 3.56 (1.01) 3.55 (1.01) 3.54 (1) 3.53 (1) 3.53 (1) Burrows et al. (1999) 3.57 (1.01) 3.57 (1.01) 3.57 (1.01) 3.56 (1.01) 3.56 (1.01)
Orphal (2003) 3.55 (1.01) 3.55 (1.01) 3.54 (1) 3.53 (1) 3.53 (1)
This work 3.53 3.53 3.53 3.54 3.52
Huggins (325–340 nm),×10−20cm2molecule−1nm
BMD, Brion et al. (1993, 1998), 8.30 (1) 7.12 (0.96) 6.16 (0.98) 5.74 (0.99) – Malicet et al. (1989, 1995)
Paur and Bass (1984) 8.20 (0.99) 7.27 (0.98) 6.21 (0.99) 5.65 (0.98) 5.44 (1) Guer et al. (2005) 8.40 (1.01) 7.58 (1.02) 6.59 (1.04) 6.15 (1.06) 5.91 (1.06) Chehade et al. (2013) 8.20 (0.99) 7.38 (1) 6.41 (1.02) 5.97 (1.03) 5.73 (1.05) Bogumil et al. (2003) 8.31 (1) 7.46 (1.01) 6.24 (0.99) 5.93 (1.03) 5.58 (1.02) Burrows et al. (1999) 8.33 (1) 7.69 (1.04) 6.38 (1.02) 5.94 (1.03) 5.69 (1.04)
Orphal (2003) 8.30 (1) 7.42 (1) 6.30 (1) 5.89 (1.02) 5.64 (1.03)
This work 8.29 7.41 6.28 5.77 5.46
Chappuis (410–690 nm),×10−19cm2molecule−1nm
BMD, Brion et al. (1993, 1998), 6.29 (1.01) – – – –
Malicet et al. (1989, 1995)
Guer et al. (2005) 6.34 (1.02) 6.33 (1.02) 6.30 (1.02) 6.30 (1.02) 6.28 (1.02) Chehade et al. (2013) 6.34 (1.02) 6.33 (1.02) 6.29 (1.02) 6.23 (1.01) 6.28 (1.02) Bogumil et al. (2003) 6.40 (1.03) 6.42 (1.04) 6.35 (1.03) 6.32 (1.03) 6.41 (1.05) Burrows et al. (1999) 6.45 (1.04) 6.58 (1.06) 6.44 (1.05) 6.54 (1.06) 6.61 (1.08) Orphal (2003) 6.38 (1.03) 6.44 (1.04) 6.35 (1.03) 6.35 (1.03) 6.48 (1.06)
This work 6.22 6.2 6.16 6.15 6.13
Wulf (663–1000 nm),×10−19cm2molecule−1nm
Bogumil et al. (2003) 1.099 (1.06) 1.08 (1.05) 1.06 (1.05) 1.044 (1.04) 1.06 (1.07)
This work 1.040 1.030 1.009 1.003 0.988
Huggins band, data agree within 0.1–6 %, with less agree-ment towards lower temperatures and at 273 K. In the Chap-puis and Wulf bands the new data are lower than the pub-lished datasets.
The agreement of our new data with BMD is within 2 % for all values except for the Huggins band at 273 K. The Bogumil et al. (2003) dataset exceeds our new data by about 3–5 % for all temperatures in all bands. In the Hartley and Chappuis bands, our data are only slightly lower (1–2 %) than the broadband dataset obtained by Guer et al. (2005) and recently revised by Chehade et al. (2013). The new ex-perimental data deviate from the mean values obtained by Orphal by about 1–3 % in the Hartley and Huggins bands and up to 6 % in the Chappuis band. The later is partly due to the low absorption in the region near the ozone absorption min-imum (near 380 nm), which is overestimated by most of the datasets except for BMD and this work. This is particularly evident at lower temperatures.
3.2 Temperature dependence in the Hartley band
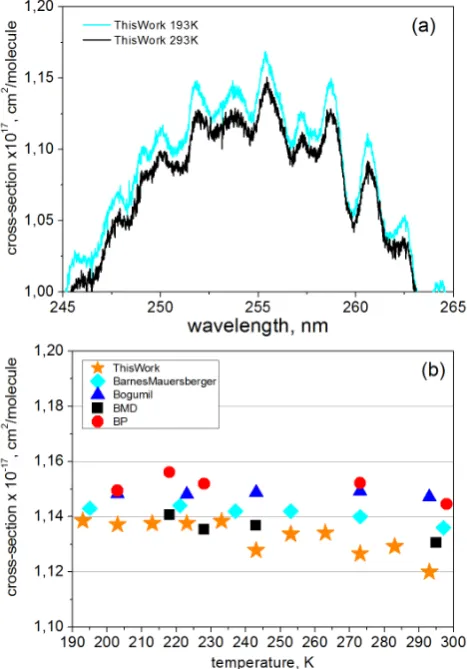
The temperature dependence in the Hartley band was investi-gated in many studies, including the works mentioned above. The absorption by the Hartley band system was found to shift towards longer wavelength with increasing temperature due to vibrational excitation, resulting in a redistribution of the vibrational state populations in the ground state (Baiamonte et al., 1966). We fitted a Gaussian profile to the Hartley band between the shortest wavelength available and 300 nm and analysed the centre position of the Gaussian profile as a func-tion of temperature for several datasets. We found that the Gaussian profile undergoes a shift of 0.14 nm from 203 K to 293 K, while BP and Bogumil et al. (2003) data experience a shift of 0.18 nm and 0.05 nm respectively for the same tem-perature change. The BMD data reveal a more pronounced shift of 0.36 nm from 218 K to 295 K.
229 K in the Hartley band (Barnes and Mauersberger, 1987; Malicet et al., 1989; Paur and Bass, 1984). Our new data also show a weak temperature dependence (about 2 % in the range 193–293 K). Figure 3 shows our cross-section spec-tra at 193 K and 293 K near 250 nm and the temperature de-pendence of various datasets, including ours at 253.65 nm, corresponding to the Hg lamp line. There is a very good agreement between new and BMD data, while the Bogumil et al. (2003) dataset is higher than the new dataset by about 2 %. The Bogumil et al. (2003) dataset does not show any clear temperature dependence, while the absorption cross-sections reported in this study slightly increase with decreasing tem-perature.
3.3 Temperature dependence in the Huggins band
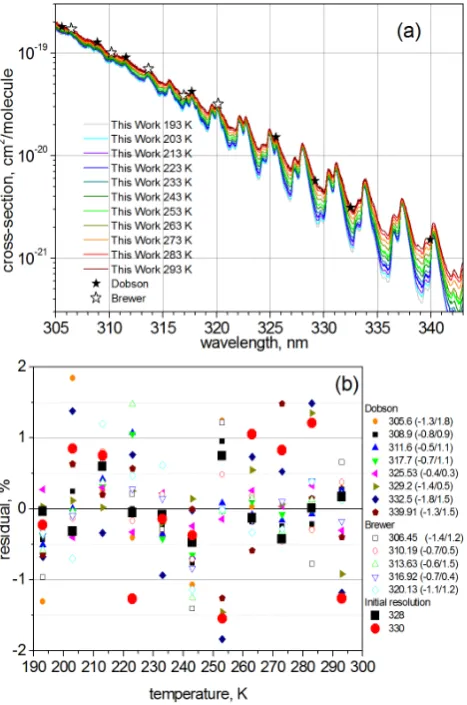
The new cross-section data at eleven temperatures in the Huggins band are shown in Fig. 4a. The band contains the spectral window (325–335 nm) widely used for the ozone to-tal column retrievals with the DOAS technique (Coldewey-Egbers et al., 2005) and spectral channels of the Dobson and Brewer spectrophotometers (Fig. 4).
3.3.1 Polynomial parameterization
The Bass–Paur parameterization empirically describes the temperature dependence of the cross-sections in the DOAS window as a second-order polynomial, making it possible to interpolate between temperatures (Paur and Bass, 1984). A commonly used equation for the temperature dependence of the cross-section is
σ (λ)=10−20· [C0(λ)+C1(λ)·T +C2(λ)·T2], (1) whereT is the temperature in degrees Celsius;C0,C1andC2 are wavelength-dependent fitting coefficients; and the cross-section unit is cm2molecule−1.
We analysed the temperature dependence of the new ozone absorption cross-section in the spectral channels of two ground-based instruments: Dobson and Brewer spectropho-tometers (Scarnato et al., 2009).The channels fall on max-ima and minmax-ima of the spectral features in the region 305– 340 nm (wavelengths are indicated in Fig. 4a). For a rough resolution matching with the instrumental slit functions, we convolved our new dataset to 1 nm and 0.4 nm using a rectan-gular slit function for analysis at Dobson and Brewer wave-lengths respectively. In addition, we investigated the temper-ature behaviour at initial spectral resolution of about 0.02 nm at 328 nm and 330 nm, which are local absorption minimum and maximum.
The deviations of the new cross-sections from the polyno-mial fits at wavelengths described above are shown in Fig. 4b (maximal deviations are given in brackets). The quadratic polynomial (Eq. 1) describes the temperature dependence for most wavelengths to within 1.5 %, which is within the ex-perimental uncertainty. Generally, wavelengths near ozone
Fig. 3. Temperature dependence of the new experimental cross-sections in the UV region: (a) cross-cross-sections for 293 K (dark line) and 193 K (light line); (b) temperature dependence at 253.65 nm. Stars – new experimental data; diamonds – Barnes and Mauers-berger (1987); triangles – Bogumil et al. (2003); squares – BMD; circles – BP.
absorption maxima exhibit smaller deviations. Figure 5 (up-per panel) shows the difference between the ex(up-perimental data and calculated data for two temperatures: 193 K and 293 K. Deviations are generally less than 2 %. In principle, calculated data have better signal-to-noise level compared to the experimental ones, as artefacts from measurements at a single temperature are smoothed out.
Fig. 4. Temperature dependence of the ozone absorption cross-sections: (a) ozone cross-section data in the Huggins band as mea-sured in this study; (b) residuals from the polynomial fit for the tem-perature dependence in the Huggins band. Small closed and open symbols – Dobson and Brewer spectral channels respectively; big closed squares and circles – data at 328 nm and 330 nm. Numbers in brackets represent the maximal deviations.
3.3.2 Comparison with high and low spectral resolution datasets
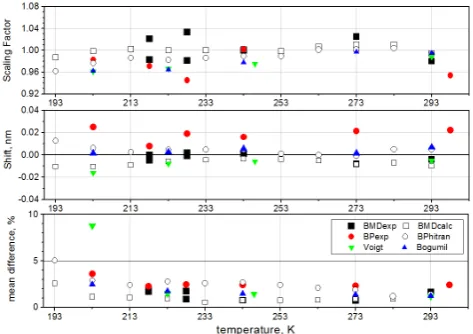
We performed detailed comparisons of the new cross-sections in the spectral region 325–340 nm with the high-resolution datasets (BMD, BP and Voigt et al., 2001) and the low-resolution Bogumil et al. (2003) dataset. Data were anal-ysed by determining scaling factors and wavelength shifts between the considered datasets and mean differences. Data were interpolated on a common wavelength grid, converted to vacuum wavelength and then shifted and scaled until the smallest mean difference over the spectral region was reached. For comparison with the low-resolution dataset by Bogumil et al. (2003) our new data were convolved with the Gaussian profile with full width at half maximum (FWHM) of 0.2 nm. To check the linearity of the shifts and scaling
Fig. 5. Temperature dependence of the ozone absorption cross-sections. (upper panel) Difference between the experimental and Eq. (1) for 193 and 293 K (light and dark lines). (lower panel) Dif-ference between fitting coefficientsC0 in Eq. (1) from this work
and BP (dark line) and BMD (light line), and between BP and BMD (dashed line).
factors, we performed the analysis for three different spec-tral regions (323–330 nm, 332–340 nm and 323–340 nm) and averaged values to obtain uncertainties. More details on the comparison routine are given in our companion paper (Gorshelev et al., 2014).
We compared the experimental BMD data to the temper-ature parameterized BMD data obtained by Liu et al. (2007) in order to provide an additional independent check for the uncertainty due to the assumption of the quadratic tempera-ture dependence. The parameterized BMD spectrum deviates from the experimental BMD within the experimental accu-racy limits both in absolute values and shifts. Mean differ-ence in the spectral region 325–340 nm is about 1 %. There-fore, in the following comparisons we used both the original and parameterized cross-sections, which are practical in case of missing data at some temperatures. However, since param-eterization itself is a manipulation of the data, we tried to use original BMP and BP datasets as extensively as possible.
We found differences between the parameterized BMD and the parameterized BP datasets that are outside of the ac-curacy limits reported for both datasets. Wavelength shifts of 0.015–0.02 nm were found. Without shift corrections and scaling, differences are up to 20 % and more due to the sharp features in this spectral region; the mean over the region dif-ference is 2–5 %. After correcting for wavelength shifts the mean difference is about 1–3 % with larger deviations at low temperatures.
Scaling factors and wavelength shifts were applied to the published datasets to match the new dataset. The remain-ing deviations after scalremain-ing and shiftremain-ing are then due to non-linear spectral/wavelength calibration differences, dif-ferences in the instrumental slit functions and resolution mis-match between the datasets. In addition, slight mismis-match of temperatures has to be taken into account when compar-ing original experimental data in this region because of the high sensitivity of the Huggins band spectral features to the temperature. All mean differences are positive in Fig. 6, be-cause absolute values of differences at every point were taken and averaged. This corresponds to the “worst-case scenario” for mean differences, when summands are not compensating each other due to alternating sign (this happens when, for ex-ample, within the considered range two cross-section curves are intersecting).
We compared our new data at 213 K with the experimen-tal BP data obtained at 218 K and our data at 223 K with BP data at 218 and 228 K and found scaling factors of up to−6 % needed to minimize the differences which are also due to the temperature mismatch of 5 K. We observed wave-length shifts of 0.015–0.02 nm between the BP and our new data (similar to what have been seen when comparing BP to BMD) and the mean difference of about 2–3 %, increasing to 4–5 % at low temperatures. HITRAN 2008 version accom-modates polynomial coefficients obtained for the BP data af-ter wavelength correction performed on the basis of Voigt et al. (2001) measurements. Comparison with the data calcu-lated using these coefficients revealed scaling factors of 1 % for most temperatures and a relatively small wavelength shift (0.005–0.01 nm).
Duplicate points on Fig. 6 for two temperatures (218 K and 228 K) designate differences between experimental BMD data at those temperatures and new experimental data at ad-jacent temperatures of 213 K, 223 K, and 233 K. We com-pared our data at 213 and 223 K to the experimental BMD data at 218 K and our data at 223 and 233 K to the BMD data at 228 K and found scaling factors of±2 % needed to minimize the differences. Small mean shifts of 0.005 nm and less are observed for the window 323–340 nm between the new data and experimental BMD. However, real shifts are non-linear because we found different wavelength shifts for smaller regions 323–330 nm and 332–340 nm. The same was reported by Orphal (2003). The mean relative difference is about 1–2 % at 325–340 nm, which is within the experimen-tal accuracy limits. Calculated BMD data agree with our new experimental data within accuracy limits both with respect to absolute values and spectral shifts. Small spectral shifts were found between our new data and the Voigt et al. (2001) and Bogumil et al. (2003) data. Bogumil et al. (2003) and Voigt et al. (2001) data exceed the new data by 1–4 %.
At wavelengths shorter than 325 nm, wavelength shift seems to be less important; however, it still influences the agreement between the BP and other data. BP data at low temperature deviate both from BMD and the new data. In
Fig. 6. Comparison of the results from this study with BP, BMD, Voigt et al. (2001) and Bogumil et al. (2003) in the window 325– 340 nm (for more details, please read the text): (upper panel) scaling factors (to match other data to new data); (middle panel) wavelength shift (to match other data to new data); (lower panel) relative mean difference (other data after applying corrections for shifts and scal-ing factors minus new data). Filled symbols – experimental data; open symbols – data obtained from the polynomial parameterization (Eq. 1). Squares – BMD, circles – BP, triangles – Voigt et al. (2001) and Bogumil et al. (2003) datasets.
the 315–325 nm region, the mean difference between the pa-rameterized BMD and BP datasets is 1.4 to 5.7 % depend-ing on the temperature. Agreement can be slightly improved (mostly for room temperature) to 0.6–5.4 % using wave-length shifts. New data differ from BMD and BP data by 0.9– 1.9 % and 1.5–5.4 % respectively, with stronger deviations corresponding to the data at low temperature. When using wavelength correction, only insignificant improvement can be achieved: down to 0.7–1.7 % and 0.7–5 % for BMD and BP respectively. During this correction, wavelength shifts of 0.015–0.03 nm (depending on temperature) were applied to BP to match the new data, and a shift of about 0.008 nm (almost independent of the temperature) applied to BMD to match the new data. A small scaling correction of about 1.5 % further decreases mean difference between the BMD and the new data down to 0.3–1.4 %.
3.4 Temperature dependence in Chappuis and Wulf bands
3.4.1 Absorption region 350–450 nm
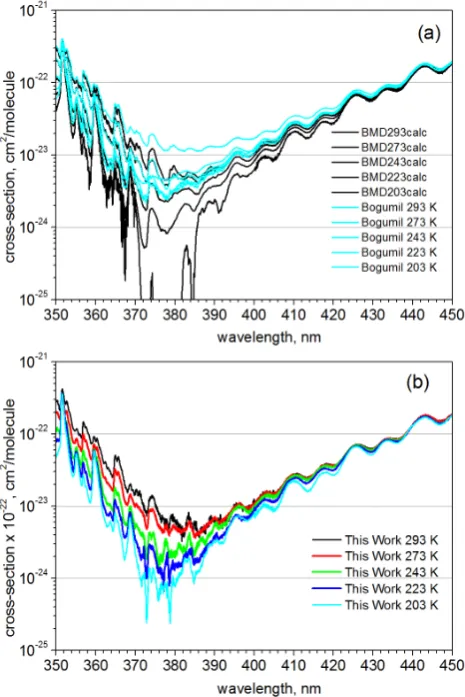
Fig. 7. Ozone cross-sections at 350–450 nm at different tempera-tures: (a) Bogumil et al. (2003) and BMD; (b) this work.
Cross-sections calculated using temperature coefficients ob-tained by Liu et al. (2007) from the BMD experimental data drastically fall at 203 K. The low-resolution dataset by Bogumil et al. (2003) overestimates the minimum absorp-tion. Near the bottom of the weak absorption region (370– 390 nm), our new data appear to be noisier than the BMD dataset. We expect improvement of this region from our fu-ture measurements.
3.4.2 Visible region 450–700 nm
Very weak temperature dependence was observed in our new measurements around 600 nm (about 1 % between 193 K and 293 K), with a small increase of cross-sections with decreas-ing temperatures.
Only a few studies have been performed below 293 K in the Chappuis (Fig. 8) and Wulf (Fig. 9) bands, especially in the NIR region. The most extensive dataset obtained so far was reported by Bogumil et al. (2003). In the Chappuis band and NIR, our new data are lower than the Bogumil et al. (2003) dataset (2–4.5 % in the region 540–850 nm) and agree very well in the region 540–630 nm with the data of
Fig. 8. Ozone cross-sections in the Chappuis and Wulf bands at different temperatures: (a) near maximum of the Chappuis band (squares – El Helou et al. (2005); circles – Anderson and Mauersberger (1992); red dashed line – Bogumil et al. (2003) and Chehade et al. (2013); light-blue solid lines – BMD; dash-dot line – Burkholder and Talukdar (1994); black solid lines – this work); (b) near 760 nm (squares – El Helou et al. (2005); triangles – Enami et al. (2004); lines – this work).
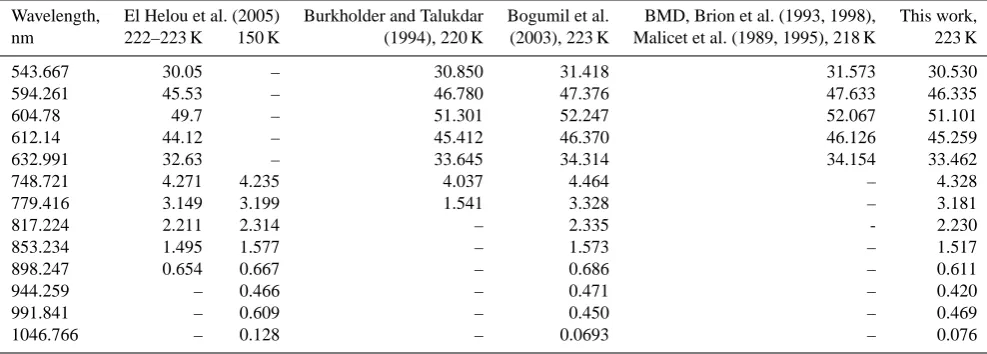
Burkholder and Talukdar (1994) (0.4–1 %), which have re-ported uncertainty of 1 % and better for wavelengths longer than 450 nm. There is a good agreement between our data and the data of El Helou et al. (2005); however, the lat-ter show a reversed temperature dependence around 600 nm. In Table 4, several datasets are compared at discrete wave-lengths taken from El Helou et al. (2005).
High spectral resolution BMD data in the Chappuis band are only available for 218 K. Our data are lower by 2–3 %. BMD report a systematic uncertainty of 1.5 % and random uncertainty of 0.9–2 % in the visible/IR region. Therefore, there is a good agreement between BMD and our data.
Table 4. Comparison of some ozone cross-section datasets at low temperatures in the Chappuis and Wulf bands,×10−22cm2molecule−1.
Wavelength, El Helou et al. (2005) Burkholder and Talukdar Bogumil et al. BMD, Brion et al. (1993, 1998), This work, nm 222–223 K 150 K (1994), 220 K (2003), 223 K Malicet et al. (1989, 1995), 218 K 223 K
543.667 30.05 – 30.850 31.418 31.573 30.530
594.261 45.53 – 46.780 47.376 47.633 46.335
604.78 49.7 – 51.301 52.247 52.067 51.101
612.14 44.12 – 45.412 46.370 46.126 45.259
632.991 32.63 – 33.645 34.314 34.154 33.462
748.721 4.271 4.235 4.037 4.464 – 4.328
779.416 3.149 3.199 1.541 3.328 – 3.181
817.224 2.211 2.314 – 2.335 - 2.230
853.234 1.495 1.577 – 1.573 – 1.517
898.247 0.654 0.667 – 0.686 – 0.611
944.259 – 0.466 – 0.471 – 0.420
991.841 – 0.609 – 0.450 – 0.469
1046.766 – 0.128 – 0.0693 – 0.076
Fig. 9. Ozone cross-sections in the Wulf band at different temper-atures. Lines – new data and Bogumil et al. (2003); squares – El Helou et al. (2005). The spectral channels from SAGE II are indi-cated by short vertical lines.
3.4.3 NIR region 700–1100 nm
The region around 760 nm contains an absorption band of oxygen, which is visible in the Bogumil et al. (2003) dataset due to the oxygen–ozone mixture used during the measure-ments. The Bogumil et al. (2003) data do not show any clear temperature dependence. The new dataset measured using pure ozone is free of oxygen absorption and shows a clear temperature dependence (Fig. 8b). Absolute values are lower by a few percent (3–4 %) compared to Bogumil et al. (2003). The data of Enami et al. (2004) show similar temperature dependence, but cross-sections are higher than the new data (about 2–3 %).
There is good agreement in the NIR spectral region be-tween this study and the data of Bogumil et al. (2003) and El Helou et al. (2005), both in absolute values and in
the temperature dependence. Measurements of El Helou et al. (2005) performed at 150 K are only slightly different from those at 223 K.
Temperature dependence in the NIR region around 1000 nm is somewhat masked by the low signal-to-noise ratio in the Bogumil et al. (2003) dataset. The new dataset reveals a clear temperature dependence, and it resolves the rotational structure (Fig. 9). At wavelengths longer than 1050 nm our cross-sections drastically drop and have low signal-to-noise ratio. Our FTS setup was not optimized for this spectral re-gion.
4 Conclusions
Most of the broadband datasets measured so far for different temperatures were either limited in spectral region or resolu-tion, or were scaled to literature data, thus inheriting uncer-tainties from previous studies. Our experimental setup made it possible to obtain absolute high-resolution broadband data at various temperatures down to a record low 193 K. The un-certainty of the absolute measurements related to the ozone decay practically disappears at temperatures below 243 K due to the very slow decay time compared to the typical mea-surements duration. A spectroscopic method using measure-ments of the oxygen A-band was used to obtain an indepen-dent estimate of the mean gas temperature across the absorp-tion cell in addiabsorp-tion to the commonly used contact tempera-ture sensors.
The new data agree within experimental uncertainty with the BMD dataset at all temperatures, excluding the region near 380 nm at low temperatures (below 1 % in the Hartley band, 1–2 % in the Huggins band and about 2–3 % in the Chappuis band).
cross-sections, both inside and outside of the previously available temperatures range. Our study confirms that a second-order polynomial reproduces the temperature depen-dence of the experimental data in the Huggins band within the experimental uncertainty limits. The new dataset ob-tained at 11 temperatures provides more accurate temper-ature parameterization compared to that typically derived from 4 to 5 temperature points in the literature data that are currently used in the ozone retrievals.
We found a weak temperature dependence on the top of the Hartley and Chappuis bands, which is however within ex-perimental uncertainties. In the Wulf band we obtain a clear temperature dependence in agreement with low-resolution measurements reported by Bogumil et al. (2003). We plan to investigate temperature dependence in the NIR region in more details using an improved dual-channel FTS setup with higher signal-to-noise ratio. Improved measurements in the thermal IR can also be of interest for comparisons between UV, visible, NIR and thermal IR ozone retrievals in the cur-rent and future remote sensing missions. The NIR measure-ments as well as new measuremeasure-ments near 380 nm (absorp-tion minimum between Higgins and Chappuis bands) are on-going.
The new ozone cross-sections are available on the homepage of the Molecular Spectroscopy Laboratory of the Institute of the Environmental Physics, Uni-versity of Bremen (http://www.iup.uni-bremen.de/gruppen/ molspec/databases/index.html). Cross-section updates from future measurements are expected and will be made avail-able on our homepage.
Acknowledgements. This study was produced within the frame-work of a project devoted to the harmonization of the satellite cross-section datasets, initiated at the University of Bremen and supported in part by the European Space Agency (within the ESA HARMONICS project), by the State of Bremen, University of Bremen, and DLR.
Edited by: J. Staehelin
References
Anderson, S. M. and Mauersberger, K.: Laser measurements of ozone absorption cross sections in the Chappuis band, Geophys. Res. Lett., 19, 933–936, 1992.
Baiamonte, V. D., Snelling, D. R., and Bair, E. J.: Vibrational energy of ozone during photolytic explosion, J. Chem. Phys., 44, 673– 682, 1966.
Banichevich, A., Peyerimhoff, S. D., and Grein, F.: Potential energy surfaces of ozone in its ground state and in the lowest-lying eight excited states, Chem. Phys., 178, 155–188, 1993.
Barnes, J. and Mauersberger, K.: Temperature dependence of the ozone absorption cross section at the 253.7 nm Mercury line, J. Geophys. Res., 92, 14861–14864, 1987.
Brion, J., Chakir, A., Daumont, D., Malicet, J., and Parisse, C.: High-resolution laboratory absorption cross section of O3.
Tem-perature effect, Chem. Phys. Lett., 213, 610–612, 1993. Brion, J., Chakir, A., Charbonnier, J., Daumont, D., Parisse, C.,
and Malicet, J.: Absorption spectra measurements for the ozone molecule in the 350–830 nm region, J. Atmos. Chem., 30, 291– 299, 1998.
Bogumil, K., Orphal, J., Homann, T., Voigt, S., Spietz, P., Fleis-chmann, O. C., Vogel, A., Hartmann, M., Bovensmann, H., Fr-erick, J., and Burrows, J. P.: Measurements of molecular ab-sorption spectra with the SCIAMACHY pre-flight model: instru-ment characterization and reference data for atmospheric remote-sensing in the 230–2380 nm region, J. Photoch. Photobio. A., 157, 157–167, 2003.
Burkholder, J. B. and Talukdar, R. K.: Temperature Dependence of the Ozone, Geophys. Res. Lett., 21, 581–584, 1994.
Burrows, J. P., Richter, A., Dehn, A., Deters, B., Himmelmann, S., Voigt, S., and Orphal, J.: Atmospheric Remote-Sensing Refer-ence Data from GOME. 2. Temperature-Dependent Absorption Cross Sections of O3in the 231–794 nm range, J. Quant.
Spec-trosc. Ra., 61, 509–517, 1999.
Chehade, W., Gür, B., Spietz, P., Gorshelev, V., Serdyuchenko, A., Burrows, J. P., and Weber, M.: Temperature dependent ozone absorption cross section spectra measured with the GOME-2 FM3 spectrometer and first application in satellite retrievals, At-mos. Meas. Tech., 6, 1623–1632, doi:10.5194/amt-6-1623-2013, 2013.
Coldewey-Egbers, M., Weber, M., Lamsal, L. N., de Beek, R., Buchwitz, M., and Burrows, J. P.: Total ozone retrieval from GOME UV spectral data using the weighting function DOAS approach, Atmos. Chem. Phys., 5, 1015–1025, doi:10.5194/acp-5-1015-2005, 2005.
El Helou, Z., Churassy, S., Wannous, G., Bacis, R., and Boursey, E.: Absolute cross sections of ozone at atmospheric temperatures for the Wulf and the Chappuis bands, J. Chem. Phys., 122, 244311, doi:10.1063/1.1937369, 2005.
Enami, S., Ueda, J., Nakano, Y., Hashimoto, S., and Kawasaki, M.: Temperature-dependent absorption cross sections of ozone in the Wulf-Chappuis band at 759–768 nm, J. Geophys. Res., 109, D05309, doi:10.1029/2003JD004097, 2004.
Gorshelev, V., Serdyuchenko, A., Weber, M., Chehade, W., and Burrows, J. P.: High spectral resolution ozone absorption cross-sections – Part 1: Measurements, data analysis and comparison with previous measurements around 293 K, Atmos. Meas. Tech., 7, 609–624, doi:10.5194/amt-7-609-2014, 2014.
Guer, B., Spietz, P., Orphal, J., and Burrows, J. P.: Absorption Spec-tra Measurements with the GOME-2 FMs using the IUP/IFE-UB’s Calibration Apparatus for Trace Gas Absorption Spec-troscopy CATGAS, Final Report, Contract No. 16007/02/NL/SF, ESA/EUMETSAT, Bremen, 2005.
Hearn, A. G.: The absorption of Ozone in the Ultra-violet and Visi-ble Regions of the Spectrum, P. Phys. Soc., 78, 932–940, 1961. Liu, X., Chance, K., Sioris, C. E., and Kurosu, T. P.: Impact of
Malicet, J., Brion, J., and Daumont, D.: Temperature dependence of the absorption cross-section of ozone at 254 nm, Chem. Phys. Lett., 158, 293–296, 1989.
Malicet, J., Daumont, D., Charbonnier, J., Chakir, C., Parisse, A., and Brion J.: Ozone UV Spectroscopy. II: Absorption cross sec-tions and temperature dependence, J. Atmos. Chem., 21, 263– 273, 1995.
Orphal, J.: A critical review of the absorption cross-sections of O3
and NO2in the ultraviolet and visible, J. Photoch. Photobio. A.,
157, 185–209, 2003.
Paur, R. J. and Bass, A. M.: The Ultraviolet Cross-Sections of Ozone: II. Results and temperature dependence, in: Atmospheric ozone; Proc. Quadrennial Ozone Symposium, edited by: Zeferos, C. S. and Ghazi, A., Halkidiki Greece, 1984, Dordrecht: Reidel, D., 611–615, 1984.
Rothman, L. S., Gordon, I. E., Barbe, A., Benner, C. D., Bernath, P. F., Birk, M., Boudon, V., Brown, L. R., Campargue, A., Cham-pion, J.-P., Chance, K., Coudert, L. H., Dana, V., Devi, V. M., Fally, S., Flaud, J.-M., Gamache, R. R., Goldman, A., Jacque-mart, D., Kleiner, I., Lacome, N., Lafferty, W. J., Mandin, J.-Y., Massie, S. T., Mikhailenko, S. N., Miller, C. E., Moazzen-Ahmadi, N., Naumenko, O. V., Nikitin, A. V., Orphal, J., Perevalov, V. I., Perrin, A., Predoi-Crosss, A., Rinsland, C. P., Rotger, M., Šimeˇckova, M., Smith, M. A. H., Sung, K., Tashkun, S. A., Tennyson, J., Toth, R. A., Vandaele, A. C., and Auwera Vander, J.: The HITRAN 2008 molecular spectroscopic database, J. Quant. Spectrosc. Ra., 110, 533–572, 2009.
Scarnato, B., Staehelin, J., Peter, T., Groebner, J., and Stuebi, R.: Temperature and slant path effects in Dobson and Brewer total ozone measurements, J. Geophys. Res., 114, D24303, doi:10.1029/2009JD012349, 2009.
Voigt, S., Orphal, J., Bogumil, K., and Burrows, J. P.: The temper-ature dependence (203–293 K) of the absorption cross sections of O3in the 230–850 nm region measured by Fourier-Transform