www.the-cryosphere.net/9/1401/2015/ doi:10.5194/tc-9-1401-2015
© Author(s) 2015. CC Attribution 3.0 License.
Modelling annual mass balances of eight Scandinavian glaciers
using statistical models
M. Trachsel1and A. Nesje2
1Department of Biology, Bergen, Norway
2Department of Earth Science and Uni Climate, Bergen, Norway
Correspondence to: M. Trachsel ([email protected]) and A. Nesje ([email protected])
Received: 15 December 2014 – Published in The Cryosphere Discuss.: 15 January 2015 Revised: 25 June 2015 – Accepted: 4 July 2015 – Published: 31 July 2015
Abstract. Mass balances of Scandinavian glaciers are mainly influenced by winter precipitation and summer temperature. We used simple statistical models to assess the relative im-portance of summer temperature and winter precipitation for annual balances of eight glaciers in Scandinavia. Winter pre-cipitation was more important for maritime glaciers, whereas summer temperature was more important for annual bal-ances of continental glaciers. Most importantly relative im-portances of summer temperature and winter precipitation were not stable in time. For instance, winter precipitation was more important than summer temperature for all glaciers in the 25-year period 1972–1996, whereas the relative im-portance of summer temperature was increasing towards the present. Between 1963 and 1996 the Atlantic Multidecadal Oscillation (AMO) index was consistently negative and the North Atlantic Oscillation (NAO) Index was consistently positive between 1987 and 1995, both being favourable for glacier growth. Winter precipitation was more important than summer temperature for annual balances when only consid-ering subsets of years with high NAO-index and negative AMO-index, respectively, whereas the importance of sum-mer temperature was increased analysing subsets of years with low NAO-index and positive AMO-index, respectively. Hence, the relative importance of precipitation and tempera-ture for mass balances was probably influenced by the state of the AMO and the NAO, as these two indexes are associ-ated with changes in summer temperature (AMO) and winter precipitation (NAO).
1 Introduction
sensitivi-ties that changes in temperature are more important for con-tinental glaciers than for maritime glaciers in southern Nor-way, as a larger change in precipitation is needed to counter-balance a temperature change of 1 K. But it is not possible to directly assess if changes in temperature or precipitation are more important for the annual balances of one glacier. Relative and thereby directly comparable sensitivities of an-nual balances to changes in temperature and precipitation are therefore not obtained from climate sensitivities.
Further studies have explicitly assessed the relative im-portance of winter balance and summer balance for an-nual balance by correlating the summer and winter balances with annual balance (Nesje et al., 2000). Nesje et al. (2000) showed that the correlation between winter balance and an-nual balance is higher than the correlation between sum-mer balance and annual balance for maritime glaciers and vice versa for continental glaciers. Mernild et al. (2014) replicated this analysis using data from 1970 to 2009. An-dreassen et al. (2005) used ratios of standard deviations of winter balances (sBw) to standard deviations of annual bal-ances (sBa, sBw/sBa) and standard deviations of summer balances (sBs) to standard deviations of annual balances (sBs/sBa) to assess the relative importance of summer and winter balance for the annual balance. These ratios are di-rect measures of the relative importance of summer balance and winter balance for annual balances. Hence absolute influ-ences of temperature and precipitation on annual balances as well as relative influences of winter and summer balance on annual balances have been assessed. In this study, we com-bine these two approaches and focus on determining rela-tive and thereby directly comparable importances of winter precipitation and summer temperature for annual balances of glaciers in Scandinavia.
Assessing the relative importance of seasonally averaged summer temperature and winter precipitation for annual bal-ances and possible changes in time is especially interest-ing in light of palaeoclimatological interpretation of glacier records. In palaeoclimatology, at best summer temperature, winter precipitation and annual balance reconstructions are available and attempts have been made to reconstruct winter precipitation based on glacier reconstructions and indepen-dent summer temperature reconstructions (e.g. Bakke et al., 2005).
There are well-known transient phases of positive annual balances (e.g. 1987–1995, e.g. Nesje et al., 2000). It is there-fore interesting to assess if the relative importance of sum-mer temperature and winter precipitation for annual balance changes through time. Until now, attempts of quantifying temporal changes of summer balance and winter balance on annual balance have been constrained to estimating running means of summer and winter balances and comparing the absolute values of these running means (e.g. Engelhardt et al., 2013). However, a direct assessment of temporal changes of the relative importance of summer temperature and win-ter precipitation for annual balances is still missing.
Cumula-tive annual balances show clear patterns of consistently pos-itive mass balances and thereafter consistently negative mass balances (e.g. Nesje et al., 2000, Fig. 3). We therefore hy-pothesise that the relative importance of summer temperature and winter precipitation for annual balances is not stable in time and that there is a large-scale forcing mechanism caus-ing these changes. These forccaus-ings could either be of atmo-spheric or oceanic origin. It is, for instance, well known that increased amounts of winter precipitation in Scandinavia are associated with stronger zonal moisture advection that is due to pressure differences between Iceland and the Azores (e.g. Wanner et al., 2001). These pressure differences are summa-rized by the North Atlantic Oscillation (NAO) Index. In ad-dition to the atmosphere, systematic changes in ocean tem-peratures may also influence the relative importance of sum-mer temperature and winter precipitation for annual balances of glaciers in Scandinavia. The Atlantic Multidecadal Oscil-lation (AMO) is a pattern of changing sea-surface tempera-tures in the North Atlantic (e.g. Schlesinger and Ramankutty, 1994). Changing sea surface temperatures might result in changing temperatures over land and thereby also alter the relative importance of summer temperature and winter pre-cipitation for annual balances.
In this study, we focus on assessing the relative importance of winter precipitation and summer temperature for annual mass balances, temporal changes of these influences and on possible influences of large-scale atmospheric and oceanic patterns on these temporal changes. The aims of this study are therefore threefold: (i) model the annual mass balances of eight Scandinavian glaciers with long annual mass bal-ance series using a suite of statistical models using season-ally averaged climate data as input variables. These models enable us to compare the relative importance of winter pre-cipitation and summer temperature for annual mass balances of glaciers; (ii) assessing temporal changes of relative impor-tances of winter precipitation and summer temperature. (iii) Compare these temporal changes to large-scale oceanic and atmospheric modes, such as the Atlantic Multidecadal Oscil-lation (AMO) and the North Atlantic OscilOscil-lation (NAO).
2 Data and methods 2.1 Data
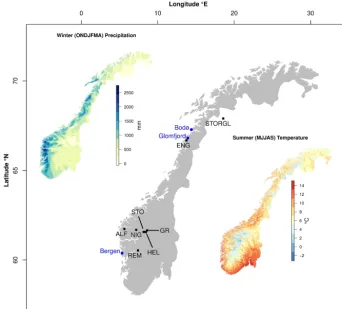
Figure 1. Map of glaciers and summer temperature and winter precipitation. Glaciers: Ålfotbreen (ALF), Rembesdalsskåka (REM), Nigards-breen (NIG), StorNigards-breen (STO), HellstuguNigards-breen (HEL), GråsuNigards-breen (GR), EngaNigards-breen (ENG) and Storglaciären (STORGL). Meteorological stations Bergen, Glomfjord and Bodø are indicated. Inset maps show 1961–1990 normal summer (MJJAS) temperature and winter (OND-JFMA) precipitation (data available at http://met.no/Klima/Klimastatistikk and processed in R).
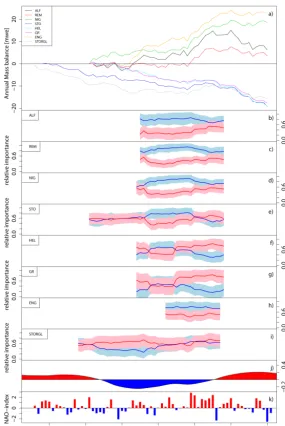
(Kjøllmoen, 2011; Andreassen and Winsvold, 2012) and bolin.su.se/data/tarfala. For all glaciers, winter balances, summer balances and annual balances are available. Uncer-tainties of mass balance measurements and their possible sources are thoroughly discussed in Andreassen et al. (2005) and are estimated to between±0.2 and±0.4 m w.e. per year. Cumulative mass balance changes are shown in Fig. 3. The three maritime glaciers Ålfotbreen (ALF), Rembesdalsskåka (REM), and Nigardsbreen (NIG) in southern Norway and the maritime glacier Engabreen (ENG) in northern Norway show positive cumulative annual balances between the initiation of the measurements and 2010 (Fig. 3). Mass balances are es-pecially positive during the first half of the 1990s. The conti-nental glaciers Storbreen (STO), Hellstugubreen (HEL), and Gråsubreen (GR) in southern Norway and the continental glacier Storglaciären (STORGL) in northern Sweden expe-rienced negative cumulative mass balances between the start of the measurements and 2010. For these glaciers the mass balance loss was reduced in the first half of the 1990s.
We used meteorological data from the meteorological sta-tion Bergen-Florida to model mass balances in southern Nor-way. We decided to exclusively use precipitation data from
Bergen-Florida for all glaciers in southern Norway since Bergen-Florida records the large synoptic weather systems and is not affected by local topographic effects that are af-fecting meteorological stations in the deep and narrow val-leys closer to the glaciers studied (e.g. Nesje, 2005). For glaciers in northern Scandinavia, we used meteorological data from the coastal station Glomfjord available from the beginning of the mass balance series. The temperature mea-surements are continuous, but the precipitation series ends in 2003. We extended the precipitation series with data from the nearby Bodø meteorological station. The precipitation data from Bodø were scaled to the data from Glomfjord in the period of overlap (1953–2003) of the two data series.
2.2 Methods
(i) Linear models using a climate index as independent variable,
(ii) Linear models using summer temperature and winter precipitation as independent variables,
(iii) Additive models using summer temperature and winter precipitation as independent variables.
If the variance explained by two models was not signif-icantly different, we favoured the simpler model, as it was more parsimonious.
As glaciers are mainly sensitive to summer temperatures and winter precipitation, models were run using one sum-mer temperature and one winter precipitation as independent variables. We tested the influences of two summer temper-atures, namely temperatures from May–September (T MJ-JAS) and temperatures from June–August (T JJA), and two winter precipitation variables, precipitation October to April (P ONDJFMA) and precipitation from November–March (P NDJFM) on annual glacier mass balances. This resulted in a total of four possible combinations of input variables. We chose the combination that resulted in the lowest Akaike in-formation criterion (AIC).
2.2.1 Climate indices
The simplest way of modelling the influence of (winter) pre-cipitation and (summer) temperature on glacier mass bal-ances is to generate a climate index, where winter precipi-tation and summer temperature are equally weighted (Imhof et al., 2012; Nesje, 2005), i.e. they are assigned the same rel-ative importance for the annual balance. This was achieved by standardising summer temperature and winter precipita-tion and subtracting standardised summer temperature from standardised winter precipitation, as the two variables have opposed influences.
z= P−P sP
!
− T−T sT
!
(1)
y=a+b·z, (2)
where z is the climate index, P winter precipitation, T summer temperature,s are standard deviations, bars denote means,y is the annual mass balance andaandbare regres-sion coefficients.
2.2.2 Linear models
Annual mass balances were modelled using linear models with one (summer) temperature and one (winter) precipi-tation variable as independent variables. In a first step, we tested interactions between (summer) temperature and (win-ter) precipitation and quadratic terms for significance. F-tests indicated that neither interaction terms, nor quadratic terms were significant (p <0.05).
The linear regression equation
y=a+b1·x1+b2·x2 (3) is interpreted as follows: if x2 is kept constant and x1 is changed by one unit, y changes byb1 units (e.g. Legendre and Legendre, 2012). Hence the regression coefficients of unscaled variables are also the climate sensitivity of this vari-able. Usually,x1andx2are measured in different units ham-pering the comparison of the influence of the two variables ony. This problem is, however, solved by standardising all the variables. The effect of standardisation is two-fold:
(i) The intercept of the regression model is zero, and more importantly
(ii) The standard regression coefficients are now compara-ble and are “a means of assessing the relative impor-tance of each explanatory variablexjincluded in the re-gression model: the variables with the highest standard regression coefficient (in absolute values) are those that contribute the most to the estimatedy˙ values” (Legen-dre and Legen(Legen-dre, 2012). In our case, using standard-ised annual balances, standardstandard-ised winter precipitation and standardised summer temperature, the standard re-gression coefficients for winter precipitation and sum-mer temperature are directly comparable and indicate the relative importance of summer temperature and win-ter precipitation for the annual mass balance.
For standardized variables, calculus with
B= X0·X−1
· X0·Y
(4) as starting point (Legendre and Legendre, 2012), where X is a matrix of independent variables,Y is the dependent vari-able andBis a vector of coefficients linking X andY in the regression equation, proof that the standard regression coef-ficients are estimated as:
b1=
rx1y−rx1x2·rx2y
1−rx21x2 (5)
b2=
rx2y−rx1x2·rx1y
1−rx21x2 , (6)
whereb1andb2are the standard regression coefficients of the first and second independent variable, respectively,rx1y
is the correlation between the first independent and the de-pendent variable,rx2y is the correlation between the second
independent variable and the dependent variable andrx1x2is the correlation between the two independent variables.
Hence the standard regression coefficients, which are the relative importance of (in our case) winter precipitation and summer temperature for annual balance only depend on the correlations among winter precipitation, summer tempera-ture and annual balance.
individually weighted when using linear models, whereas the two independent variables are equally weighted when em-ploying the climate index. Hence, the relative importances of summer temperature and winter precipitation are allowed to be different using linear models, whereas they are artificially kept similar using climate index models. Linear models were compared to models based on climate indices usingF tests.
In contrast to pvalues and confidence bounds, Bayesian credible intervals are simple to interpret. We used the sim-plest possible Bayesian model, namely setting a uniform prior for the two standard regression coefficients for winter precipitation and summer temperature. This results in poste-rior distributions for the parameter estimates that are propor-tional to the maximum likelihood estimates of the parame-ter values. Bayesian credible inparame-tervals are simple to inparame-terpret and indicate the parameter space within which a parameter is found with a certain probability. In this study, we interpreted the relative importance of summer temperature and winter precipitation as different, when the median of the posterior distribution of one parameter was outside the 2.5 and 97.5 percentiles of the posterior distribution of the other parame-ter.
2.2.3 Additive models
In contrast to linear models, where coefficients link indepen-dent and depenindepen-dent variables, this linking is achieved by a smoothing term in additive models
y=a+f1(x1)+f2(x2) (7) (Zuur et al., 2009; Fig. 2). We used cubic regressions splines with three knots as smoothing terms. The number of knots was kept low to ensure monotony of the smoothing terms. The additive models were compared to linear models and cli-mate index models byF tests.
With the three statistical models proposed, we assume that errors in mass balance measurements are random and that climate data are error free. If the errors in mass balance mea-surements contain a systematic component, the estimates of relative importance of summer temperature and winter pre-cipitation for annual balance are biased. If annual balances are systematically overestimated, the relative importance of summer temperature for annual balance is systematically un-derestimated.
2.2.4 Cross-validation and analysis in running windows All the models were tested by calculating leave-one-out cross-validation (jack-knifing, e.g. Efron and Gong, 1983) and block cross-validation (Burman et al., 1994) where h-samples are left out on either side of the sample to be pre-dicted. In this study we sethto 2.H block cross-validation is a powerful method to test effects of temporal autocorre-lation in time-series. However, preliminary autocorreautocorre-lation estimations revealed no significant (p <0.05) AR(1)
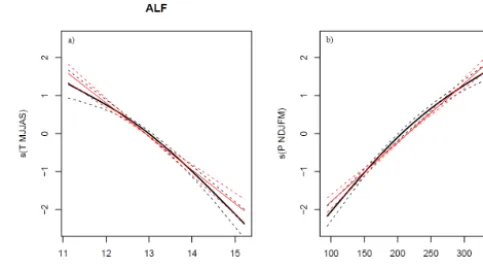
auto-Figure 2. Additive model for Ålfotbreen. (a) Smooth term (S (T MJJAS); black) and linear model (red) for summer temperature (T MJJAS). (b) Smooth term (S(P NDJFM); black) and linear model (red) for winter precipitation (P NDJFM). Dotted lines indicate confidence bounds.
correlation coefficients. We estimated cross-validated mean absolute deviations and coefficients of determination.
After running models for the entire observation period, we wanted to assess if the relative importance of summer temperature and winter precipitation changed through time and if these changes were consistent among the glaciers. For this purpose, we ran models in 25-year moving windows. The significance of changes in variance explained was again tested withF Tests. According to these tests, additive models were never superior to linear models.
2.2.5 Comparison to climate modes
Preliminary analysis in running windows showed changes of relative importance of summer temperature and winter pre-cipitation for annual balances that were consistent for all glaciers in southern Norway. We therefore assessed if these results were influenced by two large-scale patterns of oceanic and atmospheric variability over the north Atlantic realm. The North Atlantic Oscillation (NAO), an atmospheric pat-tern with an approximately decadal cyclicity (Hurrell et al., 2001; Wanner et al., 2001) and the Atlantic Multidecadal Os-cillation (AMO), a pattern in sea-surface temperature that is linked to changes in thermohaline ocean circulation with a cyclicity of 65–70 years (Schlesinger and Ramankutty, 1994; Trenberth and Shea, 2006). The NAO mainly influences the strength and tracks of the westerlies and thereby the amount of winter precipitation in north-western Europe.
influ-Figure 3. (a) Cumulative mass balances of Ålfotbreen (ALF), Rembesdalsskåka (REM), Nigardsbreen (NIG), Storbreen (STO), Hell-stugubreen (HEL), Gråsubreen (GR), Engabreen (ENG) and Storglaciären (STORGL). Data: nve.no/bre (Norwegian glaciers) and bolin.su.se/data/tarfala (Storglaciären, northern Sweden). (b–i) Relative importance (standard regression coefficients) of winter precipita-tion (blue) and summer temperature (red) in 25-year moving windows. Blue (red) lines: median of estimated standard regression coeffi-cients (relative importance) of winter precipitation (summer temperature). Light blue and pink shadings indicate 2.5 and 97.5 % quantiles of Bayesian credible intervals of standard regression coefficients (relative importance). Results are presented as 25-year centred windows. (j) Atlantic Multidecadal Oscillation Index (http://www.esrl.noaa.gov/psd/data/timeseries/AMO/, 30-year loess-smoothed). (k) North Atlantic Oscillation Index (Jones et al., 1997, updated).
ence of the NAO on annual mass balances. We wanted to assess if the relative importance of summer temperature and winter precipitation were dependent on the NAO. Most of the glacier mass balance series investigated were shorter than 50 years. We therefore investigated the effects of changes in NAO by dividing the time series into two subsets with NAO-indices above and below the median of the NAO-index for the period in which mass-balance measurements were available. We then estimated the relative importance of summer
et al., 2005) to see if these ratios were different for mass bal-ance data of years with above and below-median NAO-index. Considering the period 1946–2010, the average monthly November through April precipitation in Bergen was 230 mm for the years with above-median NAO-index and 170 mm in the years with below-median NAO-index, which is significantly lower (p <0.05).
The longest mass balance series started in 1946. The AMO was generally positive from ca. 1930–1962 and from 1997 to the present, whereas it was negative between 1963 and 1996. In the negative subset of the AMO, the correlation between the NAO-index and extended winter precipitation in Bergen wasr=0.82 (p <0.05), whereas it wasr=0.56 (p <0.05) for the years with predominantly positive AMO-index. The average November through April precipitation in Bergen was not differing between the two subsets (200mm/month). The average May through September temperature from Bergen-Florida for the positive AMO subset was 14.4◦C, whereas it was 12.6◦C in the negative AMO subset. Average T MJ-JAS for the period 1949–1962 was 13.8◦C, which is also significantly (p <0.05) higher than the average temperature in the negative AMO subset. As summer temperatures in Bergen were significantly (p <0.05) higher in the positive AMO subset, we wanted to test if this altered the relative importance of summer temperature and winter precipitation for annual balances. This analysis was only carried out for the two long data series starting in 1946 and 1949. The data series were divided into two subsets of years of predomi-nantly positive (1946/1949–1962, 1997–2010) and negative (1963–1996) AMO. We also estimated the ratios sBw/sBa and sBs/sBa (e.g. Andreassen et al., 2005) with AMO+and AMO−.
All calculations were done in R (R Core Team, 2014) and its add-on packages lmodel2 (Legendre, 2014), and mgcv (Wood, 2014).
3 Results
3.1 Model performance
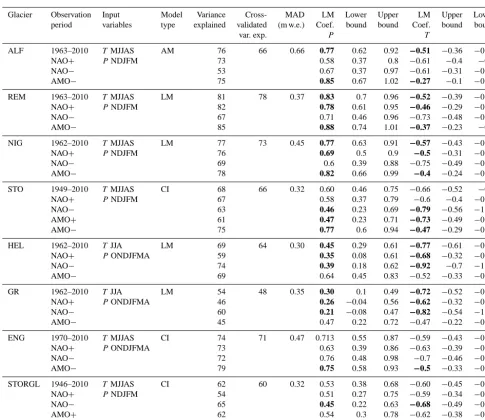
The employed statistical models explained large proportions of the variance of annual mass balances (Table 1). For the maritime glaciers, the models explained more than 70 % of the variance. The variance explained for continental glaciers varied between 50 and 70 %. Table 1 shows input variables, model types, variance explained by the most parsimonious models and standard regression coefficients of linear mod-els (i.e. the relative importance of summer temperature and winter precipitation) and their Bayesian credible intervals. Cross-validated r2using leave-one-out cross-validation and h-block cross-validation were comparable to apparent r2. The only exception was Ålfotbreen, where an additive model was most parsimonious. Cross-validatedr2was reduced by 0.1, i.e. the variance explained was reduced by 10% and
linear models had higherr2 under cross-validation. Cross-validated mean absolute deviations were also lowest for the models chosen, except for Ålfotbreen where again linear models yielded lowest mean absolute deviations.
3.2 Relative importance of summer temperature and winter precipitation
For Storbreen, Engabreen and Storglaciären, the statistical models using climate indices as input variables were most parsimonious. These are the only glaciers where standard regression coefficients of linear models were not different (Table 1). Hence, linear models were also assigning about similar weights to summer temperature and winter precip-itation for these three glaciers. For the maritime glaciers Rembesdalsskåka and Nigardsbreen, linear models indicated a higher relative importance of winter precipitation than of summer temperature, whereas for the continental glaciers Hellstugubreen and Gråsubreen, the relative importance of summer temperature was higher than the relative importance of winter precipitation. For the maritime Ålfotbreen, an ad-ditive model explained significantly (p <0.05) more of the total variance than a linear model. The smooth terms of sum-mer temperature and winter precipitation are shown in Fig. 2. The slope of the smooth for temperature was flatter than the slope of a linear model for below-average temperatures and steeper than the slope of a linear model for above-average temperatures. Hence the expected sensitivity of the annual mass balance for a change of 1◦C increased with increasing temperatures. In contrast, the slope of the smooth for precipi-tation was steeper than the slope of a linear model for below-average precipitation values and was flatter than the slope of a linear model for above-average precipitation levels. The ex-pected sensitivity of the annual mass balance for a change in precipitation decreased with increasing precipitation. 3.3 Changes in the relative importance of summer
temperature and winter precipitation
Temporal changes of relative importance of summer temper-ature and winter precipitation are shown in Fig. 3b–i. The relative importance of winter precipitation, as indicated by standard regression coefficients of winter precipitation in 25-year running windows, was lowest at the end of the observa-tion period. The relative importance of summer temperature, as indicated by standard regression coefficients of summer temperature in 25-year running windows, increased towards the end of the observation period (Fig. 3b–i).
Table 1. Table of most parsimonious statistical models. Input variables used and model types are indicated along with apparent and cross-validated variance explained. Cross-cross-validated mean absolute deviations and relative importance of summer temperature (LM CoefT) and winter precipitation (LM CoefP) are indicated along uncertainties of estimates of relative importances. Relative importance of summer tem-perature and winter precipitation and apparent variance explained are also indicated for subsets only including years with above (NAO+) and below (NAO−) median NAO-index, years with negative AMO-index (AMO−) and for STO and STORGL years with positive AMO-index (AMO+). ALF (Ålfotbreen), REM (Rembesdalsskåka), NIG (Nigardsbreen), STORBR (Storbreen), HEL (Hellstugubreen), GR (Gråsub-reen), ENG (Engab(Gråsub-reen), STORGL (Storglaciären), Am: Additive Model, LM: Linear Model, CI: Climate Index, NAO: North Atlantic Oscillation, AMO: Atlantic Multidecadal Oscillation.
Glacier Observation Input Model Variance Cross- MAD LM Lower Upper LM Upper Lower period variables type explained validated (m w.e.) Coef. bound bound Coef. bound bound
var. exp. P T
ALF 1963–2010 TMJJAS AM 76 66 0.66 0.77 0.62 0.92 −0.51 −0.36 −0.67
NAO+ PNDJFM 73 0.58 0.37 0.8 −0.61 −0.4 −0.4
NAO− 53 0.67 0.37 0.97 −0.61 −0.31 −0.91
AMO− 75 0.85 0.67 1.02 −0.27 −0.1 −0.44
REM 1963–2010 TMJJAS LM 81 78 0.37 0.83 0.7 0.96 −0.52 −0.39 −0.64
NAO+ PNDJFM 82 0.78 0.61 0.95 −0.46 −0.29 −0.63
NAO− 67 0.71 0.46 0.96 −0.73 −0.48 −0.98
AMO− 85 0.88 0.74 1.01 −0.37 −0.23 −0.5
NIG 1962–2010 TMJJAS LM 77 73 0.45 0.77 0.63 0.91 −0.57 −0.43 −0.75
NAO+ PNDJFM 76 0.69 0.5 0.9 −0.5 −0.31 −0.71
NAO− 69 0.6 0.39 0.88 −0.75 −0.49 −0.98
AMO− 78 0.82 0.66 0.99 −0.4 −0.24 −0.56
STO 1949–2010 TMJJAS CI 68 66 0.32 0.60 0.46 0.75 −0.66 −0.52 −0.8
NAO+ PNDJFM 67 0.58 0.37 0.79 −0.6 −0.4 −0.81
NAO− 63 0.46 0.23 0.69 −0.79 −0.56 −1.01
AMO+ 61 0.47 0.23 0.71 −0.73 −0.49 −0.97
AMO− 75 0.77 0.6 0.94 −0.47 −0.29 −0.64
HEL 1962–2010 TJJA LM 69 64 0.30 0.45 0.29 0.61 −0.77 −0.61 −0.93
NAO+ PONDJFMA 59 0.35 0.08 0.61 −0.68 −0.32 −0.93
NAO− 74 0.39 0.18 0.62 −0.92 −0.7 −1.14
AMO− 69 0.64 0.45 0.83 −0.52 −0.33 −0.71
GR 1962–2010 TJJA LM 54 48 0.35 0.30 0.1 0.49 −0.72 −0.52 −0.91 NAO+ PONDJFMA 46 0.26 −0.04 0.56 −0.62 −0.32 −0.93
NAO− 60 0.21 −0.08 0.47 −0.82 −0.54 −1.09
AMO− 45 0.47 0.22 0.72 −0.47 −0.22 −0.73
ENG 1970–2010 TMJJAS CI 74 71 0.47 0.713 0.55 0.87 −0.59 −0.43 −0.75
NAO+ PONDJFMA 73 0.63 0.39 0.86 −0.63 −0.39 −0.86
NAO− 72 0.76 0.48 0.98 −0.7 −0.46 −0.96
AMO− 79 0.75 0.58 0.93 −0.5 −0.33 −0.68
STORGL 1946–2010 TMJJAS CI 62 60 0.32 0.53 0.38 0.68 −0.60 −0.45 −0.75
NAO+ PNDJFM 54 0.51 0.27 0.75 −0.59 −0.34 −0.83
NAO− 65 0.45 0.22 0.63 −0.68 −0.49 −0.89
AMO+ 62 0.54 0.3 0.78 −0.62 −0.38 −0.86
AMO− 63 0.58 0.37 0.79 −0.52 −0.31 −0.73
maritime glaciers in southern Norway, the Bayesian credi-ble intervals of the standard regression coefficients (relative importances) were not overlapping for 25-year windows cen-tred before 1990, but were overlapping for the last five run-ning windows.
Storbreen indicated about equal importance of winter pre-cipitation and summer temperature for 25-year windows end-ing prior to 1990 (Fig. 3e). The relative importance of sum-mer temperature was higher than the relative importance of
winter precipitation for 25-year windows centred in the first half of the 1970s for Storglaciären (Fig. 3i).
3.4 NAO, AMO and annual balances
Figure 4. Standard deviation ratios. Ratios between standard de-viations of winter balances (sBw) and annual balances (sBa, sBw/sBa, triangles) and summer balances (sBs) and annual bal-ances (sBs/sBw, dots). Standard deviation ratios are shown for the entire measurement period (central symbols, black) and for periods of above (left symbols, blue) and below (right symbols, red) me-dian NAO-index, respectively. For STO, standard deviations during AMO+(orange) and AMO−(cyan) are also indicated. sBw: stan-dard deviation of winter mass balance, sBs: stanstan-dard deviation of summer mass balance; sBa: standard deviation of annual mass bal-ance.
also differed from models covering the entire measurement period.
For years with above-median NAO, models for Ålfot-breen, Rembesdalsskåka, Nigardsbreen and Storbreen ex-plained as much of the variance of the mass balance as mod-els for the entire data series, whereas for Hellstugubreen and Gråsubreen, the variance explained was reduced compared to the models for the entire period. Interestingly, for Ålfotbreen standard regression coefficients for winter precipitation and summer temperature were not different. For the phase with below-median NAO-index, models for Ålfotbreen, Rembes-dalsskåka and Nigardsbreen explained less of the variance than in the entire period and standard regression coefficients for precipitation and temperature were not different, whereas models for Gråsubreen and Hellstugubreen explained more of the variance than in the entire period, and together with Storbreen displayed a higher importance of summer temper-ature than winter precipitation. The two glaciers with long data series had an average mass loss of 0.54 m water equiv-alents per year (m w.e. yr−1) when the NAO-index was low, but an average gain of 0.03 m w.e. yr−1for Storglaciären and an average loss of 0.08 m w.e. yr−1for Storbreen with high NAO-index.
Figure 5. Coefficients of determination (r2) among mass balances and North Atlantic Oscillation (NAO) Index (Jones et al., 1997, up-dated). Coefficients of determinations are shown for the entire mea-surement period (central symbols, black) and for periods of above (left symbols, blue) and below (right symbols, red) median NAO-index, respectively. Bw: winter mass balance, Ba: annual mass bal-ance; NAO: NAO-index.
For all glaciers, except for ALF, the ratio sBs/sBa was lower in years with above-median NAO-index than for the entire data series and the ratio sBw/sBa was higher than for the entire data series for REM, STO, HEL, GR and STORGL (Fig. 4). For years with below-median NAO-index, the ra-tio sBs/sBa was higher than in the entire data series and sBw/sBa was lower than in the entire data series except for ALF and ENG (Fig. 4).
Correlations between NAO-index and winter and annual balance were different for the subsets of years with above and below-median NAO-index (Fig. 5). For glaciers in south-ern Norway, the correlation between NAO-index and winter and annual balance was higher than for the entire time se-ries for years with above-median NAO-index and was lower than for the entire series for years with below-median NAO-index. For NIG, STO, HEL, GR, ENG and STORGL the correlation coefficients among NAO-index and Ba and Bw were not significant at thep <0.05 level for the subset of years with below-median NAO-index. For ALF and REM the correlation between NAO-index and Ba was not signif-icant (p <0.05) for the subset of years with below-median NAO-index.
Stor-glaciären in northern Sweden. For Storbreen, the influence of winter precipitation was significantly higher than the in-fluence of summer temperature with negative AMO-index, whereas the situation was opposite with positive AMO-index (Table 1). For both glaciers, the average annual mass bal-ance was different in the two phases defined by positive and negative AMO indices: Storbreen lost an average of 0.5 and Storglaciären 0.48 m w.e. yr−1when the AMO-index was positive, whereas the loss was reduced to averages of 0.15 and 0.02 m w.e. yr−1 for Storbreen and Storglaciären, respectively, when the AMO-index was negative. The AMO also affected the standard deviation ratios. For Storbreen, the ratios sBs/sBa and sBw/sBa were equal when the AMO was in its negative phase (Fig. 4). During the positive phase of the AMO, sBs/sBa was higher than sBw/sBa.
4 Discussion
4.1 Model Performance
We used simple statistical models that are only taking into ac-count summer temperature and winter precipitation to model annual mass balances. Even though these models are sim-plistic, they explain large proportions of the variance of an-nual balances, and are therefore appropriate to estimate rela-tive importance of summer temperature and winter precip-itation for annual balances. The model performance is in-creased for coastal maritime glaciers. This might have sev-eral reasons: (i) precipitation is highly variable in space and therefore precipitation from Bergen is possibly more appro-priate for coastal glaciers than for continental glaciers. Still, using precipitation from meteorological stations closer to the continental glaciers did not improve the model performance for continental glaciers. (ii) Processes not represented in our model are more important in summer (radiation) than in win-ter (wind redistribution of snow).
Climate sensitivities of Engabreen (Schuler et al., 2005), Rembesdalsskåka (Giesen and Oerlemans, 2010) and Stor-breen (Andreassen and Oerlemans, 2009) show that summer balances are largely unaffected by changes in precipitation, which suggest minor importance of summer precipitation for summer balance. Still other important components such as the direct effect of radiation are not entirely accounted for when only using summer temperature to model ablation. Our models do not take into account the hypsometry of glaciers, which might be important in transitional seasons, where ac-cumulation and ablation can occur simultaneously on one glacier (e.g. Schuler et al., 2005). Although our models do not account for these processes we get coefficients of deter-mination similar to the values found by Rasmussen and Con-way (2005) who used degree day models and RMSEPs lower or comparable to RMSEPs found by Engelhardt et al. (2013). This good performance of statistical models is probably due to the distinct accumulation and ablation seasons on
Scandi-navian glaciers i.e. most accumulation occurring during win-ter and most ablation taking place during summer. In areas with less distinct accumulation and ablation seasons, statisti-cal models using seasonally averaged climate variables will not perform well.
The application of statistical models using seasonally av-erage climate as input variables seems especially interesting for two areas of application:
(i) Regions where only seasonal climate data are avail-able (especially precipitation data) this problem can be overcome by using reanalysis data (e.g. Rasmussen and Conway, 2005). Rasmussen and Conway (2005) used reanalysis data for other reasons than lack of station data.
(ii) Palaeoclimate studies where reconstructed climate data are at maximum available at monthly resolution. For ex-ample Steiner et al. (2008) estimated the relative im-portance of changes in seasonally averaged precipita-tion and temperature during advance and retreat periods of Nigardsbreen and Lower Grindelwald Glacier (Swiss Alps) using artificial neural networks.
4.2 Relative importance of summer temperature and winter precipitation
using degree day models. Modelled annual balances showed a strong positive bias for NIG and a strong negative bias for STO. Hence assessing the relative importance of winter precipitation and summer temperature on annual balances of NIG and STO seems difficult.
4.3 Changes of relative importance of summer temperature and winter precipitation
As shown in this study, the relative importance of summer temperature and winter precipitation for annual balances is not constant in time. Temporal changes in relative impor-tance of summer temperature and winter precipitation are consistent for all of southern Norway (Fig. 3), suggesting common large-scale forcing of the relative importance of summer temperature and winter precipitation.
Maritime glaciers had a consistently positive mass balance between 1988 and 1996 and continental glaciers were no longer loosing mass (Fig. 3a, Nesje et al., 2000; Andreassen et al., 2005; Nesje and Matthews, 2012). Looking at the 25-year windows centred between 1978 and 1984, we found that winter precipitation was more important than summer tem-perature for all glaciers including the continental glaciers in southern Norway, although the differences were not signifi-cant for the continental Gråsubreen. For the three continental glaciers in southern Norway, this phase was characterised by a marked decrease in relative importance of summer temper-ature and a marked increase in relative importance of winter precipitation.
In this phase, the AMO-index was consistently negative and the NAO-indexes were consistently positive between 1988 and 1996 (Fig. 3). In tendency, negative AMO in-dices were associated with reduced summer temperatures over Europe and positive NAO-indexes were associated with increased zonal flow in winter, entailing more winter precip-itation in Northern Europe. Hence, the large-scale oceanic and atmospheric patterns were favourable for glacier growth. As another example, in the 2000s all glaciers except Engabreen and Nigardsbreen generally experienced nega-tive mass balances and mass balances of Engabreen and Ni-gardsbreen were at equilibrium. In this period, the impor-tance of summer temperature for the annual mass balance was increased (Fig. 3), even though 25-year windows cen-tred around 1997 still contained the years 1988–1996 with their transient mass surplus. The increasing relative tance of summer temperature and decreasing relative impor-tance of winter precipitation for the annual balance at the end of the measurement period is consistent with more nega-tive summer balances and less posinega-tive winter balances found for glaciers in southern Norway (e.g. Engelhardt et al. 2013). The AMO-index changed sign in the late 1990s and summer temperatures were in general higher than between 1985 and 1995.
For glaciers in the European Alps, Huss et al. (2010) found pronounced mass loss during phases of positive AMO-index
and mass gain in phases of negative AMO-index, which is similar to findings in this study. The phases of increased glacier melt are, however, not simultaneous in the Swiss Alps and in Scandinavia. In the Swiss Alps, a pronounced mass loss lasting to the present day started in the late 1980s, whereas continental glaciers in Scandinavia lost mass be-tween the start of the measurements and 1987 and all glaciers in Scandinavia lost mass after about 1998. This difference is most probably caused by the fact that changes in melt rates are most influential for mass balances in the Alps (Huss et al., 2010), whereas a decade with predominantly positive NAO-indexes began in the late 1980s (1988/1989 winter) associ-ated with increased relative importance of winter precipita-tion for Scandinavian glaciers (Fig. 3). This is in line with Marzeion and Nesje (2012) who found a positive correla-tion between the NAO and glaciers in southern Scandinavia, while a weak anti-correlation was found for the western Alps. This anti-correlation was diminishing towards east. Six et al. (2001) point out that anti-correlations between glacier mass balances in the alps and Scandinavia are mainly found in decadally smoothed data and attribute this to the NAO, whereas only weak anti-correlations are found using annual data.
4.4 NAO, AMO and annual mass balances
Clear differences are found between the subsets with above-median and below-above-median NAO-index. In winters with high NAO-index, stronger westerly flow and increased precipita-tion is expected (e.g. Wanner et al., 2001). The mass balance models of the maritime glaciers explained more of the total variance with high NAO-index and the relative importance of winter precipitation for the total mass balance was increased. This was according to expectations, as increased winter pre-cipitation is expected to increase the importance of the winter precipitation for mass balance models.
between the NAO-index and glacier length changes in Scan-dinavia as well as in the Alps were also found by Imhof et al. (2011).
For the two glaciers with long mass balance time-series, the influence of the NAO seemed equal to the influence of the AMO, as the difference between the average mass bal-ances in the two NAO levels considered was about equal to the difference in the two AMO states. The AMO states only include consecutive years, whereas individual years were as-signed to the NAO-index. The phase between ca. 1987 and 1995 with major mass gain for maritime glaciers and neu-tral mass balances for continental glaciers was characterised by negative AMO-index and predominantly positive NAO-index, that were both favourable for glaciers.
The relation between AMO and NAO seems rather com-plex and depends on the timescale considered (Li et al., 2013; Peings and Magnusdottir, 2014). On short timescales, the at-mospheric NAO pattern influences the sea surface ture, whereas on longer timescales, the sea-surface tempera-ture AMO pattern drives the atmospheric NAO. Hence Li et al. (2013) find the NAO to lead the AMO by 16 years and state that the NAO is an excellent predictor for AMO and thereby Northern Hemisphere temperature, whereas Peings and Magnusdottir (2014) find “that the multidecadal fluctua-tions of the wintertime North Atlantic Oscillation (NAO) are tied to the AMO, with an opposite signed relationship be-tween the polarities of the AMO and the NAO. Our statistical analyses suggest that the AMO signal precedes the NAO by 10–15 years”.
The association of negative AMO and positive NAO seems to be typical (Peings and Magnusdottir 2014), whereas pos-itive AMO favours negative NAO and blocking situations. For the time period 1965–1998, with negative AMO, only 10 years have a negative NAO-index, whereas for the consider-ably shorter phase 1999–2010 already 6 years had a negative NAO-index. Hence, the two modes favouring glacier mass gain and mass loss, respectively, tended to occur simultane-ously. However, the influence of AMO and NAO should not be overestimated, as similar weather patterns still result in different amounts of precipitation and in different levels of temperature (Jacobeit et al., 2003; Kuettel et al., 2011). Kuet-tel et al. (2011), for instance, attribute 60 % of the changes of winter precipitation over southern Norway between the pe-riods 1900–1949 and 1950–1999 to changes within weather patterns and only 40 % to changes in frequencies of weather patterns.
5 Conclusions
We used simple statistical models to assess the relative im-portance of summer temperature and winter precipitation for annual balances of eight glaciers in Scandinavia. The relative importances found using statistical models were comparable to estimates of relative importance obtained using different
methods. Most importantly, the relative importance of sum-mer temperature and winter precipitation for annual balances varied through time. Winter precipitation was most important when the Atlantic Multidecadal Oscillation Index was nega-tive and the North Atlantic Oscillation Index was posinega-tive. Presently, the relative importance of winter precipitation de-creased for all glaciers while the relative importance of sum-mer temperature was increasing. The influence of NAO and AMO on the relative importance of summer temperature and winter precipitation for annual balance was confirmed con-sidering subsets of different NAO and AMO levels, with in-creasing relative importance of winter precipitation in years with NAO+and AMO−and increased relative importance of summer temperature in years with AMO+and NAO−. The relation between NAO and winter balances was lost only considering years with low NAO-index.
The Supplement related to this article is available online at doi:10.5194/tc-9-1401-2015-supplement.
Acknowledgements. We would like to thank two reviewers for comprehensive comments that improved the clarity of this manuscript. We also thank Pascal Hänggi for comments on an earlier version of this manuscript and Heinz Wanner for discussion of large-scale climate patterns as the NAO and the AMO.
Edited by: J. O. Hagen
References
Andreassen, L. M. and Oerlemans, J.: Modelling Long-Term Sum-mer and Winter Balances and the Climate Sensitivity of Stor-breen, Norway, Geogr. Ann. Ser.-Phys. Geogr., 91, 233–251, 2009.
Andreassen, L. M. and Winsvold, S. H.: Inventory of Norwegian Glaciers. Norwegian Water Resources and Energy Directorate, Rapport 38-2012, NVE, Oslo, 2012.
Andreassen, L. M., Elvehoy, H., Kjollmoen, B., Engeset, R. V., and Haakensen, N.: Glacier mass-balance and length variation in Norway, Ann. Glaciol., 42, 317–325, 2005.
Andreassen, L. M., Elvehøy, H., Johannesson, T., Oerlemans, J., Beldring, S., and van den Broeke, M.: Modelling the climate sensitivity of Storbreen and Engabreen, Norway. Norwegian Wa-ter Resources and Energy Directorate, Report no. 3, NVE, Oslo, 2006.
Bakke, J., Dahl, S. O., Paasche, O., Lovlie, R., and Nesje, A.: Glacier fluctuations, equilibrium-line altitudes and palaeocli-mate in Lyngen, northern Norway, during the Lateglacial and Holocene, Holocene, 15, 518–540, 2005.
Burman, P., Chow, E., and Nolan, D.: A Cross-Validatory Method for Dependent Data, Biometrika, 81, 351–358, 1994.
Efron, B. and Gong, G.: A Leisurely Look at the Bootstrap, the Jackknife, and Cross-Validation, Am. Stat., 37, 36–48, 1983. Engelhardt, M., Schuler, T. V., and Andreassen, L. M.: Glacier mass
balance of Norway 1961-2010 calculated by a temperature-index model, Ann. Glaciol., 54, 32–40, 2013.
Giesen, R. H. and Oerlemans, J.: Response of the ice cap Hardan-gerjokulen in southern Norway to the 20th and 21st century cli-mates, Cryosphere, 4, 191–213, 2010.
Hock, R., Radic, V., and De Woul, M.: Climate sensitivity of Stor-glaciaren, Sweden: an intercomparison of mass-balance models using ERA-40 re-analysis and regional climate model data, Ann. Glaciol., 46, 342–348, 2007.
Hurrell, J. W., Kushnir, Y., and Visbeck, M.: The North Atlantic Oscillation, Science, 291, 603–605, 2001.
Huss, M., Hock, R., Bauder, A., and Funk, M.: 100-year mass changes in the Swiss Alps linked to the Atlantic Multidecadal Oscillation, Geophys. Res. Lett., 37, L10501, doi:10.1029/2010GL042616, 2010.
Imhof, P., Nesje, A., and Nussbaumer, S. U.: Climate and glacier fluctuations at Jostedalsbreen and Folgefonna, southwestern Nor-way and in the western Alps from the “Little Ice Age” un-til the present: The influence of the North Atlantic Oscillation, Holocene, 22, 235–247, 2012.
IPCC: Climate Change 2007: The Physical Science Basis Working Group I Contribution to the Fourth Assessment Report of the IPCC, Camb. Univ. Press, available from: http://www.cambridge.org/no/academic/ (last access: 13 Decem-ber 2014), 2007.
IPCC: Climate Change 2013: The Physical Science Ba-sis. Contribution of Working Group I to the Fifth As-sessment Report of the Intergovernmental Panel on Climate Change, Camb. Univ. Press, available from: http://www.cambridge.org/no/academic/subjects/ (last access: 13 December 2014), 2013.
Jacobeit, J., Wanner, H., Luterbacher, J., Beck, C., Philipp, A., and Sturm, K.: Atmospheric circulation variability in the North-Atlantic-European area since the mid-seventeenth century, Clim. Dyn., 20, 341–352, 2003.
Jones, P. D., Jonsson, T., and Wheeler, D.: Extension to the North Atlantic Oscillation using early instrumental pressure observa-tions from Gibraltar and south-west Iceland, Int. J. Climatol., 17, 1433–1450, 1997.
Kjøllmoen, B. (Ed.): Glaciological investigations in Norway 2010, Norwegian Water Resources and Energy Directorate. Rapport, 3.NVE, Oslo, 2011.
Kuettel, M., Luterbacher, J., and Wanner, H.: Multidecadal changes in winter circulation-climate relationship in Europe: frequency variations, within-type modifications, and long-term trends, Clim. Dyn., 36, 957–972, 2011.
Laumann, T. and Nesje, A.: A simple method of simulating the future frontal position of Briksdalsbreen, western Norway, Holocene, 19, 221–228, 2009a.
Laumann, T. and Nesje, A.: The impact of climate change on future frontal variations of Briksdalsbreen, western Norway, J. Glaciol., 55, 789–796, 2009b.
Laumann, T. and Nesje, A.: Sporteggbreen, western Norway, in the past, present and future: Simulations with a two-dimensional dy-namical glacier model, Holocene, 24, 842–852, 2014.
Legendre, P.: lmodel2: Model II Regression, available from: http: //cran.r-project.org/web/packages/lmodel2/index.html (last ac-cess: 13 December 2014), 2014.
Legendre, P. and Legendre, L.: Numerical Ecology, 3rd Edn., Else-vier, Amsterdam, 2012.
Li, J., Sun, C., and Jin, F.-F.: NAO implicated as a predictor of Northern Hemisphere mean temperature multidecadal variabil-ity, Geophys. Res. Lett., 40, 5497–5502, 2013.
Marzeion, B. and Nesje, A.: Spatial patterns of North Atlantic Oscillation influence on mass balance variability of European glaciers, Cryosphere, 6, 661–673, 2012.
Mernild, S. H., Hanna, E., Yde, J. C., Seidenkrantz, M.-S., Wil-son, R. and Knudsen, N. T.: Atmospheric and Oceanic Influ-ence on Mass Balance of Northern North Atlantic Region Land-Terminating Glaciers, Geogr. Ann. Ser.-Phys. Geogr., 96, 561– 577, 2014.
Nesje, A.: Briksdalsbreen in western Norway: AD 1900–2004 frontal fluctuations as a combined effect of variations in win-ter precipitation and summer temperature, Holocene, 15, 1245– 1252, 2005.
Nesje, A.: Latest Pleistocene and Holocene alpine glacier fluctua-tions in Scandinavia, Quat. Sci. Rev., 28, 2119–2136, 2009. Nesje, A., Johannessen, T., and Birks, H.: Briksdalsbreen, Western
Norway – Climatic Effects on the Terminal Response of a Tem-perate Glacier Between Ad 1901 and 1994, Holocene, 5, 343– 347, 1995.
Nesje, A., Lie, O. and Dahl, S. O.: Is the North Atlantic Oscillation reflected in Scandinavian glacier mass balance records?, J. Quat. Sci., 15, 587–601, 2000.
Oerlemans, J.: Climate Sensitivity of Glaciers in Southern Nor-way – Application of an Energy-Balance Model to Nigardsbreen, Hellstugubreen and Alfotbreen, J. Glaciol., 38, 223–232, 1992. Oerlemans, J.: A flowline model for Nigardsbreen, Norway:
projec-tion of future glacier length based on dynamic calibraprojec-tion with the historic record, Ann. Glaciol., 24, 382–9, 1997.
Peings, Y. and Magnusdottir, G.: Forcing of the wintertime atmospheric circulation by the multidecadal fluctuations of the North Atlantic ocean, Environ. Res. Lett., 9, 034018, doi:10.1088/1748-9326/9/3/034018, 2014.
R Core Team: R: A Language and Environment for Statistical Com-puting. R Foundation for Statistical Computing, Vienna, Austria, 2014.
Rasmussen, L. A. and Conway, H.: Influence of upper-air condi-tions on glaciers in Scandinavia, in Annals of Glaciology, Ann. Glaciol., 42, 402–408, 2005.
Rasmussen, L. A., Andreassen, L. M., and Conway, H.: Recon-struction of mass balance of glaciers in southern Norway back to 1948, Ann. Glaciol., 46, 255–60, 2007.
Schlesinger, M. and Ramankutty, N.: An Oscillation in the Global Climate System of Period 65-70 Years, Nature, 367, 723–726, 1994.
Schuler, T. V., Hock, R., Jackson, M., Elvehoy, H., Braun, M., Brown, I., and Hagen, J.-O.: Distributed mass-balance and cli-mate sensitivity modelling of Engabreen, Norway, Ann. Glaciol., 42, 395–401, 2005.
Steiner, D., Pauling, A., Nussbaumer, S. U., Nesje, A., Luterbacher, J., Wanner, H., and Zumbuehl, H. J.: Sensitivity of European glaciers to precipitation and temperature – two case studies, Cli-mate Change, 90, 413–441,2008.
Trenberth, K. E. and Shea, D. J.: Atlantic hurricanes and nat-ural variability in 2005, Geophys. Res. Lett., 33, L12704, doi:10.1029/2006GL026894, 2006.
Wanner, H., Bronnimann, S., Casty, C., Gyalistras, D., Luterbacher, J., Schmutz, C., Stephenson, D. B., and Xoplaki, E.: North At-lantic Oscillation – Concepts and studies, Surv. Geophys., 22, 321–382, 2001.
Wood, S.: mgcv: Mixed GAM Computation Vehicle with GCV/AIC/REML smoothness estimation, available from: http: //cran.r-project.org/web/packages/mgcv/index.html, last access: 13 December 2014.