Atmos. Meas. Tech., 6, 585–598, 2013 www.atmos-meas-tech.net/6/585/2013/ doi:10.5194/amt-6-585-2013
© Author(s) 2013. CC Attribution 3.0 License.
EGU Journal Logos (RGB)
Advances in
Geosciences
Open Access
Natural Hazards
and Earth System
Sciences
Open AccessAnnales
Geophysicae
Open AccessNonlinear Processes
in Geophysics
Open AccessAtmospheric
Chemistry
and Physics
Open AccessAtmospheric
Chemistry
and Physics
Open Access DiscussionsAtmospheric
Measurement
Techniques
Open AccessAtmospheric
Measurement
Techniques
Open Access DiscussionsBiogeosciences
Open Access Open Access
Biogeosciences
DiscussionsClimate
of the Past
Open Access Open Access
Climate
of the Past
Discussions
Earth System
Dynamics
Open Access Open Access
Earth System
Dynamics
DiscussionsGeoscientific
Instrumentation
Methods and
Data Systems
Open Access
Geoscientific
Instrumentation
Methods and
Data Systems
Open Access DiscussionsGeoscientific
Model Development
Open Access Open Access
Geoscientific
Model Development
DiscussionsHydrology and
Earth System
Sciences
Open AccessHydrology and
Earth System
Sciences
Open Access DiscussionsOcean Science
Open Access Open Access
Ocean Science
Discussions
Solid Earth
Open Access Open Access
Solid Earth
Discussions
The Cryosphere
Open Access Open Access
The Cryosphere
DiscussionsNatural Hazards
and Earth System
Sciences
Open Access
Discussions
A new method for nocturnal aerosol measurements
with a lunar photometer prototype
A. Barreto1, E. Cuevas1, B. Damiri2, C. Guirado1,3,4, T. Berkoff5, A. J. Berj´on1, Y. Hern´andez1, F. Almansa1, and M. Gil6
1Iza˜na Atmospheric Research Center, Meteorological State Agency of Spain (AEMET), Iza˜na, Spain 2Cimel Electronique, Paris, France
3Institute of Environmental Assessment and Water Research, Spanish National Research Council (CSIC), Barcelona, Spain 4Atmospheric Optics Group, Valladolid University (GOA-UVA), Valladolid, Spain
5University of Maryland Baltimore County, Baltimore, Maryland, USA
6Instrumentation and Atmospheric Research Department, National Institute for Aerospace Technology (INTA), Madrid, Spain Correspondence to: E. Cuevas (ecuevasa@aemet.es)
Received: 23 July 2012 – Published in Atmos. Meas. Tech. Discuss.: 15 August 2012 Revised: 14 January 2013 – Accepted: 15 January 2013 – Published: 5 March 2013
Abstract. This paper presents the preliminary results of
noc-turnal Aerosol Optical Depth (τa) and Angstr¨om Exponent
(α) obtained from a new lunar photometer prototype, trade name Cimel CE-318U. Due to the variation of the moon’s illumination inherent to the lunar cycle, the typical Langley-plot Method used in solar photometry to calibrate these in-struments cannot be applied. In this paper, we propose three different methods to carry out the lunar-photometer calibra-tion. In order to validate the results, we have selected three events which encompass seven nights and ten days under different atmospheric conditions, including several saharan dust intrusions episodes. Method#1 is introduced in this work as a modification of the usual Langley Method. This tech-nique, called Lunar-Langley Method, requires the extrater-restrial irradiances from a lunar irradiance model, provid-ing similar accuracies onτato those of AERONET (±0.01–
0.02). It makes comparable daytime and nighttime measure-ments. Method#2 consists of transferring the current calibra-tion from a master used by sunphotometers. Its results are again within the limit of accuracy expected for the instru-ment. Method#3 uses an integrating sphere and the method-ology proposed by Li et al. (2008) to determine sky calibra-tion coefficients (Cj) and the instrument’s solid angle field-of-view (), respectively. We observe significantτa differ-ences between Method#1 and #3 (up to 0.07), which might be attributed to the errors propagation in Method#3. The good results obtained from the comparison against a second
CE-318U prototype, and against daytime data from a Precision Filter Radiometer (PFR), constitute a valuable assessment of CE-318U performance. Results ofαand its spectral variation (δα) show good agreement between daytime and nighttime, being able to identify the aerosol properties associated with each event.
1 Introduction
Atmospheric aerosols are known to impact the climate evo-lution, but they still represent one of the largest uncertainties in climate change studies (IPCC, 2007). The high uncertainty associated with the role played by aerosols in radiative forc-ing on a global scale makes it necessary to obtain a global ground-based aerosol climatology. In this sense, the Aerosol Robotic Network (AERONET) is nowadays one of the most powerful worldwide tool (Holben et al., 1998). Aerosol Opti-cal Depth (τa) at a certain wavelength is the standard param-eter measured by sunphotomparam-eters such as those operating in AERONET. Spectral dependence ofτa is mainly driven by
aerosols products and to regional and global aerosol/dust models. However, the lack of nighttime aerosol observations introduces some uncertainties in column aerosol estimations. Nighttimeτa is a necessary parameter to derive a
continu-ous sequence of total column aerosol information which is of considerable importance for monitoring aerosol transport, for high latitude locations, given the extended periods of dark-ness during winter, to study the effect of aerosol particles on cloud lifetime and coverage during the night, and for detect-ing massive aerosol outbreaks at night (Zhang et al., 2008).
Ground or spaceborne lidar observations have the capa-bility of detecting atmospheric column aerosols at night. However, its spatial coverage is limited and the τa obser-vations can no longer constrain the extinction solution from the backscattering observations (Zhang et al., 2008). Passive sensors forτa measurements at night must solve the prob-lem of the low incoming energy from the nocturnal celestial bodies, which emit in a range of 10−5–10−6 the sun’s en-ergy in the case of the moon, and five orders of magnitude less for the brightest star in the sky, Sirius. On one hand, stellar photometers are proven to be more effective in de-terminingτaat nighttime than lunar photometers. However,
the complexity of the large-aperture instrumentation needed to capture the low levels of incoming energy from the stars limits the use of stellar photometers and their implemen-tation in standardised regional or global networks. On the other hand, the relatively high irradiance from the moon pro-vides the possibility of using common-aperture photometers to retrieve aerosol properties at night. Nevertheless the moon can be considered a solar diffuser with an exceptional sta-bility, although the apparent brightness of this celestial body changes continuously with the lunar viewing geometry, such as the lunar phase or the libration angles, and due to the non-lambertian reflectance properties of its surface. As Her-ber et al. (2002) suggested, the nocturnal calibration in lu-nar photometry is an important obstacle to overcome, be-cause it is not stable for longer than 1 day and, therefore, the typical Langley procedure must be used for every noc-turnal measurement. This problem was tackled by Berkoff et al. (2011) by considering a lunar irradiance model which explicitly accounts for the effects of phase, the spatial var-iegation of the lunar surface, the changes in the hemisphere of the moon presented to an observer (the lunar librations) and the strong backscatter enhancement at low phase angles (the so-called “opposition effect”) (Kieffer and Stone, 2005). This empirical model, known as ROLO (RObotic Lunar Ob-servatory), was developed at the United States Geological Survey (USGS) as a NASA-funded project in support of the Earth Observing System (EOS) programme. ROLO enables using the moon as a radiometric calibration source for on-orbit calibration of Earth observing satellites by means of a lunar spectral irradiance model that was developed from ex-tensive telescopic observations acquired over more than 8 yr (Kieffer and Stone, 2005). Kieffer and Stone (2005) found band-average residuals less than 1 % by fitting thousands of
ROLO observations at wavelengths from 350 to 2450 nm. Consequently, the model provides the exo-atmospheric lu-nar spectral irradiance with high precision for any given lo-cation and time within the model’s valid geometric range of phase angles±90 degrees. Berkoff et al. (2011) combined this information with nocturnal photometric measurements using a classical Cimel CE-318 sunphotometer to obtain at-mospheric columnar multi-wavelengthτavalues. They
stud-ied this magnitude for two different atmospheric conditions near full-moon, and used a sunphotometer that was limited by a non-ideal laboratory based calibration. However, their results showed relatively low differences between observed
τavalues and those retrieved by close-in-time AERONET ob-servations in the case of low and stableτaconditions. For the high and non-stableτaperiod, this study showed higher un-certainties inτa, especially in shorter-wavelength bands, re-sulting from the dark noise limit of the post-photodiode elec-tronics. Moreover, these authors proposed the improvement of the photo detector signal-to-noise ratio in order to use this type of photometers during the bright half of lunar phase and over much wider range of wavelengths and conditions. Con-cerning problems derived from calibration uncertainties, they can be partially fixed with a mountain-top Langley calibra-tion or collocating stellar reference measurements.
Another problem presented in lunar photometry is the re-duced observational frequency compared to sun-photometry. In case of having a sufficiently precise instrument capable of measuring under moon fraction of illumination ≥40 % conditions, we could obtain a nocturnal useful observational percentage <60 % in a moon cycle. However, and due to the phase lag between lunar and solar cycles, only a fraction of each night will be useful in practice for moon measure-ments, except for full moon events, when lunar observations can cover the entire night.
In this study, we have used two prototypes of a new in-strument developed by Cimel Electronique for lunar pho-tometry, trade name CE-318U photometer, specifically de-signed to track the moon and to perform automatic lunar ir-radiance measurements. These instruments were installed at the high mountain Iza˜na Observatory (2400 m a.s.l.) in order to characterise their performance, to obtain absolute calibra-tions and to develop a reliable and trustable validation against reference instruments. We examinedτa andαretrievals un-der very different nocturnal atmospheric conditions, includ-ing saharan dust intrusions with highτa, during a relatively long period, and compared them with daytime observations. This paper starts with a brief description of the experimen-tal site and its facilities (Sect. 2). In Sect. 3, the CE-318U instrument is briefly described as well as the main spectral and temporal characteristics of the lunar measurements. In Sect. 4, we detail the methodology to obtainτaandα, which
requires an ad-hoc calibration procedure in case of lunar ob-servations. Three methods have been used to assess the in-strument calibration: the Lunar-Langley Method, the cali-bration transference from a master, and the calicali-bration using
an integrating sphere, which are presented in Sect. 5. The main results of this study are summarised in Sect. 6, where we analyse and compare lunar τa obtained by means the Lunar-Langley and our ROLO model implementation, show-ing some case analysis. We also comparedτaandαobtained
during night period with daytimeτaandα. Finally, the main
conclusions of this work are presented in Sect. 7.
2 Site information
The high mountain Iza˜na Observatory, managed by the Iza˜na Atmospheric Research Centre (IARC), from the State Mete-orological Agency of Spain (AEMET) is located in Tenerife (Canary Islands, Spain; 28◦180N, 16◦290W, 2363 m a.s.l.). This observatory is most of the time representative of free troposphere conditions, mainly in the night period where a downward catabatic regime is well established, providing ex-cellent conditions for accurate measurements of trace gases. A strong temperature inversion layer normally located be-tween 800 and 1500 m a.s.l., below the Iza˜na level, prevents the arrival of local or regional pollution from lower levels at the Observatory. This Observatory is part of the World Mete-orological Organization (WMO) Global Atmospheric Watch Programme (GAW) and part of the Network for the Detec-tion of Atmospheric ComposiDetec-tion Change (NDACC). Fur-thermore, Iza˜na is a suitable place for sky observations due to a high atmospheric stability, high frequency of pristine days, a low and stable total column ozone and a very dry atmosphere. Several radiometric techniques, such as FTIR (Fourier Transform Infrared spectrometry), UV (i.e., Brewer spectrophotometers), DOAS (Differential Optical Absorp-tion Spectroscopy) and Lidar have been used for a long time. For our purposes it is worthy to highlight that Iza˜na Observatory is a direct-sun calibration site of AERONET (http://aeronet.gsfc.nasa.gov) and for its associated networks PHOTONS (PHOtometrie pour le Traitement Operationnel de Normalisation Satellitaire; http://loaphotons.univ-lille1. fr/photons/) and RIMA (Red Ib´erica de Medida fotom´etrica de Aerosoles; http://www.rima.uva.es). In fact, PHOTONS, RIMA and IARC forms the present AERONET-Europe cal-ibration infrastructure within the European project ACTRIS (Aerosols, Clouds and Trace gases Research InfraStructure Network; http://www.actris.net), and Iza˜na Observatory is the site where master sunphotometers of AERONET-Europe are sun-calibrated. Iza˜na Observatory is part of the GAW Precision Filter Radiometer (PFR) network, managed by the World Radiation Centre (Davos; Switzerland), whose mis-sion is to obtain high accuracy long-term τa andα series.
Finally, Iza˜na Observatory hosts the reference triad of the WMO-GAW Regional Brewer Calibration Centre for Europe (RBCC-E) (http://www.rbcc-e.org).
3 Instrumentation
3.1 The new Lunar Cimel CE-318U
The new lunar Cimel CE-318U photometer is, in essence, a similar instrument to the classical sunphotometer Cimel CE-318, extensively described in Holben et al. (1998), but with new improvements and features introduced to allow the re-trieval of the reduced incoming energy from the moon. This new instrument performs nocturnal measurements with max-imum gain and an approximate field of view of 1.29◦at eight nominal wavelengths of 1640, 1020, 938, 937, 870, 675, 500 and 440 nm. 380 nm and 340 nm channels were not included due to the low incoming energy received from the moon in this spectral range. A sequence of three measurements is taken every 30 s at each wavelength. These triplets allow us to detect and screen clouds in the same way that they are used in sun-photometry (Smirnov et al., 2000). A new moon tracker has been built in the system. It is based in a four-quadrant detector with new electronics to amplify the signal, incorporating a new software to process data while tracking. This new tracker is also able to track the sun with a special device containing an attenuation filter to reduce the high in-coming energy.
CE-318U combines the features of the standard Cimel sun-photometers with a rather good signal-to-noise ratio (bet-ter than 60 dB). We have estimated the instrument’s preci-sion by means of triplets stability calculation for both di-urnal and noctdi-urnal measurements, following Holben et al. (1998). This magnitude accounts for both electronic and in-strumental errors. As in sun photometry, each triplet value is defined as the maximum minus minimum raw data divided by the mean value of the three consecutive measurements taken every 30 s. Results are presented in Table 1. Triplets values are wavelength dependent and, in case of nocturnal measurements, they are also dependent on the moon’s phase. They are appreciably lower for direct-sun measurements, es-pecially in shorter wavelength channels, where the variabil-ity in triplets is the highest. This implies that daytime mea-surements are more stable than nocturnal ones, although the stability in daytime and near full moon observations is quite similar.
We have used two prototypes of the new CE-318U since July 2011. The most stable was considered as the master instrument, hereinafter referred to as CE-1, and the second prototype as the secondary instrument, hereinafter referred to as CE-2.
In this study, we have included three different case studies. The first one involves a period of five consecutive nights in August (from 9 to 14) 2011, affected by different dust instru-sions. The second one is a relatively lowτacase study during
Table 1. CE-318U triplets in % obtained for two nights with different moon’s fraction of illumination (FI) and for daytime measurements.
Channels (nm)
Type of measurements 1020 1640 870 675 440 500
13 December 2011 Nocturnal (FI = 87 %) 0.36 0.18 0.23 0.26 0.61 0.52 9 February 2012 Nocturnal (FI = 93 %) 0.28 0.13 0.18 0.19 0.30 0.25
22 December 2011 Daytime 0.09 0.11 0.09 0.13 0.15 0.22
3.2 The integrating sphere for radiances calibration
A calibration system developed for the instruments per-forming sky radiance measurements within the AERONET-PHOTONS-RIMA networks has been implemented at the Iza˜na Observatory. In such systems, the light source comes from an integrating sphere providing a homogeneous visual field. The recalibration of the sphere is accomplished three times a year by comparison to the travel NASA master Cimel sunphotometer (Guirado et al., 2012). Following Walker et al. (1991), the sphere’s accuracy is assumed≤5 %.
3.3 ROLO model
In this paper, we have used the model presented in Kieffer and Stone (2005) to calculate the lunar irradiance (ROLO model) using our own astronomical calculations. ROLO Project was established to characterise the brightness of the moon with the aim of addressing the critical calibration prob-lems of the Earth remote-sensing imaging sensors (Kief-fer and Stone, 2005). This programme was developed at the USGS Flagstaff Science Centre in Arizona as a NASA-funded project. The basis of this programme is the automated ground-based observations over multiple years to capture the cyclic brightness variation of the moon. The observatory was in operation for more than 8 yr, observing every clear night at lunar phases within±90◦. Over 85 000 lunar images were acquired in 32 wavelengths from 350 to 2450 nm. These im-ages form the basis data for the model, as spatially integrated lunar irradiance measurements. The ROLO model uses an empirically derived analytic equation to predict the lunar disk-equivalent reflectance (Aj) in the spectral bandj using only geometric variables (Kieffer and Stone, 2005),
ln(Aj)= 3
X
n=1
ai,jgi+ 3
X
n=1
bn,jϕ2n−1+c1·θ+c2·φ
+c3·ϕ·θ+c4·ϕ·φ+d1,j
·e
−g
p1 +d2,j·e −g
p2 +d3,j·cos(g−p3
p4 ) (1)
wheregis the absolute phase angle,θandφare the seleno-graphic latitude and longitude of the observer, respectively, andϕis the selenographic longitude of the sun.
Kieffer and Stone (2005) found band-average absolute residuals about 1 % by comparison between ROLO empir-ical irradiances and hundreds of ROLO observations.
Con-sequently, ROLO provides the exo-atmospheric lunar irra-diance with a relatively high precision over the full range of the geometric variables and wavelengths at a specific lo-cation and time. Since our modelled irradiances were com-puted using a different astronomical ephemeris calculator and taking into account that ROLO providesI0modelled
val-ues for 32 specific spectral responses, a lower level of accu-racy in our ROLO-implemented model is expected. In this study, we have used the Alcyone ephemeris 4.3, based on the Moshier’s ephemeris and the celestial mechanics equations from Meeus (1991), both adjusted to the Jet Propulsion Lab-oratory’s DE404 results. It has an expected precision within 0.500 in moon’s longitude, 0.3300 in latitude and 0.36 km in distance.
3.4 Ancillary information for data validation
τa and α version 2 level 1.5 data obtained with the Iza˜na AERONET master #244 (http://aeronet.gsfc.nasa.gov), near sunset and near sunrise, are used to compare withτa andα
determined with CE-1 and CE-2 at moonrise and moonset, respectively. Following Eck et al. (1999), the expected total uncertainty inτa for field AERONET Cimel instruments is 0.010–0.021, and 0.002–0.009 for master instruments.
A 4-wavelength GAW PFR developed by the World Op-tical Depth Research and Calibration Centre (WORCC) of the PMOD World Radiation Centre (http://www.pmodwrc. ch/worcc/index.html) is in operation at Iza˜na since July 2001. PFR near sunset and near sunrise τa at 412.1, 501.0, and
863.1 nm, as well as α, were used as an additional refer-ence to validate the CE1 and CE-2 data. Lowτadifferences between PFR and AERONET Cimel, in case of instanta-neous measurements, have been reported by Nyeki et al. (2012) (0.0024 measured at Davos). Mean bias differences of 0.002 and 0.003 between PFR and AERONET Cimel were recorded at Iza˜na during 2011 (Christoph Wehrli, personal communication, 2012).
A Micropulse Lidar (MPL), MPL-3 (SES Inc., USA) sys-tem (Spinhirne et al., 1995) has been running at Santa Cruz de Tenerife station (28.5◦N, 16.2◦W; 52 m a.s.l.) since Jan-uary 2005. This program has been implemented for mon-itoring and characterization of Saharan Air Layer (SAL) North Atlantic outflow, and it is currently in operation within NASA/MPLNET (hhtp://mplnet.gsfc.nasa.gov), and is co-managed by National Institute for Aerospace Technology
(INTA; Spain) and the Iza˜na Atmospheric Research Cen-tre (IARC; AEMET). MPL is a robust system with high-pulse frequency (2500 Hz) and low-energy (7–10 µJ, maxi-mal) “eye-safe” Nd:YLF laser at 523 nm operational in full-time continuous mode (24 h a day/365 days a year). Lidar backscattered signal is registered in 1-min integrated time and with a vertical resolution of 75 m. Details of the MPL and the on-site maintenance and calibration techniques are described by Campbell et al. (2002). It is used to track the SAL dust layering structure evolution from day to day, and be compared qualitatively withτa evolution obtained with AERONET and lunar photometers. In this study, we have processed lidar data and obtained backscatter cross sections. FLEXible backward TRAjectories (FLEXTRA) plots from the EMPA facility for Global GAW stations have been used to confirm the pathways of air masses arriving to Iza˜na at several levels (Stohl et al., 1995; Stohl and Seibert, 1998). The calculations are based on the FLEXTRA model and driven by ECMWF wind fields with a global resolution of 1◦×1◦. FLEXTRA trajectory images are available at http: //lagrange.empa.ch/.
4 Methodology
4.1 Aerosol Optical Depth determination – The Lunar-Langley Method
Attenuation of moon’s irradiance in an atmospheric window, as occurs during daytime, can be described by the Beer-Lambert-Bouguer Law:
Vλ=V0,λ·exp(−m(θ )·τλ) (2)
whereVλis the output voltage,V0,λrepresents the
extrater-restrial voltage, which includes all temporal variations (lunar phase as well as earth-moon and moon-sun distances),mis the relative optical mass, function of the moon’s zenith angle
θ, andτλis the spectral optical depth. For the air mass and the spectral optical depth calculation we have followed the spec-ifications corresponding to AERONET version 2. Moon’s zenith angle (θ) has been obtained using the ephemeris Alcy-one 4.3. Taking logarithms on both sides of Eq. (2) we have, ln(Vλ)=ln(V0,λ)−m(θ )·τλ (3)
To account for the change in moon’s illumination during the course of the night as well as the distance effect on lunar irradiance, we have introduced in Eq. (2) these the two con-tributions on theV0term. Thus,
V0,j=I0,j·κj (4)
whereI0,j is the extraterrestrial irradiance in a certain
chan-nel with a central wavelength at j, and κj is a constant
that depends on the instrument features (calibration coeffi-cients,Cj, and the instrument solid angle field-of-view,).
I0,j is calculated using the ROLO lunar disk-equivalent re-flectances (Aj) in Eq. (1). It takes into account lunar phase as well as sun-moon distance. In this work, the sun-moon distance as well as the selenographic latitude and longitude of the observer and the sun are computed using the astro-nomical calculator previously described. Lunar reflectances are converted to modelled irradiances using the following expression,
Ij=
Aj·M·Ej
π (5)
In this equationMis the moon’s solid angle, dependent on
the moon-earth distance andEj is the solar spectral
irradi-ance for the bandj. Following Kieffer and Stone (2005), to obtain the last term the irradiance model of Wehrli (1986) has been assumed,
Ej=
Rλ2
λ1 Es(λ)·R(λ)dλ Rλ2
λ1 R(λ)dλ
(6) where Es (λ) is the sun’s spectral irradiance at 1 AU and
R(λ)is the filter response function for each spectral band of CE-318U. RegardingM, it is obtained using the topocentric apparent diameter of the moon (dapp), function of earth-moon distance,
M=π·(sindapp 2 )
2 (7)
With all these inputs on the Eqs. (1) and (5) moon’s irradiance was calculated coincidentally with each CE-318U measurement.
The calibration methodology for nocturnal photometry proposed here for nighttime measurements is called Lunar-Langley Method. It uses Eqs. (3) and (4) and a least squares fitting to obtain the instrument’s calibration constant (κj)
as the intercept of the fitting line. In this caseκj constants
strictly accounts for the instrument’s photometric respon-sivity and any residual systematic offset difference between ROLO predictedI0,j and the actual exoatmospheric irradi-ance. Thus, it must be ideally computed as an average of some Lunar-Langley’s obtained in a mountain-top station under suitable atmospheric conditions.
As in daytime period, a good Lunar-Langley calibration requires clean, cloud-free and stable atmospheric conditions. For this reason it is commonly applied in sun-photometry over a range of air masses between 2 and 5 during sunrise or sunset. In this study, we have used the Lunar-Langley methodology to obtain the calibration constants κj’s under
stable and clear atmospheric measurements, over a range of air masses between 2 and 5 (during the moonrise or the moonset).
Once κj’s are known by means of the Lunar-Langley
Method, it is possible to determine instantaneousτafrom an individual measurement:
τa,j=
ln(κj)−ln( Vj
I0,j)−matm(θ )·τatm,j
Table 2. CE-1 solid angle (in steradians) determined with daytime measurements.
Channel (nm) 1020 1640 870 675 500 440
j 3.92×10⁻⁴ 3.95×10⁻⁴ 3.93×10⁻⁴ 3.88×10⁻⁴ 3.82×10⁻⁴ 3.78×10⁻⁴
The subscript “atm” accounts for air mass and optical depth of each atmospheric attenuator with the exception of aerosols.
4.2 Angstr¨om’s exponent (α) determination
The Angstr¨om’s exponent (α) is a measure of the wavelength dependence of theτa(Angstr¨om, 1929).αis a qualitative
in-dicator of aerosol particle size (Kaufman et al., 1994), as it is inversely related to the particle size (Kim et al., 2011). Thus, the combinedα-τainformation is useful to discriminate dif-ferent atmospheric aerosol types.
To obtain this parameter we have retrievedτa within the spectral range between 870 nm and 440 nm. Taking the slope of the linear fit to the logarithm ofλjvs. logarithm ofτa(λj)
(j= 870, 675, 500 and 440 nm channels), we can obtain α
using the following equation:
ln(τa(λj))=ln(β)−α·ln(λj) (9)
Another important parameter is the spectral variation ofα
(δα). It reports additional information about the aerosol size distribution, and it is expressed as,
δα=α(440,675)−α(675,870) (10) Positive values ofδαindicate the coexistence of two sepa-rate particle modes. Eck et al. (1999), with a case analysis in the Gobi desert, and Basart et al. (2009) with a climatology from 32 AERONET stations in Northern Africa and Middle East, demonstrated that relatively small negative values ofδα
indicate the presence of pure desert mineral dust.
4.3 Instrument solid angle field-of-view determination
The solid angle field-of-view (solid angle FOV or) of a photometer is normally provided by the manufacturer. How-ever, in this work we have calculated it following the method-ology proposed by Li et al. (2008). It computesfrom day-time measurements using the aureole calibration coefficients (Ca) and instrument user and internal gains, instead of com-puting them by means of the classical laboratory method. TheCa coefficients are obtained by means of a calibration using an integrating sphere. These authors obtained from er-ror propagation expected uncertainties between 3 % and 5 %. They propose the following definition for:
=g·
LG HGa
=( E0 V0,s·Ca)·
LG HGa
(11) wheregis the solid angle gain corrected, LG and HGaare
the direct and aureole instrument internal electronic gains,
respectively,E0is the extraterrestrial solar irradiance,V0,sis
the solar extraterrestrial constant andCaare the aureole
radi-ance calibration coefficients, obtained using the integrating-sphere calibration technique.
Results ofj are shown in Table 2, showing a spectral
dependence on this magnitude. This slight wavelength de-pendence was also found by Li et al. (2008), although they propose to average the spectralj over all wavelengths to
derive a constant value.
5 Calibration strategy
As for sunphotometers, lunar-photometers need a calibration procedure in order to obtain τa andα, and to assess their reliability and intercomparability. Sunphotometer’s calibra-tion usually needs the estimacalibra-tion of the voltage measured by the instrument in absence of atmosphere by extrapolation of the voltage curve in Eq. (2) to zero air mass conditions. This calibration procedure is known as Langley-plot method. It uses the sun or, as in this case, the moon as a reference light source. However, this methodology must be re-formulated to account for the moon’s irradiance variation inherent to the lunar cycle.
In this paper, we present the calibration strategy for the lunar CE-318U instrument, which can be approached by three different methods, depending on available calibration facilities.
5.1 Method#1: Lunar-Langley calibration
The first method implies the determination of the calibra-tion constantsκjby means of the Lunar-Langley Method
ex-pressed by using the Eqs. (3) and (4). This Method requires the knowledge of the moon’s extraterrestrial irradiance at any time of measurement. Once raw data andI0’s are ratioed, the calibration constantsκj can be determined as the intercept of the least squares fitting in Eq. (3).
We have performed this calibration technique for both CE-1 and CE-2 using the lunar data obtained on 8–9 Febru-ary 2012. This night was selected due to the relatively low and constantτaconditions, especially during moonset, where τa at 440 nm remained stable and near 0.02. For CE-1, this
calibration was applied in other two time periods to check the stability of the calibration. In Fig. 1 the Lunar-Langley analysis performed for CE-1 is shown. High correlation co-efficients of the linear regression analysis (R≥0.99) were found for all channels except for 1020 nm channel (R= 0.79), showing the reliability of the calibration procedure. The
Fig. 1. Lunar Langley-plot analysis performed on the moonset of 9 February for CE-1.
considerable deviations in 1020 nm channel can be attribute to the temperature dependence effect on this spectral range.
5.2 Method#2: calibration transference from a master
The previous calibration method is very accurate, if suitable atmospheric conditions exist. For this reason, it can only be applied in mountain-top sites where very low and stableτa
exists, as well as low humidity nighttime conditions can be attained. Only a few sites can meet these requirements, so an alternative calibration method is needed. The second pro-posed method is that followed by classical sunphotometers by means of intercomparisons. It is based on the calibration transference from a master instrument (Holben et al., 1998; Toledano et al., 2011), in turn calibrated at a high mountain site. This transference technique is possible taking into ac-count the average ratio in digital ac-counts between coincident measurements from two lunar photometers. Being (DCM)
and (DCi) the average coincident raw data for the master and
the instrumentito be calibrated, respectively, we can obtain the calibration constantV0,iusing the known valueV0,M
ob-tained from a master, with the following expression:
V0,i=V0,M·
DCi
DCM
(12)
5.3 Method#3: calibration using an integrating sphere
A third method to calibrate a lunar photometer is based on the use of an integrating sphere to determine the sky calibra-tion coefficientsCj, as Berkoff et al. (2011) followed, and the laboratory procedure developed by Li et al. (2008) to cal-culatej. The instrument calibration constants κj can be determined as follows,
κj=
1
Cj·j (13)
From Eqs. (4) and (13) we can determine experimentally the calibration constants for our instrument (κj’s) deriving Cj
andj. Then, it could be possible to convert at any time ROLO exo-atmospheric irradiances into the instrumentV0,j
parameter.V0,j inferred using this method has an accuracy strongly limited by the uncertainties involved in the determi-nation ofCj andj, as well as those involved in the ROLO
model.
In this study, we have used an integrating sphere calibra-tion system implemented for PHOTONS-RIMA calibracalibra-tion at IARC. The main features of the integrating-sphere were described in Sect. 3.2.
6 Results
6.1 Method#1
The calibration constants κj’s were calculated using this Lunar-Langley calibration for the two CE-318U prototypes using nocturnal measurements on the moonset of 9 Febru-ary 2012, for CE-1, and the moonrise for CE-2, as no data was available for CE-2 during the moonset. This was the most pristine and stable event to perform an accurate Lan-gley calibration. The coefficients of the two instruments are shown in Table 3.
Using calibration constants from this table, nocturnalτa
for CE-1 have been calculated for 9–10, 10–11, 11–12, 12– 13 and 13–14 August 2011 and for two episodes more on 11– 12 October 2011, and 8–9 February 2012, with low and sta-ble aerosol conditions. The first five nights period in August involved a moon’ s illumination change from 84 % to 100 %. During October event, moon’s illumination was ∼100 % (full moon), meanwhile during 8–9 February 2012, the illu-mination was within the 99 %–98 % range. In Figs. 2, 3 and 4 the daytime and nocturnalτa evolution is presented for a
sequence of six days and five nights of measurements in Au-gust and the nights in October and February. Lidar backscat-ter vertical cross-section is shown in addition to theτacourse
for each episode in order to have independent qualitative in-formation about the vertical structure and variability of the aerosols. For a quantitative analysis of daytime and noctur-nalτa differences, it is necessary to establish a criterion of
“quasi-simultaneity”. In this study, we have compared noc-turnal and daytime data corresponding to the consecutive 1-h time period during sunset-moonrise (SS-MR) and moonset-sunrise (MS-SR): the first hour of the moonrise against the last hour of previous daytime data during sunset, as well as the last hour of the moonset against the first hour of subse-quent daytimeτaduring sunrise. These results are shown in Table 4.
6.1.1 Highτaconditions: saharan dust events
We used the information from FLEXTRA backward trajec-tories in order to infer dust source regions in the high τa
Table 3. κjcalibration constants extracted for each channel (in nm) for CE-1 andκ0constants for CE-2, both obtained on 9 February 2012
(W−1m2nm DC).
Channel (nm) 1020 1640 870 675 500 440
CE-1κj mean 2.15×10⁹ 1.28×10¹⁰ 3.02×10⁹ 2.29×10⁹ 1.74×10⁹ 1.41×10⁹
CE-2κj’ mean 2.01×10⁹ 1.15×10¹⁰ 2.74×10⁹ 2.10×10⁹ 1.64×10⁹ 1.33×10⁹
Table 4. τaaveraged differences between daytime AERONET and CE-1 data during sunset-moonrise (SS-MR, as the last 1-h of daytime
AERONET data versus the first 1-h of nocturnal CE-1 data) and moonset-sunrise (MS-SR, as the first 1-h of daytime AERONET data versus the last 1-h of nocturnal CE-1 data).
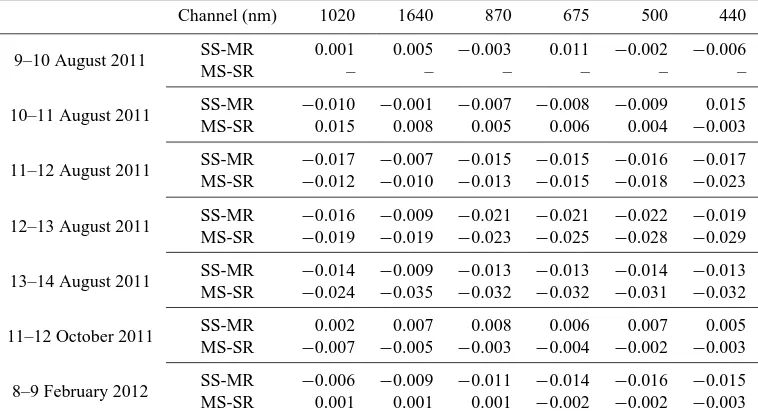
Channel (nm) 1020 1640 870 675 500 440
9–10 August 2011 SS-MR 0.001 0.005 −0.003 0.011 −0.002 −0.006
MS-SR – – – – – –
10–11 August 2011 SS-MR −0.010 −0.001 −0.007 −0.008 −0.009 0.015
MS-SR 0.015 0.008 0.005 0.006 0.004 −0.003
11–12 August 2011 SS-MR −0.017 −0.007 −0.015 −0.015 −0.016 −0.017 MS-SR −0.012 −0.010 −0.013 −0.015 −0.018 −0.023
12–13 August 2011 SS-MR −0.016 −0.009 −0.021 −0.021 −0.022 −0.019 MS-SR −0.019 −0.019 −0.023 −0.025 −0.028 −0.029
13–14 August 2011 SS-MR −0.014 −0.009 −0.013 −0.013 −0.014 −0.013 MS-SR −0.024 −0.035 −0.032 −0.032 −0.031 −0.032
11–12 October 2011 SS-MR 0.002 0.007 0.008 0.006 0.007 0.005
MS-SR −0.007 −0.005 −0.003 −0.004 −0.002 −0.003
8–9 February 2012 SS-MR −0.006 −0.009 −0.011 −0.014 −0.016 −0.015 MS-SR 0.001 0.001 Discussion0.001 −0.002 −0.002 −0.003
P
ap
er
|
Discussion
P
ap
er
|
Discussion
P
ap
er
|
Di
scuss
ion
P
ap
er
|
Fig. 2.τaevolution during six days and five nights on August 2011, using AERONET data for daytime
and lunar CE-1 data for nocturnal period. MPL corrected backscatter cross-sections obtained at Santa Cruz station from the Iza˜na Observatory level in upper panel.
34
Fig. 2.τaevolution during six days and five nights on August 2011,
using AERONET data for daytime and lunar CE-1 data for noc-turnal period. MPL corrected backscatter cross-sections obtained at Santa Cruz station from the Iza˜na Observatory level in upper panel.
Discussion
P
ap
er
|
Discussion
P
ap
er
|
Discussion
P
ap
er
|
Di
scuss
ion
P
ap
er
|
Fig. 3.CE-1τaon 11 and 12 October 2011, with MPL corrected backscatter cross-sections for the same period from the Iza˜na Observatory level (upper panel).
35
Fig. 3. CE-1τaon 11 and 12 October 2011, with MPL corrected
backscatter cross-sections for the same period from the Iza˜na Ob-servatory level (upper panel).
A. Barreto et al.: A new method for nocturnal aerosol measurements 593
above Iza˜na Observatory up to 5500 m a.s.l. from 9 to 14 Au-gust (not shown here for the sake of brevity). These saharan dust intrusions during 9 and 10 August are clearly seen in Fig. 2. The first event is detected by the MPL with a max-imum backscatter signal between 2.3 and 4 km height from 9 August to 10 August midday. After this time the signal de-creases sharply, with minimum values at night. During this period some high clouds are detected by MPL at a height above 8 km and, thus,τacan be affected. Differences during
moonrise and sunset on 9 August are below 0.01 (Table 4), whithin theτaaccuracy limit established in AERONET (Hol-ben et al., 1998). Nocturnal data was not available to per-form moonset and sunrise comparison on 10 August. In the same day, these differences reached 0.02 in 440 nm during the moonrise, meanwhile they were reduced to values be-low 0.01 in the next moonset-sunrise period, when another intrusion started on 11 August. From 05:00 to 23:00 UTC, approximately, and after this period the backscatter signal decreased slowly. This change in aerosol concentration was well captured by CE-1, with aτadecreasing from values up
to 0.20 in 440 nm during the early night to lower than 0.10 in 440 nm, and near constant values during the latest part of this night. From Table 4 we can see that sunset-moonrise and moonset-sunriseτa differences are similar, below 0.02
for all channels. We had a third intrusion in this period, on 13 August. In this case, the aerosol layer extended up to 5 km altitude, starting at about 22:00 UTC. The dust layer is perfectly captured by the lidar profile and compares quite well to the aerosol optical depth curves obtained with CE-1. Nocturnalτa differences during the 12–13 August reached 0.02 for sunset-moonrise and 0.03 for moonset-sunrise in shorter wavelength channels. During the moonset and sun-rise of 14 August differences grew to 0.04, due to the sharp
τaincrease. Meanwhile, in the sunset-moonrise of 13 August,
just when this intrusion starts,τadifferences are about 0.01.
Although most of the differences found were higher than the AERONET accuracy limit forτa, they are explained by the
high aerosol variability.
Additional information can be extracted from Table 4. Similarτa differences during two stable nights with
differ-ent moon’s illumination, 9–10 August (with a mean lunar il-lumination of 84.7 %) and 11–12 October (near full moon, 99.8 %), were found and, thus, we can assume that τa ac-curacy is not affected by a change in∼15 % in fraction of illumination.
6.1.2 Lowτaconditions
In order to test the performance of this new instrument over low and stable aerosol concentrations, we have included two additional events. The first clean event showed aτarelatively
constant (around 0.07 at 440 nm) test case during two con-secutive days (11 and 12 October 2011), shown in Fig. 3. This figure demonstrates a good agreement between ver-tical aerosol backscatter evolution and τa, as well as
be-P
ap
er
|
Discussion
P
ap
er
|
Discussion
P
ap
er
|
Di
scuss
ion
P
ap
er
|
Fig. 4.CE-1τaon 8 and 9 February 2012, with MPL corrected backscatter cross-sections from the Iza˜na Observatory level.
36
Fig. 4. CE-1τa on 8 and 9 February 2012, with MPL corrected
backscatter cross-sections from the Iza˜na Observatory level.
tween AERONET and CE-1τavalues. In Table 4,τa differ-ences are≤0.01 during both sunset-moonrise and moonset-sunrise. Although the increment in aerosol concentration dur-ing nighttime is well captured by CE-1, it can be seen from Fig. 3 a probable calibration problem affecting the 1640 nm and 1020 nm channels between moonrise and moonset. We attribute discrepancies in 1020 nm to temperature correction. However, discrepancies in 1640 nm do not seem to be related to a general problem in longer wavelengths, but in particular uncertainties associated to astronomical parameters determi-nation for a particular night.
The second clean event was on 8–9 February 2012 (Fig. 4). This is a very clear night (τaat 440 between 0.02 and 0.04)
with a relatively stable aerosol concentration during the en-tire night, especially over the moonset period. On 9 February a Lunar-Langley was performed. In this case, as expected, moonset data matches pretty well AERONET sunrise data. Differences are slightly greater during moonrise but within the AERONETτaaccuracy limit.
τa validation has been completed with daytime τa from PFR for 11 and 12 October 2011, and 8 and 9 February 2012. We should note that PFR has only three channels centred at 863.1, 501 and 412.1 nm. Therefore, the comparison study can only be computed for the CE-1 near coincident channels. Due to the different central wavelength between the two in-struments near 440 nm, we have derived the PFRτaat 440 nm
Table 5. τaaveraged differences on 11 to 12 October 2011, and 8 to 9 February 2012, between daytime PFR and nocturnal CE-1 data during
sunset-moonrise (SS-MR, the last 1-h of daytime PFR data versus the first 1-h of nocturnal CE-1 data) and moonset-sunrise (MS-SR, as the first 1-h of daytime PFR data versus the last 1-h of nocturnal CE-1 data).τadifferences between PFR and AERONET during moonrise and
moonset have been included.
PFR Channel (nm) 412.1 501 863.1
PFR/CE-1
Oct. SS-MR 0.011 0.010 0.012
October MS-SR 0.011 0.010 0.009 February SS-MR −0.008 −0.009 −0.008 February MS-SR 0.004 0.004 0.001
PFR/AERONET
Oct. SS-MR −0.005 −0.006 −0.004 October MS-SR −0.012 −0.013 −0.012 February SS-MR −0.004 −0.004 −0.001 February MS-SR −0.005 −0.006 0.001
Discussion
P
ap
er
|
Discussion
P
ap
er
|
Discussion
P
ap
er
|
Di
scuss
ion
P
ap
er
|
Fig. 5.τascatter-plot obtained for CE-1 (master) and CE-2 (secondary) using calibration Method#2 for
9 February (stars) and 10 February (squares), 2012.
37
Fig. 5.τa scatter-plot obtained for CE-1 (master) and CE-2
(sec-ondary) using calibration Method#2 for 9 February (stars) and 10 February (squares), 2012.
These results confirm the optimum performance of the CE-1 under lowτaconditions.
6.2 Method#2
τa results using Method#2 have been evaluated for 9 and 10 February 2012. This method is based on Eq. (12) for coin-cident measurements with a master (CE-1) and a secondary instrument (CE-2). In our case CE-2 was calibrated using the average ratio of raw data of the two instruments during a sta-ble and clear night period. In this sense, 9 February 2012, was the best option, with a mean backgroundτa(440 nm)∼0.02.
Theτascatter-plot obtained using CE-1 and CE-2 is shown
in Fig. 5. τa comparison for 9 February and the day after
the calibration (10 February) shows a good concordance be-tween the values obtained from the master and the secondary instrument, with averaged differences below 0.003.
Maxi-mum absolute differences up to 0.004 are found in 1020 nm and 440 nm channels.
6.3 Method#3
The third method for a lunar photometer calibration involves the determination of the sky calibration coefficients (Cj)
us-ing the integratus-ing sphere procedure described in Sect. 3.2. The coefficients obtained for CE-1 using this Method are pre-sented in Table 6. For comparison with Method#1, we have derived the CE-1 sky calibration coefficients (Cj00) from the
κj constants in Table 3 considering the solid-angle j in Table 2. TheseCj00 are also presented in Table 6. Compar-ing these coefficients we note that those centred at 500 and 440 nm present higher relative differences, with values up to 25 %. Differences in the rest of channels are below 10 %. Higher discrepancies in shorter wavelengths channels might be due to uncertainties in the integrating sphere calibration technique because in these channels the sphere’s radiant flux is notably reduced.
The averaged differences (d1) between τa obtained with
the calibration coefficients calculated with this method (Cj)
and those determined with Method#1 (Cj00) for 9–14 Au-gust 2011, 11–12 October 2011, and 8–9 February 2012, are shown in Table 7. Lower discrepancies are observed in channels 1020, 675 and 870 nm. However, only differences in 1020 nm are within the limit of instrumental precision of
±0.01–0.02. Discrepancies are significantly higher for the rest of channels, up to 0.07 for 500 m central wavelength channel.
The previous results highlight the lower accuracy showed by Method#3, below the precision required to make compa-rable daytime and nighttime measurements. These discrep-ancies might be caused by a sum of contributions: (1) the ac-curacy onI0,jdue to the implementation of the ROLO model
(with an expected systematic errorε≥0.01); (2) the calibra-tion errors from the integrated sphere method to obtainCj’s
(ε= 0.03–0.05); and (3) uncertainties associated to the deter-mination of the solid angle(ε= 0.03–0.05). Since the first
Table 6. Master sky calibration coefficientsCjcalculated using an integrating sphere andC00jobtained fromκj’s and solid angles previously
determined, both in W m−2nm−1DC−1. The spectral relative variation between both coefficients (1rel in %) is included.
Channel (nm) 1020 1640 870 675 500 440
CE-1Cj 1.16×10⁻⁶ 2.15×10⁻⁷ 8.95×10⁻⁷ 1.15×10⁻⁶ 2.02×10⁻⁶ 1.70×10⁻⁶
CE-1Cj00 1.19×10⁻⁶ 1.97×10⁻⁷ 8.42×10⁻⁷ 1.13×10⁻⁶ 1.51×10⁻⁶ 1.88×10⁻⁶
1rel 2 8 6 3 25 −10
Table 7. Averagedτadifferences (d1) for seven nights period (9–
14 August 2011, 11–12 October 2011, and 9–10 February 2012) obtained with calibration Method#1 and #3 using CE-1 photome-ter data.d2corresponds toτa differences in the same time period
between Method#1 and #3 assuming a solid angle reported by the manufacturer,ref= 3.4×10⁻⁴sr.
Channel
(nm) 1020 1640 870 675 500 440
d1 −0.012 0.051 0.035 0.016 0.071 0.042 RMSE 0.013 0.053 0.037 0.017 0.074 0.044
d2 0.094 0.056 0.048 0.060 −0.004 0.019 RMSE 0.095 0.057 0.050 0.062 0.004 0.020
contribution also affects to Method#1, it is necessary to in-crease the accuracy of the integrating sphere calibration as well as in the determination ofto improve the results in Method #3 .
To check the error on the last contribution we have used the solid angle value provided by the manufacturer (ref= 3.4×10⁻⁴ sr) and the coefficients Cj presented in
Table 6.refis the wavelength independent solid angle
as-sumed by Berkoff et al. (2011) to obtain nocturnal τa
in-formation. A newτacomparison between Method#1 and #3
usingref is also presented in Table 7. It can be seen that
differences obtained (d2) are notably higher than d1 from Table 7 for 1020 and 675 nm channels, slightly higher for 870 nm, similar for 1640 nm, slightly lower for 440 nm and considerably lower for 500 nm. These differences are higher than those reported by Berkoff et al. (2011). It might indicate that the actual solid angle used by Berkoff et al. (2011) was closer to the manufacturer’s reported value. These discrepan-cies clearly indicate thatτacalculation is very sensitive to the
methodology to estimate.
6.4 Angstr¨om’s exponent
Angstr¨om values have been obtained with CE-1 for the same cases analysis as for τa (9–14 August 2011, 11–12
Octo-ber 2011, and 8–9 February 2012).
Nocturnalα values for CE-1 are computed as the slope of the linear regression of ln(τa) versus ln(λ) using channels
at 870, 675, 500 and 440 nm, as shown in Eq. (9). Mean daytime α sunset and sunrise values were extracted from
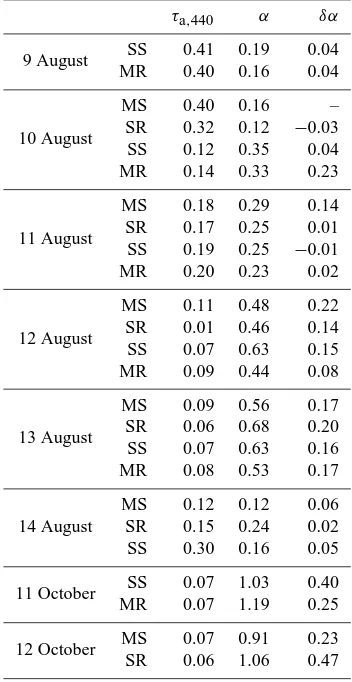
Table 8. Averaged values ofτa(in 440 channel),α(Angstr¨om
ex-ponent) andδαobtained in August and October 2011, case studies. Values are for SS (sunset), MR (moonrise), MS (moonset) and SR (sunrise).
τa,440 α δα
9 August SS 0.41 0.19 0.04
MR 0.40 0.16 0.04
10 August
MS 0.40 0.16 –
SR 0.32 0.12 −0.03 SS 0.12 0.35 0.04
MR 0.14 0.33 0.23
11 August
MS 0.18 0.29 0.14
SR 0.17 0.25 0.01
SS 0.19 0.25 −0.01
MR 0.20 0.23 0.02
12 August
MS 0.11 0.48 0.22
SR 0.01 0.46 0.14
SS 0.07 0.63 0.15
MR 0.09 0.44 0.08
13 August
MS 0.09 0.56 0.17
SR 0.06 0.68 0.20
SS 0.07 0.63 0.16
MR 0.08 0.53 0.17
14 August
MS 0.12 0.12 0.06
SR 0.15 0.24 0.02
SS 0.30 0.16 0.05
11 October SS 0.07 1.03 0.40
MR 0.07 1.19 0.25
12 October MS 0.07 0.91 0.23
SR 0.06 1.06 0.47
AERONET database. Results for τa at 440 nm, α and δα
are presented in Table 8 for the August and October 2011 events. In these tables, we have included the aerosol infor-mation extracted for the sunset (SS) and the moonrise (MR) as the average of the last 1-h data measured during daytime and nighttime, respectively. Moreover, we have considered data corresponding to sunrise (SR) and moonrise (MR), as the first 1-h data of each day and night.
large particles (>1 µm) during the saharan dust outbreaks. Minimum values below 0.2 are obtained for the periods 9– 10 August and 13–14 August, which coincide with two im-portant saharan dust intrusions over Tenerife and a maximum
τa>0.4 (9 August). According to Basart et al. (2009),α= 0.6
represents an appropriate threshold value of dust laden air masses influenced by other aerosols, whileα≤0.3 indicates the presence of pure desert dust. On the other hand,α >0.7 are found in those days with relatively low dust concentra-tions (τa<0.10) during the October case study, suggesting
the presence of other aerosols. A good concordance between daytime and nocturnalαvalues is found.
Finally, regarding the averages of the spectral variation of alpha (δα) presented in Table 8, we have obtained near zero or slightly negativeδαvalues between−0.01 and 0.01 dur-ing the important dust intrusions startdur-ing on 11 August and 14 August. These results are consistent with the experimen-tal values between −0.3 and 0.1 obtained by Basart et al. (2009) in case of coarse mode saharan aerosols. A stable pe-riod ofδαbetween 0.2 and 0.3 was observed from moonset 11 August to moonrise 12 August, and from moonset 12 Au-gust to moonrise 13 AuAu-gust. For October event, higherδα
values are retrieved, between 0.3 and 0.4. The lowτa
dur-ing this period (around 0.07 at 440 nm) and the positive val-ues ofδαindicate the existence of a bimodal-size distribu-tion (O’Neill et al., 2001; Eck et al., 1999). Theseδαusually occurs when accumulation and coarse mode aerosols appear well-mixed (Basart et al., 2009) while relatively high posi-tive values indicate the dominance of fine fraction aerosols (Eck et al., 1999).
7 Summary and conclusions
In this paper, we have described the preliminary results ob-tained with the new lunar photometer CE-318U, specifically designed to perform nocturnal photometric measurements. We have presented a first calibration strategy for this instru-ment which encompasses three different methods. Basically, this strategy requires the determination of the CE-318U cal-ibration coefficients or their transference from a master in-strument. The first Method consists of the adaptation of the usual Langley-plot method to nocturnal measurements. It in-troduces significant modifications to the current methodol-ogy, incorporating a lunar irradiance model (ROLO) to de-termine the instrument calibration coefficients. This strategy has been tested and validated using two CE-318U prototypes (CE-1 and CE-2), reporting discrepancies within the limit of
τa accuracy of the instrument (±0.01–0.02). For CE-1, this
calibration was applied in other time periods, demonstrating the stability of the calibration. Moreover, nocturnal and day-timeτa comparison using AERONET and PFR under low
and stableτaconditions on 12 October 2011, showed similar
differences between AERONET/PFR, AERONET/CE-1 and PFR/CE-1, within the AERONETτaaccuracy. This
compar-ison, against two independent reference instruments consti-tutes a valuable assessment of CE-318U performance.
Method#2 consists of transferring the calibration coeffi-cients from a master. Results showed very closeτa between
the two lunar photometers, with differences below 0.004. Method#3 is based on obtaining the sky calibration con-stants (Cj’s) using an integrating-sphere and then
retriev-ing the calibration coefficientsκj’s once the solid angle
is calculated. The comparison between τa obtained using
Method#3 and the Method#1 shows significantτadifferences
of 0.07 and 0.05 for 500 and 1064 nm channels, respectively. For the rest of channels differences are lower, below 0.05, but higher than the limit of instrumental accuracy expected for this instrument (±0.01–0.02). Such high discrepancies might be caused by the sum of errors in τa determination process using Method#3: (1) moon irradiances from ROLO model; (2) integrated sphere method to deriveCj’s; and (3) the methodology to calculate. Our study highlights the im-portance of accounting for a high-performance integrating sphere and an accurate determination ofto assure a good calibration following Method#3.
Finally, the comparison between daytime and nocturnalα
showed a good agreement between daytime and nighttime data.δαresults are also in agreement with the expected val-ues for different atmospheric conditions presented each night according to reference values reported in the literature.
The consistency of these results points to the capabili-ties of this new photometer to obtain aerosol propercapabili-ties at night. Since column aerosol optical properties from sunpho-tometers are limited to the day-light period, this information becomes an important limitation in polar regions. In addi-tion, monitoring the diurnal variation of aerosols is impor-tant in many sites associated to sea-land breezes, mountain-valley regime or the diurnal variations of the boundary layer height. It is also important for detecting the sharp changes that dust intrusions may experience in term of hours. Some sites with particular climatology present frequent clouds in the morning, while clear skies occurs during the night, re-sulting in important observation periods reduction with clas-sical sunphotometers. Nowadays, lidar techniques, as those used in MPLNET, operate in full-time continuous mode (24 h a day/365 days a year) to detect qualitatively the atmo-spheric aerosol content and its vertical distribution. However, it is necessary to improve the lidar extinction-to-backscatter ratio using additional τa information provided by lunar-photometers during nighttime. τa andαdetermination dur-ing the night can be used for long-term and near real time aerosol/dust models validation, as well as for new satellite-borne sensors verification. For example, the EUMETSAT In-frared Atmospheric Sounding Interferometer (IASI) sensor providesτa during the night (Kl¨user et al., 2012). So,
vali-dation of both model and satellite τa could be expanded to
night periods. Concerning operational aerosol observations, the last eruption of the volcano Eyjafj¨oll, in spring 2010, highlighted the weakness of the current monitoring of this
type of aerosols and the importance of having a continuous observation system to support the aircraft navigation. The joint observations of lidar/ceilometers and lunar photometers at night could help to fill monitoring gaps existing today.
To conclude, CE-318U lunar photometers in operational networks could be used as complementary instruments to ex-pand the column aerosol observation periods and to enhance the operational capability in the Aerosol Robotic Network (AERONET). However, the complexities inherent to the lu-nar irradiance pattern, make lulu-nar photometry a difficult task compared to sun-photometry. Thus, despite the good results reported in this paper, it is necessary to design a more re-fined calibration procedure. Further developments should be oriented to develop a photometer capable of taking measure-ment during both daytime and nighttime. Concerning cali-bration, efforts should be paid to transfer direct-sun Langley calibration to moon observations.
Nevertheless, at the present state, lunar photometry is an attractive option to complete aerosol databases.
Acknowledgements. The authors wish to thank Cimel for providing
the two prototypes used in this study as well as all the technical support. In addition, we wish to express special thanks to Stone, at the United States Geological Service (USGS) for helping to implement the ROLO model and provide wise counsel to this paper. The Aeronet sunphotometer at Iza˜na has been calibrated within AERONET-EUROPE TNA supported by the European Community – Research Infrastructure Action under the FP7 “Capacities” specific programme for Integrating Activities, ACTRIS Grant Agreement no. 262254. The GAW-PFR network for AOD at GAW Global observatories has been implemented by the World Optical Depth Research and Calibration Center (WORCC). We want to thank Wehrli for supporting quality control and quality assurance of GAW-PFR data and for personal communications in this paper. Finally, the authors would like to express their thanks to the security staff at Iza˜na Observatory for kindly supporting the night operation of the lunar instruments. The integrating sphere was provided by the Infrastructure project entitled RIMA: Instru-mental para infraestructura de calibracin fotom´etrica (RIMA-LC), Ref. UNVA05-23-038 from the Atmospheric Optics Group (GOA) at the University of Valladolid. Finally, the authors would like to thank the anonymous reviewers for their constructive suggestions.
Edited by: O. Torres
References
Angstr¨om, A. K.: On the atmospheric transmission of sun radiation and on the dust in the air, Geogr. Ann.,12, 130–159, 1929. Basart, S., P´erez, C., Cuevas, E., Baldasano, J. M., and Gobbi,
G. P.: Aerosol characterization in Northern Africa, Northeastern Atlantic, Mediterranean Basin and Middle East from direct-sun AERONET observations, Atmos. Chem. Phys., 9, 8265–8282, doi:10.5194/acp-9-8265-2009, 2009.
Berkoff, T. A., Sorokin, M., Stone, T., Eck, T. F., Hoff, R., Wel-ton, E., and Holben, B.: Nocturnal aerosol optical depth
mea-surements with a small-aperture automated photometer using the moon as a light source, J. Atmos. Ocean. Tech., 8, 1297–1306, doi:10.1175/JTECH-D-10-05036.1, 2011.
Campbell, J. R., Hlavka, D. L., Welton, E. J., Flynn, C. J., Turner, D. D., Spinhirne, J. D., Scott, V. S., and Hwang, I. H.: Full-time, Eye-Safe Cloud and Aerosol Lidar Observation at Atmospheric Radiation Measurement Program Sites: Instrument and Data Pro-cessing, J. Atmos. Oceanic Technol., 19, 431–442, 2002. Eck, T. F., Holben, B. N., Reid, J. S., Dubovik, O., Smirnov, A.,
O’neill, N. T., Slutsker, I., and Kinne, S.: Wavelength depen-dence of the optical depth of biomass burning, urban, and desert dust aerosols, J. Geophys. Res., 104, 31333–31349, 1999. Guirado C., Ramos, R., de Frutos, ´A., Berj´on, A., Redondas, A.,
L´opez, C., Cachorro, V., Cuevas, E., Gonz´alez, R., Gonz´alez, S., and Hern´andez, M.: Optical calibration facility at the Iza˜na At-mospheric Research Center, Opt. Pura Apl., 45, 57–62, 2012. Herber, A., Thomason, L. W., Gernandt, H., Leiterer, U., Nagel,
D., Schulz, K., Kaptur, J., Albrecht, T., and Notholt, J.: Con-tinuous day and night aerosol optical depth observations in the Artic between 1991 and 1999, J. Geophys. Res., 107, 4097, doi:10.1029/2001JD000536, 2002.
Holben, B. N., Eck, T. F., Slutsker, I., Tanr´e, D., Buis, J. P., Set-zer, A., Vermote, E., Reagan, J. A., Kaufman, Y. J., Nakajima, T., Lavenu, F., Jankowiak, I., and Smirnov A.: AERONET – A federated instrument network and data archive for aerosol char-acterization, Remote Sens. Environ., 66, 1–16, 1998.
IPCC: Intergovernmental Panel on Climate Change: Climate change 2007: The physical Science Basis, Cambridge University Press, UK, 2007.
Kaufman, Y. J., Gitelson, A., Karnieli, A., Ganor, E., and Fraser, R. S.: Size distribution and phase function of aerosol particles retrieved from sky brightness measurements, J. Geophy. Res.-Atmos., 99, 10331–10356, 1994.
Kieffer, H. H. and Stone, T. C.: The spectral irradiance of the moon, Astronom. J., 129, 2887–2901, 2005.
Kim, D., Chin, M., Yu, H., Eck, T. F., Sinyuk, A., Smirnov, A., and Holben, B. N.: Dust optical properties over North Africa and Arabian Peninsula derived from the AERONET dataset, Atmos. Chem. Phys., 11, 10733–10741, doi:10.5194/acp-11-10733-2011, 2011.
Kl¨user, L., Kleiber, P., Holzer-Popp, T., and Grassian, V. H.: Desert dust observation from space – Application of measured min-eral component infrared extinction spectra, Atmos. Environ., 54, 419–427, 2012.
Li, Z., Blarel, L., Podvin, T., Goloub, P., Buis, J. P., and Morel, J. P.: Transferring the calibration of direct solar irradiance to diffuse-sky radiance measurements for Cimel sun-diffuse-sky radiometers, Appl. Opt., 47, 1368–1377, 2008.
Meeus, J.: Astronomical Algorithms, Willmann-Bell Inc., 1st Edn., Richmond, Virginia, USA, 1991.
Nyeki, S., Halios, C. H., Baum, W., Eleftheriadis, K., Flentje, H., Gr¨obner, J., Vuilleumier, L., and Wehrli, C.: Ground-based aerosol optical depth trends at three high-altitude sites in Switzer-land and southern Germany from 1995 to 2010, J. Geophys. Res., 117, D18202, doi:10.1029/2012JD017493, 2012.
Smirnov, A., Holben, B. N., Eck, T. F., Dubovick, O., and Slutsker, I.: Cloud screening and quality control algorithms for the AERONET database, Remote Sens. Environ., 73, 337–349, 2000.
Spinhirne, J. D., Rall, J. A. R., and Scott, V. S.: Compact Eye Safe Lidar Systems, Rev. Laser Eng., 23, 112–118, 1995.
Stohl, A. and Seibert, P.: Accuracy of trajectories as determined from the conservation of meteorological tracers, Q. J. Roy. Me-teorol. Soc., 124, 1465–1484, 1998.
Stohl, A., Wotawa, G., Seibert, P., and Kromp-Kolb, H.: Interpola-tion errors in wind fields as a funcInterpola-tion of spatial and temporal resolution and their impact on different types of kinematic tra-jectories, J. Appl. Meteor., 34, 2149–2165, 1995.
Toledano, C., Cachorro, V. E., Berj´on, A., de Frutos, A. M., Fuertes, D., Gonz´alez, R., Torres, B., Rodrigo, R., Bennouna, Y., Mart´ın, L., and Guirado, C.: RIMA-AERONET network: long-term monitoring of aerosol properties, Opt. Pura Apl., 44, 629– 633, 2011.
Walker, J. H., Cromer, C. L., and McLean, J. T.: Calibration of pas-sive remote observing optical and microwave instrumentation, in: Proc. SPIE – The International Soc. of Optical Engineering, Or-lando, FL, USA, 3–5 April 1991, 1493, 22–230, 1991.
Wehrli, C.: Spectral Solar Irradiance Data, WMO ITD 149, Geneva, WMO, 1986.
Zhang, J., Reid, J. S., Miller, S. D., and Turk, F. J.: Strategy for studying nocturnal aerosol optical depth using artificial lights, Int. J. Remote Sens., 29, 4599–4613, 2008.