STUDENTS’ CONCEPTIONS OF THEIR LEARNING MAY HELP IN PREDICTING THEIR PROGRESS
Päivi H. Porras1, Jaakko A. Turunen2
1
Saimaa UAS, Finland
2
Mikkeli UAS, Finland
Abstract
Students struggling in their mathematical studies in the department of Technology in universities of applied sciences have been a concern for several years. In 2010 and 2011, new students in Saimaa UAS were asked to fill in two surveys concerning their motivational and self-regulation aspects. Based on these surveys and the proficiency test held at the beginning of their studies, we formed profiles to predict their progress in math courses. Furthermore, teaching methods were developed to support motivated but weak students in their mathematical studies. This article will describe the process of profiling and how well the progress could be predicted by student’s own conception of studying habits. It also describes new teaching methods used and their influence on progress.
Keywords: motivation, self-regulation, self-confidence
1. INTRODUCTION
Universities of applied sciences in Finland receive funds primarily from the Ministry of Education and Culture. One key issue in budgetary appropriation is the number of students graduating from the institution. Especially in engineering, the problem is dropouts. During the first year or just after it, many students drop their engineering studies and, unfortunately, these students seem to also have struggled in their mathematics courses.
Young people under 25 are obligated to apply for a study place in Finland if they are out of work. Without applying for a study place, they have no rights to allowances paid by social welfare. This may partly explain the lack of motivation in beginning students and the resultant dropout rate. On the other hand, some of the struggling students have already been working in their chosen field, so motivation should not be the problem. This article studies the profiles of beginning students in mathematics and how these profiles might be factored into the course arrangements, so that more students would graduate.
The educational backgrounds of engineering students at universities of applied sciences (UAS) include those from both vocational colleges and high schools. Some of them have studied only a little math after primary school, while others would qualify for a degree programme in mathematics. Normally, the progress of university students is observed in the results of the final exam, meaning that a student may have been struggling for several weeks or even months before being notified by a lecturer. Although the lecturer would give the extra help at that time, the student may already have dropped out. The idea of profiling the students at the beginning of their studies is that extra help could be provided during the course to the motivated weaker students. Because of time resources this help cannot usually be provided to all students.
For that reason, beginning students in Saimaa UAS were asked to participate in a proficiency test to reveal their actual calculation skills (Porras 2012a, 2012b). During 2010 and 2011, new students at Saimaa UAS, Finland, filled in the surveys about motivational and self-regulating aspects of learning. Combining the two data of 2010 and 2011, appropriate information was found and profiles were formed. These profiles were used with the beginning students of 2012 and 2013. In 2013 the same profiles were also used in Mikkeli UAS for predicting students’ progress.
2. PROGRESS IN MATHEMATICS
As described previously, students from academic years 2010 and 2011 filled in the surveys about motivation and self-regulation. The motivation questionnaire consisted of 15 questions with four alternatives in each question. Those 60 alternatives altogether handle all motivation groups presented by Kauppila (2003). Students were asked to give 1, 2 or 3 points for alternatives in each question. The highest points should be given to the alternative best describing the student, the second highest to the next one etc. They did not need to use all points but at least one point must be given in every question. Inside the question, the points could not be given twice. At least one alternative was left empty for every question. This kind of ordering for alternatives was used to know which of the alternatives motivated students most. In the questionnaire of self-regulation, there were 12 questions with four alternatives in each question. Contrary to the motivation questionnaire, students were asked to use five-level Likert scale for the self-regulation questionnaire. One point meant that “it does not describe me at all” or “I hardly ever feel like this”. Five points meant “it describes me” or “I feel like this almost all the time”.
These answers, students’ background information like previous education, mathematics studied in a high school as well as results on the proficiency test were used for analysing progress in mathematics based on grades. Students could not answer the surveys anonymously because their grades in math courses were included in the data. Analyses were mainly done with Decision Tree in IBM SPSS, as it shows which questions in surveys highlight features the best. IBM SPSS also enables syntax programming. When a new significant feature was found, it was included to a variable called student type to classify students. Little by little students were categorised into four types:
1. Students at risk 2. Weak students 3. Average students 4. Excellent students
For example, it could be seen that students giving more than one point to the choice “I probably do not need supervising in mathematics as it has always been easy to me” are passing the courses with good grades. On the other hand, giving at most one point to that sentence and the highest points to the sentence “I have to work to pass the courses” refer to the struggling student. Both these sentences describe self-esteem, and the weaker students seem to have significantly weaker self-esteem. It has been shown that students’ expectation of their own learning has a great impact on performance (Lewis 2011, Porras 2012a). This suggests that elevating weaker students’ self-esteem may positively affect in their progress.
One surprising sentence was “When studying the math courses, I look for extra material from the Internet or a library if needed”. This sentence was originally meant for finding self-regulated students. However, high points here, combined with weak results in the proficiency test, is suggesting that the student is struggling with math. According to Clarebout et.al (2010), no evidence is found that weaker students even benefit from the use of support devices such as e-learning materials. It would be interesting to know whether these students are not capable of recognizing good material, do not understand the material they are reading, or are just trying to copy-paste solutions for their exercises.
Results of analysis were compressed to sixteen profiles. The number of profiles is quite high and it may be decreased after further analysis. Remember that the profiles should describe also the average students, as not all students are excellent, or struggling in their studies. During the academic year 2011-2012, there was also included the last choice “None above describes me”. This choice was only selected by the students, who failed their first course in math. Does it infer that some weak students do not even recognize their customs and thoughts during the studies?
One interesting profile was “I want to graduate as fast as possible, so I find out a lecturer’s requirements and custom.” Although the profile seems to be encouraging and self-regulated, it was selected mainly by weaker students. It seems that these students selected engineering based on status. Students are not ready to work to gain the good grades, but they are doing lot of work to avoid actual
studying. More detailed information in surveys and results of motivation and self-regulation as well as profiling may be found in Porras (2012a, 2012b).
3. FIRST SEMESTER IN SAIMAA UAS 3.1 IntroductionintoMathematics
Students for this course are selected by the proficiency test. Because of the wide range in math skills, students participated in the proficiency test at the beginning of studies. If a student got at least 90% of the maximum points in the proficiency test, the student did not need to take the course. All the others were directed to the course.
All main topics of basic calculation are gone through during the course. This includes everything from basic arithmetic calculation and handling expressions to solving polynomial equations. All the topics should be understood before entering the engineering studies, but for one reason or another, they are not.
As the topics are so essential for all mathematics, students are required to answer all test questions correctly. There are several smaller tests during the course, where students can show their skills. If the student makes a mistake on the test, the test may be taken again on the failed part. Failing a test did not prevent attending the next test.
3.2 Profiles in course arrangements
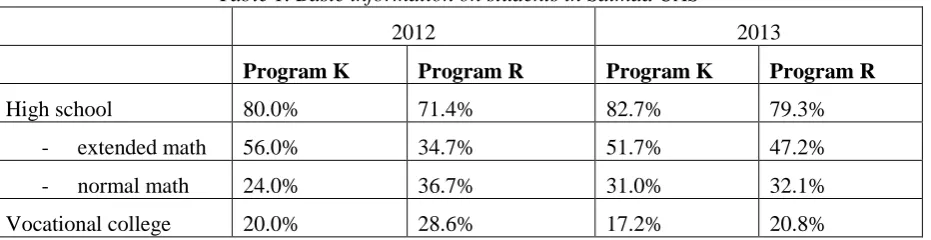
According to Table 1, the number of high school students in both programs is significantly higher than the number of students from vocational colleges. As the high school students are considered to be better in theoretical subjects, these students should not have big problems in math courses. Furthermore, the proportion of students with extended math in program “K” is higher than in program “R”. Students with extended math should not have any difficulties in their first year math studies, so passing the math courses should not be a problem in program K.
Table 1. Basic information on students in Saimaa UAS
2012 2013
Program K Program R Program K Program R
High school 80.0% 71.4% 82.7% 79.3%
- extended math 56.0% 34.7% 51.7% 47.2%
- normal math 24.0% 36.7% 31.0% 32.1%
Vocational college 20.0% 28.6% 17.2% 20.8%
When students are profiled based on their results in the proficiency test and suspected student type, the progress does not look so obvious anymore. As seen in Table 2, the number of students struggling in their math studies is about 60 per cent. One part of this can be explained with the will to recognize all the struggling students: even a slight doubt will cause a mark of being under observation. However, this cannot explain the tremendous lack of calculation skills these students have. Further analysis showed that almost all students from vocational colleges were classified to be at risk. These students usually are very motivated in their professional hands-on studies but theoretical subjects cause difficulties: maybe avoiding theoretical studies was the reason for applying to vocational college. Motivating these students will produce skilled engineers for the field.
The bigger issue is that high school students with normal math are also mainly classified to be struggling. After studying in high school, these students should be familiar with theoretical subjects and mathematics. If we look at history, we find that the normal math was originally meant for students
not applying natural or technological fields. These students were keen on languages, social care, law etc. After reform of tertiary level education in Finland, more and more of these students are applying in universities of applied sciences to study engineering. Many of these students have not actually wanted to join the field but descended into the field. Thus, these students may lack the professional motivation and mathematical skills.
Table 2.Predicted progress
2012 2013
Program K Program R Program K Program R
at risk 52.0% 40.8% 48.3% 54.7%
weak 16.0% 20.4% 13.8% 22.6%
average 12.0% 18.4% 10.3% 13.2%
excellent 20.0% 20.4% 27.6% 9.4%
3.3 INTRODUCTION INTO MATHEMATICS
The course Introduction into Mathematics was traditionally lectured separately in programs with same amount of lectures. In 2012 and 2013, the decision was made to separate the course according to student types and results in the proficiency test. The group called A consisted of the weakest students. These students had major problems in their calculation skills. The group called B did not have excellent results but they were assumed to benefit from revision in basic calculation. For this reason, one third of their lectures were allocated to the group A. All excellent students with good results in the proficiency test were exempted from this course.
Both groups had their own lectures and lecturers, meaning that lectures were planned independently. However, weekly topics were decided on in advance as topic tests every other week were the same for both groups. The same topic tests were used, as it made comparison of progress possible.
Lectures of the group B followed the lecturer’s traditional way of teaching. These students got the lecture on the topic with examples and solved most of the exercises after the lectures. The lectures of the group A were totally redeveloped. It was thought that if these students did not benefit from the traditional teaching in their previous education, the method would not be any better for current studies. It must be noted that this lecturer also had more lecturing time for every topic. These students should reach the calculation skills needed in engineering in a very short time.
Instead of the topic being lectured, all topics were started by thinking about it together. Not all students had even studied some topics and some of these students had enormous deficits in calculation skills, so it was very important to relate topics to pre-known basic calculation instead of just writing
the formula on the board. For example, writing 2 x
in the form 1
2x was not always understood. This was explained as “If a banana is bisected, then one gets half of the banana”. At this level, it would have been waste of time to derive the formulae in theory only.
During the discussion section, students related the topic to their pre-knowledge from the previous education and previous lectures and tried to find new solution methods. The lecturer only started the lecture with a problem and led the discussion by giving some hints or by asking questions.
After the “lecturing”, students got their exercises. The main idea was that students could solve all exercises during the lectures. As mentioned earlier, these students were very weak in their math skills, so the lecturer wanted to keep abreast of progress. This kind of teaching also enabled correction of mistakes in notations before they became automatic. If many students struggled with the same problem, it was solved on the board together with the discussion method; the lecturer was a secretary
and the students told what should be written. The lecturer wrote also the notation mistakes, expecting that somebody would remark on them. The lecturer had to correct the mistakes without prompting from the students only a few times.
Part of the exercises were changed from traditional “solve the problem” or “simplify” kinds of problems. As found in literature (Kovarick 2010, Powell 1997), writing, e.g. essays, in mathematics helps in deepening understanding. The method, called “languaging”, compels a person to understand the topic as it must be explained on paper. These students were not asked to write essays but to explain the solution method. Without the languaging, students may have only dipped into the calculation and tried to copy the method in upcoming exercises without thinking. With this problem they were forced to explain to themselves why a particular step is done.
In some problems, the solution included common mistakes. Students were asked to find the mistakes and also solve the problem without them. All mistakes were usually found easily by students. The catch in this problem was that when solving the traditional exercises, students may have made exactly the same mistakes. The light on a student’s face at the moment of realization that the same mistake had been corrected just five minutes ago, revealed the learning.
Students were allowed to do exercises in groups. Most of students formed groups of 2 - 4 students in whose they were working. Only some students worked alone. There were lots of discussions about exercises and their solutions in groups. Although one student may have been a little bit better than the others, this student’s solutions were not just copy-pasted: questions were asked and solution methods were questioned. Students were told at the beginning of the course, that they are equally good at mathematics. This may explain why they did not take anything on trust.
3.4 Feedback from the course
The feedback in the group A was great. Students liked the pace during the lectures and that the help was always available. One student wrote that “Lectures were easy to follow and even me, who have never before studied these topics, could understand and learn them. Do not change anything in the course arrangements”.
Students also liked the small topic tests. According to them, it gave them motivation to study as the number of topics was not too big to handle. With small topic tests, students became alerted quickly if they had misunderstandings in the topic.
Although the overall feedback was excellent, there is still room for improvements. Students did not receive the correct answers, but the problems were always solved on the board. Answers were intentionally not given in order to prevent misbehaviour: some students check the answer first and then start to think how it was obtained. In real-life engineering, this kind of method does not work. However, the missing answers impede studying at home.
The relaxed atmosphere during the lectures was a complex issue. Students easily approached the lecturer and asked for help. They also discussed the exercises in small groups. Overall, students were active in learning. At the same time, some students suffered from the noise. Some kind of balance must be found in the future.
4. INFLUENCES ON PROGRESS OF MATH STUDIES
Results of the introduction course are promising. As shown in Table 3, only a few students from the group A failed the course.
Table 3.Results of the introduction course
2012 2013
failed total failed total
Group A 4 28 3 31
Group B 1 29 3 31
As the results and background of students from program K were so promising, the expectations for the first mathematical course were high. However, forty per cent of the students failed the course in 2012 and 28% in 2013. In program R, the proportion of the failed students was about 12.5 per cent in both years. There are many reasons for this terrible result in the program K, and it can never be explained thoroughly. The teacher of the group A lectured the first professional math course in the program K and the teacher of the group B lectured in the program R. Content of the courses is basically the same but, of course, different topics of the special interests in the field were highlighted. Both lecturers had done well with the introduction course. However, some kind of reflection about the teaching is needed.
The lecturer A had worked at the university level for ten years before teaching at Saimaa UAS, whereas the lecturer B had previously worked at the high school level. Perhaps the demands of the lecturer A for passing the course were too high. Although the lecturers may have influenced the passing with their demands, it cannot be the only reason. When the introduction course was given, group A had 8 lectures a week and the group B had 4 lectures a week. At the same time both groups were studying 3 lectures a week for the first math course as well, along with all the other courses. The demand of “no mistakes” for passing the introduction course may have caused great pressure for the students. When the course ended, they just broke down and could not concentrate on math anymore.
The lecturer A did not have so much time for teaching the first math course as for the introduction course. There was no time to reform the exercises taking the languaging into account, nor was there time to check all exercises. As a result, the lecturer A reverted to old habits in teaching, though knowing that the new way had brought promising results.
The students of program K start their first year project at the same time when the introduction course ends. In their project, they have to design and manufacture a man-powered vehicle with three wheels. At the end of the academic year, they have a time trial where the best vehicle is selected. This project takes considerable time and effort. Because students find it interesting, they take the time from not so interesting topics, e.g. mathematic, and the tailspin begins.
5. FURTHER ANALYSIS OF PROFILES
As the profiles were originally formed based on surveys on motivation and self-regulation, it is worth checking their validity. Each profile was selected as classifying profile in decision tree, where the grades of the first math course classified. Other independent variables were the rest of the profiles, total points in the proficiency test, and scores of individual questions in the proficiency test. The interesting profiles are listed in Table 4. Students selected the profile during their first week of studies, so they represent students’ preconception at the moment. Students could select three profiles best describing themselves.
Table 4. Interesting profiles
Code Explanation
P1 I feel mathematics is important but my skills may not suffice.
P3 I do not usually motivate myself with rewards (like a cup of coffee) but I may do it with difficult courses.
P5 I look for extra help from the Internet or the library.
P10 I think that I am good at mathematics and I do not easily ask for help. Sometimes, I may have issues with the time.
P11 I think that mathematics is interesting. I try to understand the topic and to get feedback already during the course.
P15 I am not sure that this professional field is suitable for me.
P16 It is important to show practical examples, how mathematics is used.
If a student selected the profile P1 and did not even try to solve the problem concerning rational expressions, the student was marked to be at risk. Those students, who did not even try to solve the problem concerning formulas and did not select this profile, can be marked to be at risk. In both problems, concerning expressions or formulaes, there are “letters” in variables and parameters. Thus, it seems that working with mathematical expressions is not handled.
The students, who selected the profile P3 and could not solve the problem concerning basic algebraic operations, mostly failed the first math course. These students have fundamental lacks in calculation skills and, obviously, they are not very keen on math studies. In the entrance examination, students are allowed to use a calculator but not in the proficiency test. Despite their lacks in calculation skills, they passed the entrance examination. Is it possible, that these students trust so much in their calculators that they do not actually solve anything without them?
Profile P5 was already in the motivation survey in the same form. The main idea was to find self-regulated students. Already in surveys and also later in profiles, this sentence combined with weak results in the proficiency test, revealed that the student was at risk in math studies. This could be seen especially among students from vocational colleges.
Profile P10 describes a student with a good self-esteem. However, a good self-esteem with weak knowledge may not be the best combination. Some students selecting this profile could not solve linear equation correctly. Obviously, these students could be predicted to be weak. The students neither selecting this profile nor solving the rational expressions could be marked to be at risk.
Profile 11 and the problem concerning formulae seem to be one cornerstone. Although students selecting this profile are self-regulated students, it is not enough. If these students did not even try to solve the formulae, they failed the first course. If they solved it incorrectly, they could be predicted to be weak students. Students, who did not select this one and could not solve the basic arithmetic problems, can be predicted to be at risk. Obviously, these students do not understand the need for mathematics in engineering.
Selecting the profile P15 at the first week of their studies is a warning sign. Although these students would not drop out, motivating them is not easy at all. All these students got lower grades in their first math course.
When profiles were formed based on surveys, it was found that students needing practical examples received lower grades than the other students at the same level. For example, a student with extensive math in high school may not have the highest grades but the grades in the middle. Still, the students selecting this profile were not the excellent students, but it revealed the motivation for learning among weak students. After finding this result, I checked the information on two known students. Both of
them were predicted to be at risk as their results in the proficiency test were extremely low and profiles were not very promising. One of them asked a lot of questions already during the introduction course. This student is now above the average in that group. The other student is always in lectures and quietly listens to the teaching. Results in tests have not been very promising. During the discussion with this student, it was easy to see that there exists a desire to learn. There seems to be perceptual problems combined with lack of knowledge delaying the learning. The student thankfully accepted the extra help for catching up in knowledge.
Overall, handling the expressions seems to be the main problem for weaker students. Although these skills can be taught, the bigger issue is in student’s self-esteem and desire to learn. Strong self-esteem with weak knowledge is not always a good thing, but then, low self-esteem seems to lower grades also for good students.
6. SUMMARY
There are many studies of learning mathematics (e.g. Houston et.al 2010, Corte et.al 2009, Hannula et.al 2004). According to the studies the more motivated and/or self-regulated students are, the better grades they achieve. However, the highly-motivated student may lose interest if the mathematical background is weak and no help and/or encouragement are available. Recognizing the weaker but motivated students and encouraging these students may be even more important than just recognizing the motivated and self-regulated students.
Languaging gave promising results during the introduction. However, rewriting all or even some exercises in this form requires time that is not readily available to the lecturer. Hopefully, languaging will come into common use with time. Also, starting the new topic by refreshing previous knowledge of the subject should help students in understanding. This could be seen in the introduction course with weaker students. At this point, it is very important that the lecturer speaks the same language as students. The examples must be easy to understand for all students.
Although re-organizing the lectures from traditional lecturing to discussion-based format requires time and effort, it is worth it. Obviously, attempting to address all learning styles during classes, also in mathematics, promotes understanding. At least in Saimaa UAS, this method will continue and be developed further in mathematics.
Studying with others should also be encouraged (Perger 2013, Angier & Povey 1999). It allows students to help each other, and they may get more exercises done. Furthermore, when explaining their solutions to the others they must have deeper understanding as solutions must be explained more clearly for fellow students. Like in languaging, progress may not be seen by the teacher so easily, but there is a lot of reasoning done. This is probably the support that the weaker students need. It seems that students should select groups by themselves as there must be mutual trust between all members: all members should be able to ask ‘dumb’ questions without fear of losing face.
Without a doubt, profiling the students gives more information and helps out with course arrangements. It revealed the students who should be tutored more thoroughly. If students’ self-esteem in mathematics can be improved, skills do improve. In the long run, this produces more graduates and decreases frustration felt by students.
REFERENCES
Angier, C & Povey, H 1999, ‘One teacher and a class of school students: Their perception of the culture of their mathematics classroom and its construction’, Educational Review, vol. 51, no. 2, pp. 146-160.
Clarebut, G, Horz, H, Schnotz,W & Elen, J 2010, ‘The relation between self-regulation and the embedding of support in learning environments’, Education Tech. Research Dev., vol. 58, pp. 574-587.
De Corte, E, Verschaffel, L & Op’t Eynde, P (2000), ’A Characteristics and a Goal of Mathematics Education, in Boekarts et.al (eds.), A Handbook of Self-regulation, San Diego – USA, pp. 687-725.
Hannula, M, Maijala, H & Pehkonen E (2004), ’Development of Understanding and Self-confidence in Mathematics; Grades 5-8’, in Proceedings of the 28th Conference of the International Group for the Psychology of Mathematics Education, Bergen-Norway, vol. 3, pp. 17-24.
Houston, K, Mather, G, Wood, L, Petocz, P, Reid, A, Harding, A, Engelbrecht, J & Smith, G (2010), ‘Is ther Life after Modelling? Student Conceptions of Mathematics’, Mathematics Education Research Journal, vol. 22, no. 2, pp. 69-80.
Kauppila, R 2003, Opi ja Opeta tehokkaasti, Ps-Kustannus, Juva.
Kovarick, M 2010, ‘Building Mathematics Vocabulary’, International Journal for Mathematics Teaching and Learning, October 12.
Lewis, J 2011, Effect of Self-Regulated learning Strategies on Preservice Teachers in an Educational Technology Course, Education, vol. 132, no. 2, pp. 455-464.
Perger, P 2013, ‘What They Say, What They Do – Understanding Student’s Perceptions’, International Journal of Mathematics and Teaching and Learning, December 10.
Porras, P 2012a, ‘Profiles of engineering students in mathematics’, in J Björkvist et.al (eds), International Conference of Engineering Education 2012, Turku-Finland, vol. 1, pp. 50-56
Porras, P 2012b, ‘Enthusiasm towards mathematical studies in engineering’, in Tai-Yih Tso, Proc. of the 36th Conference of the International Group for the Psychology of Mathematics Education , Taipei-Taiwan, vol. 3, pp. 313-320.
Powell, AB 1997, ‘Capturing, examining, and responding to mathematical thinking through writing’, The Clearing House: A Journal of Educational Strategies, Issues, and ideas, vol. 71, no. 1, pp. 21-25.