www.atmos-meas-tech.net/8/4671/2015/ doi:10.5194/amt-8-4671-2015
© Author(s) 2015. CC Attribution 3.0 License.
An automated cloud detection method based on the green channel
of total-sky visible images
J. Yang1,2, Q. Min2,3, W. Lu1, W. Yao1, Y. Ma1, J. Du3, T. Lu1, and G. Liu4
1State Key Laboratory of Severe Weather, Chinese Academy of Meteorological Sciences, Beijing 100081, China 2Atmospheric Sciences Research Center, State University of New York, Albany, NY 12203, USA
3School of Remote Sensing and Information Engineering, Wuhan University, Wuhan 430079, China 4Smart Grid Operation Research Center, China Electric Power Research Institute, Beijing 100192, China
Correspondence to: Q. Min ([email protected])
Received: 31 March 2015 – Published in Atmos. Meas. Tech. Discuss.: 4 May 2015 Revised: 16 October 2015 – Accepted: 23 October 2015 – Published: 5 November 2015
Abstract. Obtaining an accurate cloud-cover state is a chal-lenging task. In the past, traditional two-dimensional red-to-blue band methods have been widely used for cloud detec-tion in total-sky images. By analyzing the imaging princi-ple of cameras, the green channel has been selected to re-place the 2-D red-to-blue band for detecting cloud pixels from partly cloudy total-sky images in this study. The bright-ness distribution in a total-sky image is usually nonuniform, because of forward scattering and Mie scattering of aerosols, which results in increased detection errors in the circumsolar and near-horizon regions. This paper proposes an automatic cloud detection algorithm, “green channel background sub-traction adaptive threshold” (GBSAT), which incorporates channel selection, background simulation, computation of solar mask and cloud mask, subtraction, an adaptive thresh-old, and binarization. Five experimental cases show that the GBSAT algorithm produces more accurate retrieval results for all these test total-sky images.
1 Introduction
Clouds play an important role in the global water cycle and the Earth’s radiation budget (Kokhanovsky, 2006), and their sky coverage and movements are strongly influenced by weather phenomena. Currently there are numerous satellite-based and ground-satellite-based instruments engaged in retrieving global cloud coverage. Satellites provide large-scale cloud observations but their relatively low spatial and temporal res-olution often lead to some uncertainties in quantifying cloud
features. In contrast, ground-based instruments can provide high temporal resolution measurements for clouds. Tapakis and Charalambides (2013) give a more fully detailed review about the advantages and disadvantages of satellite observa-tions and ground observaobserva-tions.
Several automatic ground-based sky imaging devices were manufactured and implemented in order to retrieve cloud coverage and type from the visible portion of the electro-magnetic spectrum. These instruments include the Total-Sky Imager (TSI) (Long and DeLuisi, 1998), the Whole-Sky Im-ager (WSI) (Johnson et al., 1989; Shields et al.,1993), the Whole-Sky Camera (WSC) (Long et al., 2006; Calbó and Sabburg, 2008), the All-Sky Imager (Cazorla et al., 2008), the All-Sky Imager system (ASIs) (Huo and Lu, 2009), the Total-Sky Cloud Imager (TCI) (Yang et al., 2012) and the Solmirus All-Sky Infrared Visible Analyzer (ASIVA) (Mor-ris and Klebe, 2010; Klebe et al., 2014). Each of these im-agers can retrieve the color total-sky images at user-defined intervals using a color charge-coupled device (CCD) or a Complementary Metal-Oxide Semiconductor (CMOS) cam-era with a fisheye lens or a parabolic mirror. These instru-ments adopt various strategies to deal with the intense direct radiation from the sun: a solar-tracking occulter is used in most of the imagers except ASIVA and TCI; TCI uses an auto-exposure technology, instead of a shadow band, to cap-ture unsaturated images.
tioned instruments to discriminate cloud pixels from sky pix-els for 8-bit red-green-blue (RGB) color images (the intensity range is 0–255 for each channel). The WSI team (Johnson et al., 1988; Koehler et al., 1991) adopted two fixed thresh-olds (FT) to discriminate clear sky, thin cloud, and opaque cloud in red-to-blue ratio (R/B) space. Long et al. (2006) detected clouds in the WSC images using 0.6 as a single FT in R/B space, and a sophisticated clear envelop func-tion with some configurable settings was used to improve the cloud detection accuracy for a commercial TSI instru-ment. Heinle et al. (2010) adoptedR−Bdifference instead of R/B ratio and recommendedR−B=30 as an optimal FT to detect clouds. Yamashita et al. (2004) defined a sky index, which is equal to (B−R)/(B+R), and considered sky index values less than 0.2 as cloud areas. The adaptive threshold (AT) method (Yang et al., 2009) and hybrid thresh-old algorithm (HYTA) (Li et al., 2011) were proposed to de-tect clouds within a small field of view in (R−B)/(R+B) space. Yang et al. (2012) improved the AT method and pro-posed the background subtraction adaptive threshold (BSAT) method, which is suitable for total-sky images. Combining the clear sky library (CSL) (Ghonima et al., 2012; Chow et al., 2011) and the sunshine parameter (SP) (Pfister et al., 2003), a more accurate cloud classification can be obtained compared to the FT method in theR/B space. In addition to these 2-D red-to-blue methods, Souza-Echer et al. (2006) utilized the predefined upper and lower thresholds to clas-sify image pixels into clear sky, cloud, and undefined class in 1-D saturation component space. Sylvio et al. (2010) classi-fied the sky and cloud pixels using Bayesian statistics meth-ods and Euclidean geometric distance (EGD) in a 3-D RGB color space. Kazantzidis et al. (2012) proposed a multi-color criterion method to detect cloud pixels also in a 3-D RGB space. The precision of all these traditional methods heavily depends on accurate RGB color information. Cloud detection in the circumsolar and near-horizon regions encounters great difficulties because of the influence of forward scattering and Mie scattering of aerosols, which makes these regions have similar brightness distributions to clouds. Long (2010) de-veloped a method applying a statistical analysis of images at least once per minute to correct the detection errors in these regions but, so far, the detection accuracy of clouds in these areas is still low.
In this paper, we analyze the imaging principle of color cameras and propose a new algorithm to automatically de-tect clouds within ground-based total-sky visible images. The imaging theory and band selection are described in Sect. 2. In Sect. 3, the cloud detection algorithm is introduced in de-tail. Several different types of partly cloudy total-sky images are analyzed to evaluate the validity of the proposed method in Sect. 4. Finally, a summary and suggestions for future re-search are given in Sect. 5.
Figure 1. Bayer grid (twice as many green pixels than red or blue
pixels) (Sakamoto et al., 1998).
2 Imaging principle and band selection
All total-sky images used in this paper were obtained with a TCI instrument, operating in Tibet (29.25◦N, 88.88◦E) from August 2012 to July 2014. The core component of TCI is an industrial digital camera with a fisheye lens, with a view an-gle of 185◦. The TCI device produces a color total-sky im-age every 5 min; however, most digital cameras use CCD or CMOS sensors to convert true scenes into electric signals, which distinguish light intensity with little or no wavelength specificity (Nakamura, 2005). In order to get color informa-tion, a color filter array (CFA) is placed over an image sen-sor’s light sensitive surface. The color filters filter the light by wavelength range by passing light of a specific wavelength and absorbing other wavelengths. The most commonly used color filter in photography is Bayer CFA, which comes from Bryce Bayer’s patent (1976). This filter pattern is composed of 50 % green, 25 % red, and 25 % blue, taking advantage of the human eye’s higher sensitivity to green light, and can be seen in Fig. 1.
Information a camera acquires after using CFA is called raw data, which needs to be converted to a full-color image by various demosaicing algorithms (Kimmel, 1999). Since the data are interpolated, they will inevitably introduce ad-ditional noise errors, meaning the color images we obtain from the cameras are not really true color. Each channel can be considered as an independent true signal with noise. To take 2-D red-to-blue bands methods as an example, the linear processing of red and blue signals result in the root-mean-square (RMS) sum of the noises, so 2-D red-to-blue band methods will inevitably increase the error for unsigned 8-bit images.
TCI R/B R-B (R-B)/(R+B)
0 200 400 600 800
0 50 100 150
D
igi
tal number
Pixel position red green blue
0 200 400 600 800
0 50 100 150 200 250
Digital number
Pixel position R/B R-B (R-B)/(R+B) green
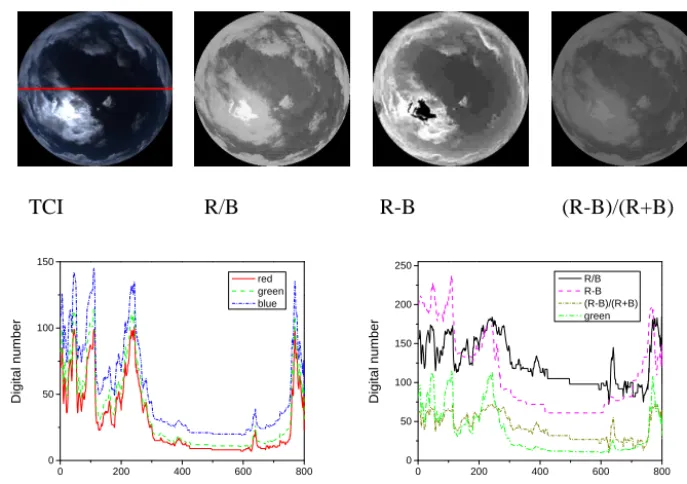
Figure 2. Brightness distribution for different channels.
plot the brightness distribution of RGB channels along a hor-izontal line (shown as a red line in the image) as the left panel of the bottom row in Fig. 2. It is easily understood that cloud pixels have higher brightness than sky pixels in the same or adjacent region in the RGB channels, and the brightness difference between clouds and sky is very large. When the sun is shadowed, the values of sky pixels should be relatively homogeneous, which can be seen from the pixel position 400 to 600 in the RGB channels brightness distri-bution. Next, we draw the luminance distribution of R/B,
R−B, and (R−B)/(R+B)results for the same horizontal position, shown in the right panel. For a better comparison, all these 2-D red-to-blue results are converted to unsigned 8-bit images. The results show that (1) 2-D red-to-blue meth-ods have more noises in the transition regions of clouds and sky, and (2) the brightness difference between clouds and sky becomes even smaller than the RGB channels.
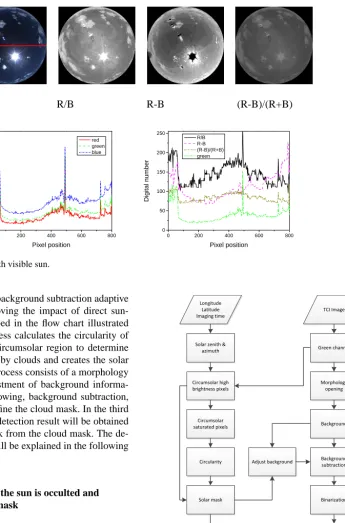
The same analysis has been done for another TCI image in which the sun is visible. Due to the forward scattering of the direct sunlight, those pixels close to the sun become brighter, which can be seen from the pixel position 300 to 600 in the RGB channels’ brightness distribution in Fig. 3. However, for those 2-D red-to-blue results, not only does their lumi-nance distribution have more noises, but the brightness dif-ference between cloud and sky also becomes smaller than the RGB channels due to interpolation effects.
More examples have been analyzed, and similar conclu-sions are drawn i.e., the traditional 2-D red-to-blue methods introduce additional noise, especially in the transition regions of clouds and sky, and the single red, green or blue channel is more suitable to detect cloud pixels from the partly cloudy
images. Considering the importance of the green channel in the CFA, we selected the green channel for the following processing in the proposed algorithm. Certainly, the color of sky images is determined by both imaging instruments and local atmospheric conditions, and a different white bal-ance scheme may produce a different color for the same sky. For most of the total-sky images, the color of thin clouds or cumulus appears white and their brightness values are very high, while the brightness values of some optically thick clouds may be lower than those in the clear sky regions. Combining multiple information, including theR/B band, may improve the accuracy of thick cloud identification.
3 Cloud detection algorithm for total-sky images 3.1 Overview
TCI R/B R-B (R-B)/(R+B)
0 200 400 600 800
0 40 80 120 160 200
D
igi
tal number
Pixel position red green blue
0 200 400 600 800
0 50 100 150 200 250
Digital number
Pixel position R/B
R-B (R-B)/(R+B) green
Figure 3. Same as Fig. 2 but with visible sun.
detecting clouds based on a background subtraction adaptive threshold method, and removing the impact of direct sun-light. The process is described in the flow chart illustrated in Fig. 4. The first sub-process calculates the circularity of the saturated pixels in the circumsolar region to determine whether the sun is obscured by clouds and creates the solar mask. The cloud detection process consists of a morphology opening operation, the adjustment of background informa-tion dependent on sun-shadowing, background subtracinforma-tion, and using AT methods to define the cloud mask. In the third sub-process, the final cloud detection result will be obtained by subtracting the solar mask from the cloud mask. The de-tailed steps of the GBSAT will be explained in the following subsections.
3.2 Determining whether the sun is occulted and calculating the solar mask
The position of the sun in the sky depends on both time and the geographic coordinates of the observer. To com-pute the sun’s position for a given time and a given longi-tude and latilongi-tude, we need to first calculate the sun’s posi-tion in the ecliptic coordinate system, then convert it to the equatorial coordinate system, and finally convert it to the horizontal coordinate system for the given local time and geographic position. Existing solar positioning algorithms can be divided into fast algorithms for general engineering and high-precision astronomical algorithms. Typical posi-tion algorithms of the sun include Spencer (1971), Michsky (1988) and the Plataforma Solar de Almería (PSA)
al-TCI Image
Green channel
Morphology opening
Background
Background subtraction Longitude
Latitude Imaging time
Solar zenith & azimuth
Circumsolar high brightness pixels
Solar mask
Result Adjust background
Cloud mask Circularity
Circumsolar saturated pixels
Binarization
Figure 4. Flow chart of the proposed algorithm.
gorithm (Blanco-Muriel et al., 2001). Meeus (1998) is repre-sentative of highly accurate astronomical algorithms.
22
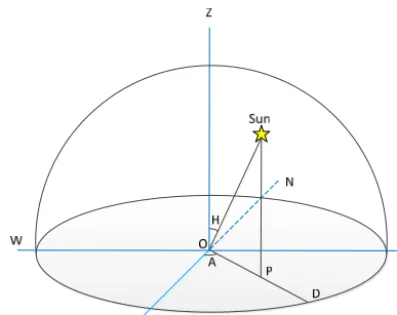
Figure 5. Schematic of fisheye imaging and position of the sun.
the schematic, W, E, S, and N represent west, east, south, and north directions, respectively. O is the center of the image. OZ represents zenith direction. P is the projection of the sun. OD is the radius of the fisheye image. H andArepresent solar zenith angle and azimuth. Here, the range of azimuth is from−180 to 180◦. The southern azimuth is zero, and from south to east is negative; from south to west is positive.
The fisheye lens in the TCI device adopts an angular pro-jection (also called a f-theta lens), which means the distance from the center of the image is proportional to the angle around the projection sphere (Schneider et al., 2009). Ac-cording to the imaging principle of f-theta lens, the following equations are applied to calculate the position of the sun in the TCI image:
X=Cx−OD×sinA×H /α (1)
Y =CY+OD×cosA×H /α, (2)
whereX andY are the central coordinates of the sun in the image;Cx andCY represent the central point of the image;
andαis the half of the angle of view of fisheye lens. The circumsolar region is assumed to be circular in the TCI images. Since the location of the sun in the coordi-nate system has been calculated, the circumsolar region can be determined by giving a radius in the TCI green channel. The high brightness pixels (HBP) can be obtained by set-ting a high threshold (such as 180) for the circumsolar region in the green image. Saturated pixels (brightness is close or equal to 255 in the unsigned 8-bit image) can also be ac-quired in the circumsolar region. Several works (Yang et al., 2014; Kazantzidis et al., 2012; Alonso et al., 2014) described how to determine whether the sun is occulted by combin-ing pyrheliometer measurements but, in most cases, mea-surement of direct radiation is not available. When there are no obstructions (i.e., clouds), the shape of the sun retrieval is roughly circular, so circularity is adopted in this paper to judge whether the sun is blocked by clouds. This circularity is computed for the circumsolar saturated pixels (CSP) using
the following equation (Montero and Bribiesca, 2009):
C=4×π×S/L2, (3)
whereCdenotes circularity,Sis the area of CSP, andL rep-resents perimeter of CSP. Higher values ofCimply situations where the possibility of the sun being occluded is low. A cir-cularity value of 1.0 means a perfect circle. In general, when
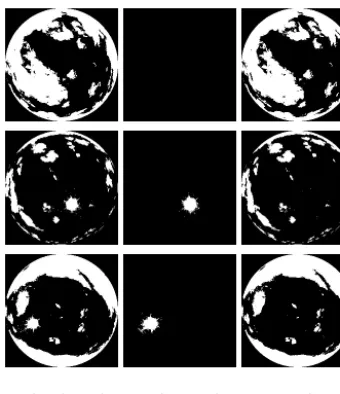
Cis greater than 0.3, the sun can be considered as visible. Figure 6 shows three cases for calculating the solar masks. The leftmost column shows the original TCI images, and the second column shows the corresponding green channels. The third and fourth columns show HBPs and CSPs, respectively. For the first row TCI image, the sun is occluded by the clouds and the circularity of CSP is very low, so the solar mask is set to empty. However, the values of circularity in the remaining two TCI images are relatively higher, which means the sun is not blocked and, thus, the solar masks are equal to the cir-cumsolar HBPs.
3.3 Computing cloud mask using modified background subtraction adaptive threshold
Due to the effects of direct solar radiation and scattering of aerosols and clouds, the background brightness is nonuni-form in the total-sky images (Long et al., 2006). The BSAT method can estimate background information from the total-sky images using a morphology opening operation, but the estimated background still has missing information, espe-cially in the circumsolar and near-horizon regions, where the forward scattering of the solar direct light makes it much brighter than the other regions in the total-sky image. On the other hand, a low solar elevation angle leads to greater aerosol scattering, which will increase the brightness in the near-horizon region.
The proposed method adopts the same idea as the BSAT method, but instead using a green channel with the morphol-ogy opening operation used to simulate background bright-ness (Yang et al., 2012). In mathematical morphology, there are two fundamental operations, dilation and erosion, which can be used to expand or shrink a setAby a structure element
E, respectively. The opening ofAbyEis given by the ero-sionAbyE, followed by the dilation of the resulting image byE. The opening operation can simulate background in-formation of a gray image by giving an appropriate structure element. In this study, the disk structure is adopted to get ac-curate sky background information. When the sun is visible in the images, the pixels in the circumsolar and near-horizon regions are brighter than the other regions in the green chan-nel. The simulated background is adjusted with the following equations:
ABG = BG×α (direct light region)
23
TCI Green HBP CSP Solar mask
Figure 6. Calculation of the solar masks.
ABG = BG×γ (near-horizon region)
ABG = BG (other region in the TCI image).
When the sun is blocked by clouds, the brightness values in the near-horizon region are still very high due to the impact of aerosols, while the thick clouds in the circumsolar region may be very dark. Thus, we adjust the simulated background based on the following equations in this condition:
ABG = BG/β (circumsolar region)
ABG = BG×γ (near-horizon region)
ABG = BG (other region in the TCI image),
where ABG denotes new background information after ad-justed, BG represents the background simulated using the morphology opening operation, andα, β, andγ are adjusted coefficients. In general, αis larger thanβ andγ. The radii of the direct light and circumsolar regions are predefined ac-cording to the imaging characteristics of the camera and fish-eye lens. The size of the near-horizon region mainly depends on the local climatology and weather.
An image of the homogeneous background can be ob-tained by subtracting the adjusted background from the green channel image. Figure 7 shows the intermediate process-ing results for each step of the proposed method. The first column shows the green channel, and the second column shows the simulated background information using mor-phology opening operation. The middle column shows the new background after adjusted brightness of circumsolar and near-horizon regions. For the image in the first row, we ad-justed the background brightness in the near-horizon region because the sun is occluded in this image. For the other two images in which the sun is visible, the background brightness is adjusted both in the circumsolar and near-horizon regions. Here, the adjusted coefficientαis set to 2, and bothβ and
γ are equal to 1.5. The fourth column shows the results of ABG subtracted from the green channel. The AT method is used to compute a threshold for the uniform background im-age and binarization processing is done to distinguish cloud
24
Green BG ABG Difference Cloud mask
Figure 7. Modified background subtraction using the green
chan-nel.
and sky pixels. The results of the cloud mask can be seen in the rightmost of Fig. 7.
3.4 Removing the impact of direct sunlight
When the sun is visible in the image, the influence of the direct light of the sun is a large source of errors for cloud detection. After getting the solar mask and cloud mask, the ultimate cloud detection result can be obtained by subtract-ing the solar mask from the cloud mask. The related cases are shown in Fig. 8. In the case of an occluded sun, the fi-nal cloud detection result is the same as the cloud mask be-cause the solar mask is empty. By removing the impact of direct sunlight, the obtained cloud detection results appear correct in a visual comparison. Due to the refraction of the light caused by the transparent protective cover, some bright spot noises in the TCI image are inevitable when the sun is visible; this phenomenon can be seen in the middle row of Figs. 7 and 8. It is very difficult to discriminate between these bright spot noises and cloud pixels because of their similar brightness distribution.
4 Results comparison
Five partly cloudy TCI images are taken as examples in order to evaluate the performance of the proposed algorithm. In this paper, the GBSAT results are compared with three traditional methods,R/B,R−B, and BSAT. Here, the fixed threshold 0.6 (Long et al., 2006) is adopted in theR/B method. The difference threshold 30 (Heinle et al., 2010) is given in the
cloud mask solar mask result
Figure 8. Removing the impact of direct sunlight.
The precision of the cloud detection can be evaluated by subjective human examination and objective quantitative comparison. To conduct a quantitative assessment, a standard cloud segmentation result should be obtained for each test image. However, it is difficult to get such a standard cloud segmentation result, which can only be obtained through an artificial sketch. Even if we can get such a standard result, it still depends heavily on the accuracy of manual transcrip-tion. So, in this paper, we compare the precision of different methods by human examination.
TheR/Bmethod clearly detects large amounts of cloud in the circumsolar region when the sun is visible in the images (see the first two rows of the second column). For some thin clouds,R/B method also fails to give correct detection re-sults (see the third row of the second column). These errors may be improved by using Long’s clear-sky limit methodol-ogy or statistical analysis method (Long et al., 2006, 2010). Of all these methods, the results of theR−Bmethod are the weakest. This may be an indicator that the fixed difference threshold is not suitable for TCI devices and local weather conditions. The results of the BSAT method are better than
R/B andR−Bmethods, but they still have some incorrect detection, especially in the circumsolar and near-horizon re-gions. The proposed GBSAT method obtains more satisfac-tory results in all these cases.
5 Conclusions
Two-dimensional red-to-blue band threshold methods histor-ically have been used extensively for cloud detection. How-ever, the imaging theory of cameras shows that the color ages we acquire from cameras are not really true color im-ages, which are obtained by interpolation from raw CFA data. These interpolations will inevitably introduce some noises
TCI R/B R-B BSAT GBSAT
Figure 9. Results comparison for different cloud detection methods.
into each channel and the use of 2-D red-to-blue bands meth-ods will amplify this noise, resulting in significant detec-tion errors, especially in the transidetec-tion regions of the sky and clouds. In actuality, the single red, green or blue channel is more suitable for cloud detection especially for partly cloudy images. Because there are twice as many green pixels as there are blue or red, meaning the green channel represents more real information, we select this channel for the proposed al-gorithm.
can find a corresponding clear image in which the sun posi-tion is very near or same as in the cloudy image. These two images should have not only very similar background bright-ness distributions, but also the same refractive noises. Thus, a more accurate cloud detection result can be taken by sub-tracting the clear background from the cloudy image directly.
Acknowledgements. The authors acknowledge the support from the National Natural Science Foundation of China (grant 41105121 and 41105122), the National Key Scientific Instrument and Equipment Development Projects of China (grant 2012YQ11020504), the Basic Research Fund of Chinese Academy of Meteorological Sciences, and the Science and Technology Research Foundation of SGCC, contract DZB17201200260.
Edited by: A. Lambert
References
Alonso, J., Batlles, F. J., Villarroel, C., Ayala, R., and Burgaleta, J. I.: Determination of the sun area in sky camera images using radiometric data, Energ. Convers. Manage., 78, 24–31, 2014. Bayer, B. E.: Color imaging array, US patent 3971065, 10 pp., 1976. Blanco-Muriel, M., Alarcon-Padilla, D. C., Lopea-Moratalla, T., Lara-Coira, M.: Computing the solar vector, Sol. Energy, 70, 431–441, 2001.
Calbó, J., and Sabburg, J.: Feature extraction from whole-sky ground-based images for cloud-type recognition, J. Atmos. Ocean. Tech., 25, 3–14, 2008.
Cazorla, A., Olmo, F. J., and Alados-arboledas, L.: Development of a sky imager for cloud cover assessment, J. Opt. Soc. Am. A, 25, 29–39, 2008.
Chow, C. W., Urquhart, B., Lave, M., Dominguez, A., Kleissl, J., Shields, J., and Waskom, B.: Intra-hour forecasting with a total sky imager at the UC San Diego solar energy testbed, Sol. En-ergy, 85, 2881–2893, 2011.
Ghonima, M. S., Urquhart, B., Chow, C. W., Shields, J. E., Cazorla, A., and Kleissl, J.: A method for cloud detection and opacity classification based on ground based sky imagery, Atmos. Meas. Tech., 5, 2881–2892, doi:10.5194/amt-5-2881-2012, 2012. Heinle, A., Macke, A., and Srivastav, A.: Automatic cloud
classi-fication of whole sky images, Atmos. Meas. Tech., 3, 557–567, doi:10.5194/amt-3-557-2010, 2010.
Huo, J. and Lu, D.: Cloud determination of all-sky images under low visibility conditions, J. Atmos. Ocean. Technol., 26, 2172– 2180, 2009.
Johnson, R. W., Koehler, T. L., and Shields, J. E.: A multi-station set of whole sky imagers and a preliminary assessment of the emerging data base, Proc. Cloud Impacts on DOD Operations and Systems workshop, Silver Spring, MD, Department of De-fense, 159–162, 1988.
Johnson, R. W., Hering, W. S., and Shields, J. E.: Automated visibil-ity and cloud cover measurements with a solid-state imaging sys-tem, University of California, San Diego, Scripps Institution of Oceanography, Marine Physical Laboratory, SIO89-7, GL-TR-89-0061, 1989.
Economou, G.: Cloud detection and classification with the use of whole-sky ground-based images, Atmos. Res., 113, 80–88, 2012. Kimmel, R.: Demosaicing: Imaging reconstruction from color CCD
samples, IEEE T. Image Process., 8, 1221–1228, 1999. Klebe, D. I., Blatherwick, R. D., and Morris, V. R.: Ground-based
all-sky mid-infrared and visible imagery for purposes of char-acterizing cloud properties, Atmos. Meas. Tech., 7, 637–645, doi:10.5194/amt-7-637-2014, 2014.
Koehler, T. L., Johnson, R. W., and Shields, J. E.: Status of the whole sky imager database, Proc. Cloud Impacts on DOD Op-erations and Systems, El Segundo, CA, USA, Department of De-fense, 77–80, 1991.
Kokhanovsky, A. A.: Cloud optics, Atmospheric and oceanographic sciences library, 34, Springer, Dordrecht, the Netherlands, 276 pp., 2006.
Li, Q., Lu, W., and Yang, J.: A hybrid thresholding algorithm for cloud detection on ground-based color images, J. Atmos. Oceanic Technol., 28, 1286–1296, 2011.
Long, C. N.: Correcting for circumsolar and near-horizon errors in sky cover retrievals from sky images, Open Atmos. Sci. J., 4, 45–52, 2010.
Long, C. N. and Deluisi, J. J.: Development of an automated hemi-spheric sky imager for cloud fraction retrievals, Proc. 10th Symp. on meteorological observations and instrumentation, Phoenix, Arizona, USA, 11–16 January, 171–174, 1998.
Long, C. N., Sabburg, J. M., Calbo, J., and Pagès, D.: Retrieving cloud characteristics from ground-based daytime color all-sky images, J. Atmos. Oceanic Technol., 23, 633–652, 2006. Meeus, J.: Astronomical algorithms, Second ed, Willmann-Bell
Inc., Virginia, USA, 477 pp., 1998.
Michalsky, J. J.: The astronomical Almanac’s algorithm for ap-proximate solar position (1950–2050), Sol. Energy, 40, 227–235, 1988.
Montero, R. S. and Bribiesca, E.: State of the art of compactness and circularity measures, International Mathematical Forum, 27, 1305–1335, 2009.
Morris, V. and Klebe, D.: A demonstration of the Solmirus all sky infrared visible analyzer, Poster presented in ASR Science Team Meeting, 15–19 March, Bethesda, Maryland, USA, p. 1, 2010. Nakamura, J.: Image Sensors and Signal Processing for Digital Still
Cameras, CRC Press, Boca Raton, USA, ISBN: 978-0-8493-3545-7, 350 pp., 2005.
Pfister, G., McKenzie, R., Liley, J., and Thomas, A.: Cloud cov-erage based on all-sky imaging and its impact on surface solar irradiance, J. Appl. Meteorol, 42, 1421–1434, 2003.
Sakamoto, T., Nakanishi, C., and Hase, T.: Software pixel interpo-lation for digital still cameras suitable for a 32-bit MCU, IEEE T. Consum. Elect., 44, 1342–1352, 1998.
Schneider, D., Schwalbe, E., and Maas, H.: Validation of geometric models for fisheye lenses, ISPRS J. Photogramm., 64, 259–266, 2009.
Shields, J. E., Johnson, R. W., and Koehler, T. L.: Automated whole sky imaging systems for cloud field assessment, in: Fourth symposium of global change studies, 17–22 January, American Meteorological Society, Boston, Massachusetts, USA, 228–231, 1993.
state in high-latitude regions by a ground-based digital camera, J. Atmos. Oceanic Technol., 23, 437–447, 2006.
Spencer, J. M.: Fourier series representation of the position of the sun, Search, 2, 172 pp., 1971.
Sylvio, L. M. N., Wangenheim, A. V., Pereira, E. B., and Co-munello, E.: The use of Euclidean geometric distance on RGB color space for the classification of sky and cloud patterns, J. At-mos. Oceanic Technol., 27, 1504–1517, 2010.
Tapakis, R. and Charalambides, A. G.: Equipment and methodolo-gies for cloud detection and classification: A review, Sol. Energy, 95, 392–430, 2013.
Yamashita, M., Yoshimura, M., and Nakashizuka, T.: Cloud cover estimation using multitemporal hemisphere imageries, in: IS-PRS, XXXV Part B7, Commission VII, 12–23 June, Istanbul, Turkey, 2004.
Yang, J., Lu, W., Ma, Y., Yao, W., and Li, Q.: An automatic ground-based cloud detection method ground-based on adaptive threshold, J. Appl. Meteor. Sci., 20, 713–721, 2009 (in Chinese).
Yang, J., Lu, W., Ma, Y., and Yao, W.: An automated cirrus cloud detection method for a ground-based cloud image, J. Atmos. Oceanic Technol., 29, 527–537, 2012.