BANK MERGERS AND SHAREHOLDER VALUE
CREATION IN INDIA
Aasif Shah♣ Pondicherry University, India
Malabika Deo
Pondicherry University, India
♣ Corresponding author: Ph.D Candidate in Department of Commerce, School of Management Pondicherry University-India. Email: shah_aasifpu@rediffmail.com. Phone: +91-8122263418
ABSTRACT
The study attempts to examine the impact of merger events on the stock price behavior of acquirer as well as the target shareholders in the Indian banking industry. OLS Market Model and Constant Market Model were applied to study a sample of (17) merger announcements both by Private and Public sector banks. The results demonstrate that merger announcements in Indian banking sector have no significant impact on bidder portfolio. However for target banks, interesting results have been emerged. None of the average CAR appeared statistically significant when Global Trust Bank (GTB), a loss making bank is included in the overall target portfolio. However, the average CAR changes immediately to significant positive returns in all the run-up windows when the same bank is expelled from the target sample. Further the study documented the negative abnormal returns for most of combined private sector banks.
Keywords: Abnormal Return, Market Model, Constant Market Model
1. PRELUDE
of India highlighted the need of reshuffling the Indian banking system with an aim to improve the credit delivery but the Narasimham Committee (1991) emphasized on convergence and consolidation to make the size of Indian commercial banks comparable with those of globally active banks. Based on recommendations of Narasimham Committee, the Government of India has adopted the route of mergers among others with a view to restructure the banking system. Many small and weak banks have been merged with other banks mainly to protect the interests of depositors. Since then, Indian banking sectorhas witnessed unprecedentedtransformation through M&As.
2. REVIEW LITERATURE1
In this section, an attempt has been made to synthesize some of the important past empirical studies in order to get a clear insight as to how the academic research has made important pragmatic contributions that through light on important corporate policy issues. Before highlighting a specific literature on bank mergers, it is important to present some influential contributions on short-term merger event studies in broad-spectrum. The most prominent contribution includes the work of Dodd and Ruback (1977) who observed that prior to the tender offers, stockholders of bidding firms earn significant positive abnormal returns. Dodd (1980) showed a positive reaction to the first public announcement of the merger proposal and also a positive reaction to the approval of completed proposals and but negative reaction to cancelled proposals. Jensen and Ruback (1983) concluded that on average bidders gain about 3.8% in tender offers and obtain approximately zero in mergers whereas targets gain roughly 29%. P. Asquith (1983); Bradley, Desai and Kim (1983); Franks and Harris (1989); Penas and Unal (2004) and Ben-Amar and Andre (2006) reported positive wealth effects of bidder shareholders. While as Lang et al. (1989); Smith and Kim (1994); Holl and Kyriazis (1997) and Sudarsanam and Mahate (2003) showed negative abnormal returns for bidder shareholders. Over the long term post announcement period Fuller et al. (2002) and Gregory and Mc-Corriston (2005) found that bidder shareholders gain in long run. On the other hand Leeth and Borg (2000) results confirmed that target firm shareholders earn positive abnormal returns. However, evidence indicates that target shareholder earn significantly positive abnormal returns in the days around M&A announcements. For example, for a sample of 1814 US takeovers in the period 1975-1991, Schwert (1996) found abnormal returns to shareholder of target firms of 10.1 %, whereas, Jarrell & Poulsen (1989), reported return to the target equal to 28.99% when examining a sample of 526 transactions of US companies between 1963 and 1986. A similar pattern is observed in Franks & Harris (1989) sample of 1898 UK targets in the period 1955-1985, with a significant return of 23.3%. More recently, Goergen & Renneboog (2004) supported those findings for European transactions, reporting a significant abnormal return of 9.01% to target shareholders.
In the Indian counterpart, Mishra and Goel (2005), examined the financial implications of RIL-RPL merger and showed that positive excess return occurred to the shareholders of the target company (RPL) and vice versa. Selvam et al., (2010) analysed 17 manufacturing companies which have undergone M&As during 2000, 2001 & 2002 but did not found any significant returns to the acquiring companies. Deo and Shah (2011) studied 28 merger announcements in IT industry and found that bidder shareholders wealth is unaffected due to merger announcements while as target shareholders earn significantly from such deals. Table-1 (Section-I) as given below documents some important studies on bank merger activities that focuses on relatively short time periods of 5-year intervals in the early to mid-1980s. Only Houston and Ryngaert (1994, 1997) extended their work past 1986 with studies
1 The most cited studies on short term market response to merger announcements have been incorporated in ‘review literature section’
covering (1985–1991) and (1985–1992). In addition, Cybo-Ottone & Murgia (2000) studied a period from (1988-97) although later Sharma (2009) covered the study from 2000 onwards. The table demonstrates that many of these studies have relatively small sizes. Trifts and Scanlon (1987) examined 21 mergers over 4 years, while Neely (1987) studied 26 acquisitions over 7 years and James and Wier (1987) examined 60 out of 264 potential acquisitions over a 9-year period. The table further shows that there is some variations in analysis across these studies. For example, James and Wier (1987) focus only on bidder returns while the others examine returns to both targets and bidders. In addition, only Houston and Ryngaert (1994), Cybo-Ottone & Murgia (2000) provide results of the combined firms’ returns. While these studies found that returns to targets range from 9.66% (Cornett and De, 1991) to 36.22% Neely (1987), the abnormal returns of bidder banks range from -3.25% to +3.12%. No negative returns were reported for combined bidder portfolio. Similarly, Section 2 summarizes short-term merger event related studies in Indian context. In particular, the study period of these studies ranges from 1999-12. The table shows both positive and negative abnormal returns for bidders. While Anand and Singh (2008) found positive effects of merger events on private bidder and target banks and also for their combined wealth, Venkatesan & Govindarajan (2011) also demonstrate that acquisition activities of public sector banks have a significant positive impact on their shareholders’ wealth. Further Chandra (2012) reveals positive effects of the event on target/combined shareholders wealth but report thenegative impact on bidder portfolio. On the other hand Sikarwar (2012) shows the mixed effects of merger events on targets shareholders. The study did not examine the bidder/combined shareholders wealth dilution effect.
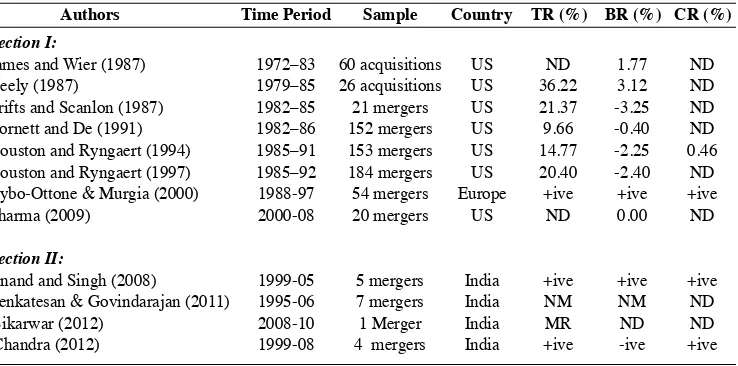
Table 1: Empirical Review Literature of Bank M&As from Overseas & India2
CR (%) BR (%)
TR (%) Country
Sample Time Period
Authors
Section I:
James and Wier (1987) 1972–83 60 acquisitions US ND 1.77 ND
Neely (1987) 1979–85 26 acquisitions US 36.22 3.12 ND
Trifts and Scanlon (1987) 1982–85 21 mergers US 21.37 -3.25 ND
Cornett and De (1991) 1982–86 152 mergers US 9.66 -0.40 ND
Houston and Ryngaert (1994) 1985–91 153 mergers US 14.77 -2.25 0.46
Houston and Ryngaert (1997) 1985–92 184 mergers US 20.40 -2.40 ND
Cybo-Ottone & Murgia (2000) 1988-97 54 mergers Europe +ive +ive +ive
Sharma (2009) 2000-08 20 mergers US ND 0.00 ND
Section II:
Anand and Singh (2008) 1999-05 5 mergers India +ive +ive +ive
Venkatesan & Govindarajan (2011) 1995-06 7 mergers India NM NM ND
Sikarwar (2012) 2008-10 1 Merger India MR ND ND
Chandra (2012) 1999-08 4 mergers India +ive -ive +ive
2 Notes: This table provides an overview of the results of nine event studies on bank mergers. Authors, time period, number of
3. RATIONALE OF THE STUDY
Based on the most repeatedly cited studies of shareholder wealth effects to merger events in banking industries (Table 1), few points could be underlined. First Table-1 (Section-I), which summarises the review literature of overseas bank mergers demonstrates that much evidence has already been found in relation to shareholders wealth effects to merger announcements although the results varies from study to study. The time period and sample size of these studies on average are significant enough to draw conclusions though not the end results. But based on the review literature summary from Section 2, it is argued that the event studies of bank mergers in India are not enough nor the sample sizes are justifiable to draw broader conclusions. No such study has been observed on event studies covering mergers events from overall banking sector in India. The earlier studies have failed to categorize the impact of merger events on separate sections of banking industry. For example, even the most referred work of Anand and Singh (2008) in their study have mixed the announcement impact of nationalized bank Viz. Oriental Bank of Commerce with the rest of four private sector banks in their sample. It would have been interesting to see the combined abnormal returns of bidder banks with and without the inclusion of the Oriental Bank of Commerce. Sikarwar (2012) found both positive and negative returns for bidder shareholders in their study of examining one merger announcement. Venkatesan & Govindarajan (2011) had also limited their work by analyzing merger events to public sector banks. The authors conclude that the acquisition activities of the public sector bank in India have created additional wealth to their shareholders. Chandra (2012) documented positive returns for all bidder, target as well as combined shareholders. Thus, Section 2 clearly highlights that there is much work undone in this particular industry. Given the limitations and scope of earlier studies, the present study is therefore an attempt to seek new evidence concerning shareholders wealth effects vis-à-vis merger information release in Indian banking industry. The paper is an earliest attempt at analyzing stock price reaction to merger information release both by private and public sector banks in Indian counterpart and thus providing useful inputs to investors, corporate managers, researchers as well as policy makers.
4. DATA AND SAMPLE SELECTION
announcements by nationalized banks have been categorized under public sector commercial banks for analysis purpose since both groups are controlled by the government directly or indirectly. In our sample all bidder banks targeted those banks only which are operating in their respective industries. Nevertheless, there is one instance where nationalized bank Oriental Bank of Commerce has targeted a private bank Global Trust Bank3. Effort have been
made to study this particular case separately apart from pooled analysis of bidder and target portfolio. So called, standard event study methodology has been employed to measure the effect of an event in relation to stock prices of the firms. The major interest in an event study is the abnormal return, which is the deviation of the actual return from the predicted or expected return.
In order to carry out an event study, the researcher need to define an ‘event window’. The placement of the event window is of critical importance to measure the market reaction correctly. A window that is too narrow could miss the impact of the event, while a window that is too wide will introduce noise and likely to misguide the analysis towards finding no statistically significant abnormal return see for example (Kothari and Warner 2004). The size length of the event window has to be justified (Fama 1998). The study examines three symmetric event windows: a three day (-1, +1), five-day (-2, +2) and eleven days (-5, +5) event window. These window lengths are appropriate to capture any news that might have leaked shortly.
Similarly the estimation period is used to estimate the expected returns of the stocks. Typically, the period needs to be long enough to create a representative measure of returns but too long and estimation period can risk biasing the estimation with information from other events or
3 Global Trust Bank was one of the leading private sector banks in India. Owing to prolong financial debt, the company merged its
operation with Oriental Bank of Commerce in 2004. The fall of the banking entity began in the early 2000s. The Reserve Bank of India’s (RBI) probe revealed irregular financial disclosures As Global Trust Bank collapsed; RBI announced its merger with the Oriental Bank of Commerce (OBC). The bank took all the assets and liabilities of GTB, along with its 104 branches, 275 ATMs and a workforce of over 1400 employees. However, according to the merger deal, GTB’s shareholders would not get OBC shares. OBC benefited hugely, as its network and customer base expanded. It also earned tax benefits due to GTB’s large amount of investment in non-performing assets (NPAs). The deal was equally beneficial for GTB depositors, as they could now enjoy the trust of a public sector bank. However, the Global Trust Bank saga created an environment of suspicion against private sector banks. This became one of the reasons for the immense success of public sector banks in India.
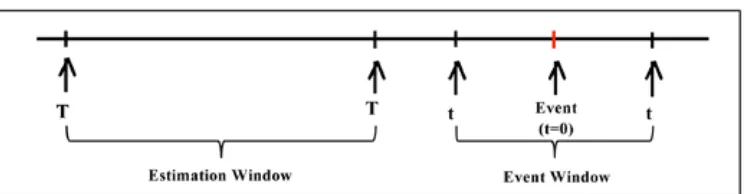
Figure 1: Event Window and Clean Estimation Period
Notes: Estimation window in this study comprise of 240 days prior to event date and event window
changes in the firms general condition. It is normally set at around a year of trading prior to the event window. But the choice of the estimation period is arbitrary. Brown and Warner (1980) have used 35 months as the estimation period, while Renneboog (2006) used 240 days. In this paper it is set to 240 trading days prior to the event date and the eleven days event window are kept separate from the estimation period. This is done to make sure that the normal returns don’t get influenced by event related returns.
5. METHODOLOGY
The present work has been carried out as an event study project. According to Serra (1999), event studies start with the hypothesis about how a particular event affects the value of a firm. The hypothesis that the value of the company has changed will then be translated in the stock showing an abnormal return. The logic behind the event study methodology (within the specific context of mergers) is explained in Warren-Boulton and Dalkir (2001): Investors in financial markets bet their dollars on whether a merger will raise or lower prices. A merger that raises market prices will benefit both the merging parties and their rivals and thus raise the prices for all their shares. Conversely, the financial community may expect the efficiencies from the merger to be sufficiently large to drive down prices. In this case, the share values of the merging firms’ rivals fall as the probability of the merger goes up. Thus, evidence from financial markets can be used to predict market price effects when significant merger-related events have taken place.
5.1. The OLS Market Modeland Constant Market Model
Much of the event study literature is based on OLS Market Model relating the return on an individual asset to the return on a market index and an asset specific constant. The most common model for event studies is the 'Market Model' (Mackinlay, 1997). The study uses both OLS Market Model (henceforth MM) and Constant Market Model (henceforth CMM), for testing of the existence of abnormal returns for acquirer and acquired banking companies. According to Brown and Warner (1985), in case of short term analysis, the CMM and the MM give similar results. Concentrating on short term impact, the method of calculation of abnormal return does not impact its robustness. The mere difference between these two models is the coefficients of alpha and beta which are assumed 0 and 1 under CMM but are estimated under Sharpe’s (1963) MM. In order to observe short term and immediate effects of information, daily stock price data has been considered. Sometimes information affects the stock on same day. But if the market is not informationally efficient then it may affect after one day, two days, and three days. This insight is not available with monthly or weekly data see for example Khilji (1993) for detailed discussion. The daily actual rate of return is calculated as:
(1)
The Beta value is the slope coefficient obtained by regressing the stock returns to the market index returns. It is defined as:
Riᴛ and Rmᴛ are the return in event period ᴛ for security i and the market respectively.
Similarly, Rmt = Return to the market5 (BSE 500 Index in this study) at time t
Given the parameters of equation 1and equation 2, one can estimate the abnormal returns as follows.
(2)
Rit = αi + βi Rmt + εit
Where, E (εit = 0), Var (εit ) = σ 2 εit and
ˆβi = T1
ᴛ =
∑
T0 +1 ˆ(Riᴛ– μi) )(Rmᴛ– μm ˆ )
÷
T1ᴛ
∑
– T0 +1ˆ
(Rmᴛ –μm )2
ˆαi = ˆμi – ˆβi μˆm Where, μˆi = 1/ L1 T1
ᴛ =
∑
T0 +1ˆμm = 1/ L
T1
ᴛ =
∑
T0 +1 RmᴛRiᴛ
(3)
ARit = Rit – αˆi – βˆi Rmt
Under CMM, the abnormal returns are calculated by using following equation.
(4)
ARit = Rit – (E (Rmt) )
4 Returns from daily stock price of sample banks denotes dependent variable and similarly returns from market index – BSE-500
denotes an independent variable for OLS regression purpose under market model.
5 The BSE-500 Index represents nearly 93% of the total market capitalization on BSE and covers all 20 major industries of the
economy. Moreover, it represents 70% of the total turnover on the BSE. Where, Rmt = Daily actual returns.
Where Pit = is the stock price4 of firm i on day t and P
The abnormal returns of individual security are averaged for each day surrounding the event day i.e., 5 days before and 5 days after the event day. The following model is used for computing the Average Abnormal Return.
The abnormal returns need to be accumulating over different run-up windows. It gives an idea about average stock price behavior over time. The model used to ascertain CAAR6 is:
(5)
AARit = N
i =1
∑
ARit / N(6)
CAARt = N i =1
∑
AARit where t= -5, =5The combined returns are estimated as follows:
(7)
Combined CAR = (ARbi *MEbI + ARti *MEti) / (MEbi + MEti)
6 The accumulation of the daily abnormal returns over the time period under observation is the CAR. The term CAR (-5, 0) means
the CAR calculated from five days before theannouncement to the day of announcement. The CAR(-1, 0) is a control premium, although Merger stat generally uses the stock price five days before announcement rather than one day before announcement as the denominator in its control premium calculation. However, the CAR for any period other than (-1, 0) is not mathematically equivalent to a control premium.
7 Parametrictest’ is used to assess significance of AARs and CAARs. The 1%, 5% and 10% level of significance with appropriate
degree of freedom would be used to test the supposition of no significant abnormal Returns after the event day. The cumulative average abnormal return provides information about the average price behavior of securities during the event window If markets are efficient, the AARs and CAARs should be close to zero.
(8)
TtestAAR = AAR/[S(AAR) / N )] and
√
TtestCAAR = CAAR/[S(CAAR) / N )]
√
Where MEbi and MEti indicates market value of equity one month before the month in which the deal has been announced; and ARbi and ARti are residual of bidder bank and target bank respectively on day i.
The conclusions would be based on the results of parametric t values7 on AARs and CAARs
for the during pre and post merger announcement days. The t test statistics for AAR and CAAR for each day during the event window is calculated as:
(9)
8 We do not report the daily AAR and CAAR of sample Banks. The main reason is to save the space. However, full results are
available on request from the corresponding author.
6. RESULTS AND DISSCUSSIONS8
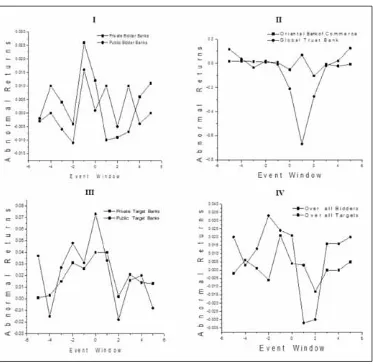
Figure 2: Plots from I to IV represent daily Average Abnormal returns of Sample Banks
Note: Graph I and Graph II demonstartes intersting state of affairs. While the curve of public bidder
Table 2: Average CAR of Private Bidder and Target Commercial Banks Targets Obs. 07 Bidders Obs. 09
Event Window
t stat
(-1,+1) 0.028 1.088 0.027 1.030 0.106 1.472* 0.099 1.418
(-2,+2) 0.015 0.727 0.013 0.588 0.139 1.465* 0.128 1.383
(-5,+5) 0.036 1.041 0.032 0.930 0.207 1.244 0.192 1.168
t-stat t-stat
t-stat CMM MM CMM
MM
Notes: *, **, *** Significant at 10%, 5%, 1% level respectively, MM and CMM denotes Market Model
& Constant Market Model.
Using equation 6, we estimate average CAR for sample banks. Further with the help of equation 9, the values of t-stat are reported separately for each of the average CAR under different run-up windows. Table 2 presents a glimpse of average cumulative abnormal returns for both private bidder as well as private target commercial banks. As is evident from the table that private bidder portfolio appeared statistically insignificant for all the given run-up windows implies that acquirer shareholders in the private sector banks in India neither gains nor losses to merger events. Nevertheless private target commercial banks earn a significant return in two and five day’s run-up window under MM.
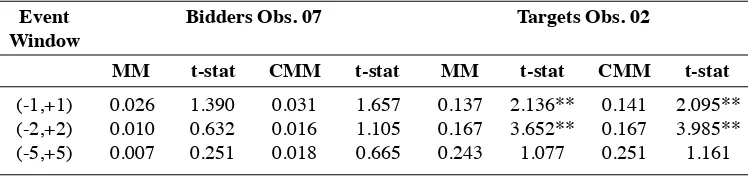
Table 3: Average CAR of Public Bidder and Target Commercial Banks Targets Obs. 02 Bidders Obs. 07
Event Window
t-stat
(-1,+1) 0.026 1.390 0.031 1.657 0.137 2.136** 0.141 2.095**
(-2,+2) 0.010 0.632 0.016 1.105 0.167 3.652** 0.167 3.985**
(-5,+5) 0.007 0.251 0.018 0.665 0.243 1.077 0.251 1.161
t-stat t-stat
t-stat CMM MM CMM
MM
Notes: *, **, *** Significant at 10%, 5%, 1% level respectively, MM and CMM denotes Market Model
& Constant Market Model.
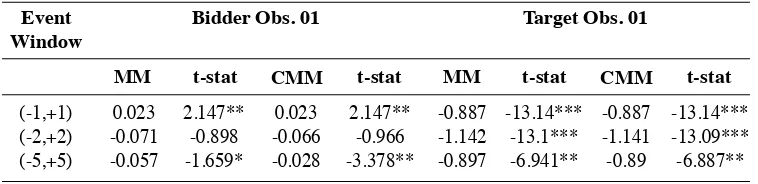
Table 4 shows cumulative abnormal returns for both Oriental Bank of Commerce and Global Trust bank. As is apparent from the above table, the shareholders of OBC appeared to be winners in three days run- up windows, but end up with negative returns in the eleven days of time interval. On the other hand, the negative and statistically significant return is observed in all the run- up windows for GTB indicate by and large that the merger deal completely ruined the wealth of its shareholders
Table 4: CAR of Nationalized Bidder and Private Target Commercial Bank Target Obs. 01 Bidder Obs. 01
Event Window
t-stat
(-1,+1) 0.023 2.147** 0.023 2.147** -0.887 -13.14*** -0.887 -13.14***
(-2,+2) -0.071 -0.898 -0.066 -0.966 -1.142 -13.1*** -1.141 -13.09***
(-5,+5) -0.057 -1.659* -0.028 -3.378** -0.897 -6.941** -0.89 -6.887**
t-stat t-stat
t-stat CMM MM CMM
MM
Notes: *, **, *** Significant at 10%, 5%, 1% level respectively, MM and CMM denotes Market Model
& Constant Market Model.
Table 5: Overall Average CAR for Bidder and Target Commercial Bank
Notes: *, **, *** Significant at 10%, 5%, 1% level respectively, MM and CMM denotes Market Model & Constant
Market Model.
Targets Obs. 09 (When GTB is excluded) Targets Obs. 10
(When GTB is included) Bidders Obs. 17
EW
t stat t-stat
t-stat
-1,+1 0.027 1.773* 0.028 1.846* 0.013 0.117 0.009 0.082 0.113 2.008** 0.109 1.973** -2,+2 0.008 0.603 0.009 0.704 0.016 0.114 0.009 0.063 0.145 1.990** 0.137 1.917** -5,+5 0.019 0.851 0.023 1.082 0.104 0.638 0.095 0.595 0.215 1.621* 0.205 1.566*
t-stat t-stat
t-stat CMM MM CMM MM CMM
MM
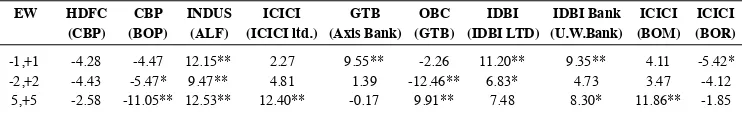
The vast majority of evidence finds that, on average, the combined return to M&As is positive (Weston et al., 2005). The reason for positive returns is largely due to the fact that target shareholder returns are significantly high. The acquiring company shareholders on the other hand tend to experience either normal returns or significant losses at the announcement date of a merger or acquisition (Alexandridis et al., 2010). Using equation (7) under MM, cumulative abnormal returns are estimated for combined firm. Table 6 highlights that the maximum positive returns have been earned by the shareholders of Indus bank ltd. and Ashok Leyland finance as is evident from different time period intervals. In contrast, banks that are associated with significantly negative returns comprise Centurion Bank of Punjab vs. Bank of Punjab, Oriental Bank of Commerce vs. Global Trust bank and also ICICI bank vs. Bank of Rajasthan. However, the deal of Oriental Bank of commerce and global trust bank has destroyed the wealth of their shareholders to a greater level. These banks together have lost millions of rupees surrounding the days of merger announcement. It is worth to mention here that positive synergic implications are not found by and large with private sector banks. These findings are partially in agreement with theories based on agency costs of free cash flow and managerial entrenchments which argue that mergers wipe out the wealth and predict that the combined returns from a merger will be unconstructive. In our case, the reasons that could explain the negative returns of combined firm may be the phenomenon of forced mergers. For example, Oriental Bank of Commerce Vs Global Trust Bank, ICICI Vs Bank of Rajasthan fall under the categories of forced mergers and hence destroyed shareholder value as a whole.
7. CONCLUSION
The process of economic integration and the deregulation of economic activities in India have stimulated a significant restructuring of companies. While the number of M&A transactions involving firms from the overseas increased at a more rapidly rate during the last decade, most of this upsurge was due to domestic mergers. This study sought to make a contribution to the event study literature by exploring the short term effects of M&As in Indian banking sector. The findings support prior research Wall and Gup (1989), Hawawini and Swary (1990), Houston and Ryngaert (1994), Madura and Wiant (1994), and Hudgins and Seifert (1996) which indicated that a majority of merger-related wealth generation in banking industry is
Table 6: Cumulative Abnormal Returns for Combined Portfolio9
Notes: *, **, *** Significant at 10%, 5%, 1% level respectively, MM and CMM denotes Market Model & Constant
Market Model.
ICICI (BOR) IDBI Bank
(U.W.Bank) OBC
(GTB) ICICI
(ICICI ltd.) HDFC
(CBP) (BOP)CBP INDUS (ALF) (Axis Bank)GTB (IDBI LTD)IDBI (BOM)ICICI EW
-1,+1 -4.28 -4.47 12.15** 2.27 9.55** -2.26 11.20** 9.35** 4.11 -5.42* -2,+2 -4.43 -5.47* 9.47** 4.81 1.39 -12.46** 6.83* 4.73 3.47 -4.12 5,+5 -2.58 -11.05** 12.53** 12.40** -0.17 9.91** 7.48 8.30* 11.86** -1.85
9 Acronyms CBP indicate-Centurion Bank of Punjab, BOP-Bank of Punjab, ALF-Ashok Leyland Finance, GTB-Global trust bank,
received by shareholders of target firms. While on the other hand, both private and public bidder banks generate no positive or negative abnormal returns when analyzed independently. However, on the whole, significant positive returns have been observed in three days run-up window. These results srun-upport the work of Bradley, Desai and Kim (1983); Penas and Unal (2004) who report positive financial implications of mergers for acquirer shareholders. In particular, the findings of this study document interesting although not surprising results. First, it is shown that there is no relationship between merger announcements and the bidder shareholders wealth of public and private sector banks independently. Second, no significant association has been observed between merger events and the bidder shareholders wealth on the whole. These results contradicts with the findings of Anand and Singh (2008) and Chandra (2012) who report positive and negative bidder effects respectively for private and public banks. Our findings further illustrate that how a stability of a target bank plays a vital role at the time of its consolidation. For instance, Global Trust Bank which was suffering profoundly and thus not only ruined the wealth of its shareholders at the time of its merger announcement with Oriental Bank of Commerce but also offsets the gain of other target shareholders in the sample. On the other hand, unlike the public bidder and target banks, the combined wealth of most of private bidder and target banks suffer slightly. These finding are again in contrast with the study of Anand and Singh (2008) who report positive merger effects on the total wealth of shareholdersin the private banking industry. In particular, our results demonstrate that bidding banks at least do not suffer any loss and thus implies that M&As are not a risky investment for the shareholders of those banks. On the other hand, Shareholders of target banks enjoy a significant abnormal return. They earn a high cumulative abnormal return around the announcement days which is in line with the Hubris theory. The study provides evidence that shareholders of target banks must maximize their means during the announcement of mergers. In this period they act as "profit takers" because the value of their firms are very high (Hubris theory) and hence, they are capable to enjoy greater gains. Thus the implications are enormous for both foreign as well as local investors who make their decision based on current market values and expected risk-return tradeoffs that are associated with their investments. The study also documented that MM and CMM (Models) have performed in a similar way most of the times. This confirmation validates the findings of Brown and Warner (1985), who proposed that in case of short term analysis, the CMM and the MM give similar results. The future research may be directed to examine the effect of acquisition and takeover deals. One can broaden the scope of the study by examining the cross border merger announcements and other corporate actions. Even announcement impact of reverse mergers would make a great sense so as to have adequate evidence of stock price reaction and also market efficiency concerning Indian capital markets.
ACKNOWLEDGEMENT
REFERENCES
Alexandridis, G., Petmezas, D., & Travlos, N. (2010). Gains from mergers and acquisitions around the world: New evidence. Journal of Financial Management, 39, 1671-1695 Anand, M., & Singh, J. (2008). Impact of Merger Announcements on Shareholders Wealth:
Evidence from Indian Private Sector Banks. Vikalpa: Journal for Decision Makers,
33(1), 35-54.
Andrade, G., Mitchell, M., & Stafford, E. (2001). New evidence and perspectives on mergers.
Journal of Economic Perspectives, 15(2), 103-120
Asquith, P. (1983). Merger bids, uncertainty, and stockholder returns. Journal of Financial
Economics,11(1-4), 51-83.
Beena, P. L. (2004). Towards Understanding the Merger Wave in the Indian Corporate Sector:
A Comparative Perspective. Centre for Development Studies, Trivendrum Working
Paper No. 355.
Ben Amar, W., & Andre. P. (2006). Separation of ownership from control and acquiring firm performance: The case of family ownership in Canada. Journal of Business Finance and
Accounting, 33, 517–543.
Berkovitch, E., & Narayanan, M. P. (1993). Motives for Takeovers: An Empirical Investigation.
Journal of Finance and Quantitative Analysis, 28(3), 347-362.
Bradley, M., Desai, A., & Kim, E. H. (1983). The rationale behind inter firm tender offers: Information or Synergy. Journal of Financial Economics, 11, 183-206.
Brown, S. J., & Warner, J. B. (1980). Measuring security price performance. Journal of
financial Economics, 8, 205-258.
Brown, S. J., & Warner, J. B. (1985). Using daily stock returns: The case of event studies.
Journal of Financial Economics, 14, 3-31.
Chandra, S. (2012). Are mergers and acquisitions beneficial for banks: The Indian experience.
SAJMMR, 2(1) 121-131.
Cornett, M. M., & De, S. (1991). Common stock returns in corporate takeover bids: Evidence from interstate bank mergers. Journal of Banking and Finance 15(2), 273–295.
Cybo-Ottone, A., & Murgia, M. (2000). Mergers and shareholder wealth in European banking.
Journal of Banking and Finance, 24(6), 831-859.
Deo, M., & Shah, A. (2011). Shareholder wealth effects to merger announcements in Indian IT industry. IJRCM- 1(7), 63-65.
Dodd P. (1980). Merger Proposals Management Discretion and Stockholder Wealth. Journal
Dodd, P., & Ruback, R. (1977). Tender offers and Stockholder Returns. Journal of Financial
Economics, 5(3), 351–374.
Fama, E. F. (1998). Market efficiency, long-term returns, and behavioral finance. Journal of
Financial Economics, 49, 283-306.
Franks, J. R., & Harris, R. S. (1989). Shareholder wealth effects of corporate takeovers: The U.K. experience 1955–1985, Journal of Financial Economics, 23(2), 225–249.
Fuller, K., Netter, J., & Stegemoller, M., (2002). What Do Returns to Acquiring Firms Tell Us? Evidence from Firms that Make Many Acquisitions. Journal of Finance 57, 1763-1793. Goergen, M., & Renneboog, L. (2004). Shareholder wealth effects of European domestic and
cross-border takeover bids. European Financial Management, 10(1), 9-45.
Gregory, A., & McCorriston, S. (2005). Foreign acquisitions by UK limited companies: short- and long-run performance. Journal of Empirical Finance, 12, 99–125.
Hawawini, G. A., & Swary, I. (1990). Merger and Acquisitions in the US Banking Industry,
Evidence from the Capital Markets. North-Holland: Amsterdam Publishing House.
Holl, P., & Kyriazis, D.(1997). Wealth creation and bid resistance in UK takeover bids.
Strategic Management Journal, 18, 483–498.
Holmstrom, B., & Kaplan, S. N. (2001). Corporate governance and merger activity in the United States: Making sense of the 1980s and 1990s. Journal of Economic Perspectives,
15(2), 121-144.
Houston, J. F., & Ryngaert M. D. (1994).The overall gains from large bank mergers. Journal
of Banking and Finance, 18, 1155-1176.
Houston, J. F., & Ryngaert, M.D. (1997). Equity issuance and adverse selection: A direct test using conditional stock offers. Journal of Finance, 52, 197–219.
Hudgins, S. C., & Seifert B. (1996). Stockholders and international acquisitions of financial firms: An emphasis on banking. Journal of Financial Services Research, 10, 163-180. James, C., & Wier, P. (1987). Returns to acquirers and competition in the acquisition market:
The case of banking. Journal of Political Economy. 95, 355–370
Jarrell, G. A., & Poulsen, A. B. (1989). The returns to acquiring firms in tender offers: Evidence from three decades. Financial Management, 18(3), 12–19.
Jensen, M. C., & Ruback, R. S. (1983).The Market for Corporate Control: The Scientific Evidence. Journal of Financial Economics, 11(1-4), 5-50.
Khan, M. Y. (2004). Financial Services. Tata McGraw Hill, New Delhi, III Edition.
Kothari, S. P., & Warner, J. B. (2004). Econometrics of event studies. In Espen Eckbo, B. (Eds.), Chapter 1 in Handbook of Corporate Finance. North Holland: Elsevier.
Lang, L., Stulz, R.M., & Walking, R. A.(1989). Managerial performance, Tobin’s q and gains from successful tender offers. Journal of Financial Economics, 24, 137–154
Leeth, J. D., & Borg, J. R. (2000). The impact of takeovers on shareholders wealth during the 1920s merger wave. Journal of Financial and Quantitative Analysis, 35(2), 217-238. Mackinlay, A. C. (1997). Event Studies in Economics and Finance. Journal of Economic
Literature 35, 13-39
Madura, J., & Wiant K. J. (1994). Long-term valuation effects of bank acquisition. Journal of
Banking and Finance, 18, 1135-1154.
Mishra, A., & Goel, R. (2005). Return to Shareholders from Mergers: The Case of RIL and RPL Merger. IIMB Management Review, 17(3), 69-79.
Narasimham Committee (1991). Banking sector reforms in India. Retrieved from www.rbi.
org.in
Neely, W. P. (1987). Banking acquisitions: Acquirer and target shareholder returns. Financial
Management, 16, 66–74.
Nelson, R. L. (1959). Merger movements in American industry 1895-1956. Princeton University Press: Princeton.
Penas, M. F., & Unal, H. (2004). Gains in bank mergers: Evidence from the bond market.
Journal of Financial Economics, 74(1). 149-179.
Penrose, E. T. (1959). The Theory of the Growth of the Firms. Oxford UK: Oxford University Press.
Renneboog, L. D. R. (2006). Advances in Corporate Finance and Asset Pricing. London: Elsevier Research.
Roll, R. (1986). The hubris hypothesis of corporate takeovers. Journal of Business. 58, 197-216.
Schwert, W. (1996). Mark up pricing in mergers and acquisitions. Journal of Financial
Economics, 41, 153-192.
Selvam, M., Vanitha, S., Gayathri, J., Bennet, E., & Nageswari, P. (2010). The determinants of shareholders wealth of acquiring firms in India. Journal of Modern Accounting and
Auditing, 6(1), 46-54.
Serra, A, P. (1999). Dual-listings on international exchanges: The case of emerging markets stocks. European Financial Management, 5(2), 165-202.
Sharpe, W. F. (1963). A Simplified Model for Portfolio Analysis. Management Science, 9(2), 277-293.
Sherman, A., & Hart, M. (2006). Mergers & Acquisitions from A TO Z. New York: Amacom press.
Sikarwar, E. (2012). Impact of merger announcements on shareholder’s wealth: An event case study of state bank of India. AJRBF, 2, 7-9
Singh ( 1995). Economic Liberalization in India. New Delhi: Ashish Publishing House. Smith, A., & Kim, J. (1994). The combined effects of free cash flow and financial slack on
bidder and target stock returns. Journal of Business, 67, 281– 310.
Sudarsanam, S., & Mahate, A. A. (2003). Glamour acquirers, method of payment and post-acquisition performance: The UK evidence. Journal of Business Finance and
Accounting, 30(1-2), 299–342.
Trifts J. W., & Scanlon, K. P. (1987). Interstate bank mergers: the early evidence. The Journal
of Financial Research. 10, 305–311.
Venkatesan, S., & Govindarajan, K. (2011). Acquisition activities of Public sector banks in India and its impact on shareholders’ wealth. International Research Journal of Finance
and Economics, 67(May), 63-71.
Wall, L. D., & Gup, B. E. (1989). Market valuation effects of bank acquisitions. In Benton, E. G. (Eds.), Bank mergers: Current Issues and Perspectives (pp. 107-120). Boston: Kluwer Academic Publishers.
Warren-Boulton, F. R., & Dalkir, S. (2001). Staples and office Depot: An event-probability case study. Review of Industrial Organization, 19(4), 467-479.
Weston, J. F., Mitchell, M. L., & Mulherin J. H. (2005). Takeovers, Restructuring, and
Corporate Governance, Fourth Edition. Upper Saddle River, New Jersey: Pearson
HDFC Bank ( Centurion BOP) 05-02-08 α 0.000 0.001 0.289 0.773 0.001 0.002 0.635 0.527
β 1.151 0.081 14.146 0.000 0.663 0.113 5.882 0.000
Indus Bank (Ashok Leyland 02-12-03 α 0.000 0.002 0.104 0.917 0.002 0.002 1.197 0.233 Finance) β 0.920 0.129 7.132 0.000 0.250 0.123 2.026 0.044
ICICI Bank (ICICI Ltd.) 25-10-01 α 0.001 0.003 0.387 0.700 -0.001 0.002 -0.310 0.757
β 0.859 0.150 5.748 0.000 0.933 0.109 8.555 0.000
ICICI Bank (Sangli Bank) 12-12-06 α 0.000 0.001 0.367 0.714 - - -
β 0.839 0.070 11.948 0.000 - - -
-ICICI Bank (Bank Of Madura) 8-12-02 α 0.006 0.003 2.017 0.045 -0.001 0.003 -0.283 0.778
β 0.761 0.130 5.839 0.000 0.486 0.121 4.009 0.000
ICICI Bank (Bank of Rajasthan) 19-05-10 α 0.000 0.002 0.107 0.915 -0.002 0.003 -0.684 0.395
β 0.897 0.085 12.945 0.000 1.142 0.130 8.775 0.000
Centurion Bank ( Bank Of 29-06-05 α 0.002 0.003 0.623 0.534 0.001 0.003 0.375 0.708 Punjab) β 1.272 0.261 4.870 0.000 1.177 0.259 4.537 0.000
Federal Bank Of India
(Ganesh Bank) 06-01-06 α -0.001 0.002 -0.303 0.762 - - - -Bank of Baroda (Benaras State 22-10-01 α 0.002 0.002 0.750 0.454 - - - -Bank) β 0.742 0.128 5.819 0.000 - - - -Global Trust Bank (Axis Bank) 25-01-01 α 0.004 0.003 1.283 0.201 0.002 0.002 1.076 0.283
β 1.131 0.152 7.415 0.000 0.556 0.097 5.718 0.000
Indian Overseas Bank (Baharat 09-04-07 α 0.000 0.002 -0.064 0.949 - - - -Overseas Bank ) β 1.327 0.097 13.674 0.000 - - - -Oriental Bank Of Commerce 26-07-04 α 0.000 0.002 0.107 0.915 -0.002 0.003 -0.684 0.495 (GTB) β 1.617 0.095 16.945 0.000 1.142 0.130 8.775 0.000
State Bank Of India (Swarastra 27-08-07 α 0.001 0.001 0.681 0.497 - - - -Bank) β 1.404 0.087 16.090 0.000 - - - -IDBI Bank (-IDBI Ltd) 29-07-04 α -0.001 0.003 -0.434 0.665 -0.001 0.002 -0.502 0.617
β 1.368 0.134 10.210 0.000 1.360 0.099 13.716 0.000
IDBI Bank (Western Bank) 12-09-06 α -0.004 0.001 -3.105 0.002 -0.005 0.003 -1.899 0.059
β 1.394 0.080 17.480 0.000 0.684 0.144 4.741 0.000
State bank of India(State Bank 19-06-09 α 0.002 0.002 1.445 0.150 - - - -of Indore) β 1.153 0.058 19.868 0.000 - - - -Punjab National Bank 17-12-04 α 0.002 0.002 1.161 0.248 - - - -(Nedungadi Bank) β 1.203 0.190 6.324 0.000 - - -
-APPENDIX
Appendix 1: OLS Regression Summary Statistics of Bidder and Target Banks During Estimation Period
Target Banks Bidder Banks
Event date
PV
PV t-stat
t-stat SE
SE CF
CF
Notes: Banks In Parenthesis represents Target Banks. CF, SE and PV indicate Coefficients (Alpha & Beta), Standard Error