Plasma and Fusion Research: Regular Articles Volume 14, 1402114 (2019)
Comparison of Conditional Average Using Threshold and
Template Methods for Quasi-Periodic Phenomena in Plasmas
Fumiyoshi KIN
1,a), Kimitaka ITOH
2,3,4), Tim HAPPEL
5), Gregor BIRKENMEIER
5,6),
Akihide FUJISAWA
4,7), Sigeru INAGAKI
4,7), Sanae-I. ITOH
4,7,8),
Ulrich STROTH
5,6)and ASDEX Upgrade Team
1)Interdisciplinary Graduate School of Engineering Sciences, Kyushu University, 6-1 Kasuga Koen, Kasuga, Fukuoka
816-8580, Japan
2)Institute of Science and Technology Research, Chubu University, 1200 Matsumoto-cho, Kasugai, Aichi 487-8501, Japan 3)National Institute for Fusion Science, 322-6 Oroshi-cho, Toki 509-5292, Japan
4)Research Center for Plasma Turbulence, Kyushu University, 6-1 Kasuga Koen, Kasuga, Fukuoka 816-8580, Japan 5)Max Plank Institute for Plasma Physics, Boltzmannstr. 2, 85748 Garching, Germany
6)Physik-Department E28, Technische Universitat München, James-Franck-Str. 1, 85748 Garching, Germany 7)Research Institute for Applied Mechanics, Kyushu University, 6-1 Kasuga Koen, Kasuga, Fukuoka 816-8580, Japan 8)Department of Innovative Energy Science and Engineering, Graduate School of Enginerring, Chubu University, 1200
Matsumoto-cho, Kasugai, Aichi 487-8501, Japan
(Received 16 April 2019/Accepted 16 May 2019)
The comparison of conditional averaging using so-called threshold and template methods is made in their application on quasi-periodic burst of I-mode in ASDEX Upgrade (AUG) I-mode plasma. For obtaining condi-tionally averaged waveforms, three different manners to determine the ‘clocks’, using raw signal, envelope of the signal and numerical filtering, are applied to each method. The comparison demonstrates the excellency of the template method to extract typical characteristics of target phenomena in its uniqueness to select the ensemble waveforms and its good convergence property.
c
2019 The Japan Society of Plasma Science and Nuclear Fusion Research
Keywords: conditional averaging, template method, threshold method, magnetic burst, intermittence, ASDEX Upgrade, I-mode plasma
DOI: 10.1585/pfr.14.1402114
1. Introduction
A number of phenomena characterized with quasi-periodic bursts are known in magnetic confinement plas-mas. The examples include sawtooth oscillations [1], edge-localized mode (ELM) in the high confinement mode (H-mode) [2], energetic particle driven modes such as fishbone instabilities [3] and so on. In order to understand and clar-ify the mechanisms and the transport processes of these kinds of phenomena, it is often necessary to obtain the typ-ical spatio-temporal evolution of the bursts after eliminat-ing the noise of the individual events. For the purpose, the conditional averaging has been widely applied [4–6].
One of the common questions about applying the con-ditional average for quasi-periodic bursts is how the tem-poral windows of the ensembles are chosen for the average or how the “clocks”, which mean the times for the indi-vidual events to occur, are determined. One of the com-monly used methods is that the clocks can be chosen as the time when the reference signal has a local peak, which goes beyond a threshold value. In this paper, we call this
author’s e-mail: [email protected]
a)Current affiliation: National Institutes for Quantum and Radiological
Science and Technology, Naka 311-0193, Japan
technique the threshold method. The other technique de-veloped recently is called the template method [7, 8], in which the clocks are determined as the times when the cross-correlation between the template and the signal is sufficiently high, in other words, when the signal resem-bles to some degree of the standard pattern defined as ‘tem-plate’. This article presents the results of conditional av-eraging applied on the intermittent bursts observed during the I-mode plasma of ASDEX Upgrade (AUG) [9–11], and shows the excellent features of the template methods by the comparison to the threshold methods.
2. The Intermittent Bursts in ASDEX
Upgrade I-mode Plasma
The I-mode is an improved energy confinement regime, in which heat transport in the pedestal is inhib-ited to some degree, while particle transport remains at low confinement mode (L-mode levels). The I-mode is char-acterized by a quasi-periodic phenomenon [12–14], called the Weakly Coherent Mode (WCM), which resides in a plasma edge and is a typical fluctuation during the I-mode. The I-mode is obtained when the ion grad B drift points
c
2019 The Japan Society of Plasma
Fig. 1 (a) Raw signal of ˙Bpol fluctuations measured by Mirnov coil. (b) Enlarged view of the burst. (c) Power spectrum of the ˙Bpol
fluctuations.
away from the active x-point, which is an unfavorable magnetic geometry to access the H-mode power thresh-old. During the I-mode, intermittent bursts are observed in the Doppler reflectometry, bolometry and Mirnov coils. Figure 1 (a) shows the raw signal of the Mirnov coils dur-ing the I-mode in discharge #29744, which is reported in Ref. [9, 10]. The ˙Bpol fluctuation increases abruptly and intermittently. The enlarged view of the burst within the blue-hatched region is shown in Fig. 1 (b), which indicates the non-monotonic increase of the burst. In Fig. 1 (c), the power spectrum of the ˙Bpolfluctuation indicates two char-acteristics. One is the broad frequency spectrum range, which is less than 90 kHz, and the other is high frequency components, which are around 130 kHz.
3. Comparison of Conditional
Aver-ages Using Threshold and Template
Methods
3.1
Conditional average
The conditional average is used to extract a typical temporal evolution of statistical phenomena. The defini-tion of the condidefini-tional average is as follows. Assuming a temporally sequential signalx(t), the conditionally aver-aged signalX(τ) is obtained as, X(τ) = N1 Ni=1x(ti +τ), where−T < τ≤T andT is a specific time width,tiis the
i-th number of the clock andNis the total ensemble num-ber. In the following studies, we use the ˙Bpolfluctuations signal, which has a sampling frequency of 2 MHz, and the width of temporal window,T, is set to be 500µs. In the conditional average, the problem is how to determine the temporal windows, or clocks of the ensemble data.
Fig. 2 The threshold method is performed for 3 different pro-ceeded signals of ˙Bpolbursts. (a) Raw signal, (b) envelope
of the raw signal, and (c) low-pass 90 kHz signal are used and named as Case-a, Case-b and Case-c, respectively. Threshold values are defined as 5σ. The red points indi-cate the clocks for each case.
3.2
Threshold method
Plasma and Fusion Research: Regular Articles Volume 14, 1402114 (2019)
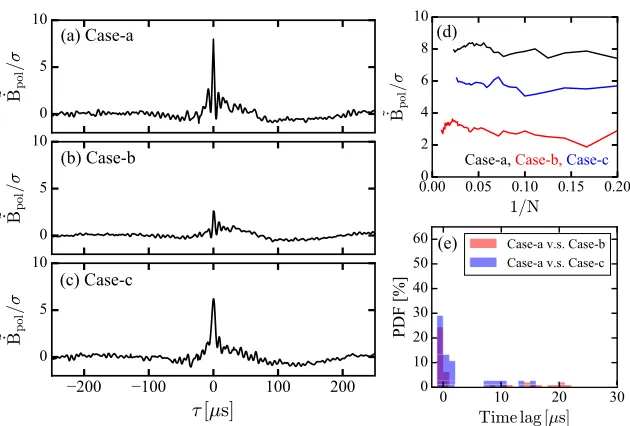
Fig. 3 Threshold method is performed. (a), (b) and (c) show the conditionally averaged waveforms of the bursts for the Case-a, Case-b and Case-c, respectively. (d) Convergence of the amplitude of the bursts atτ=0µs. N indicates the ensemble number. (e) PDF of the clocks difference between Case-a and Case-b/Case-c.
filtered signal of ˙Bpolfluctuations, which is normalized by their standard deviationσ. Here, the envelope is estimated from the Hilbert transform [15]. The processed signals in Figs. 2 (a), (b) and (c) are named as Case-a, Case-b and Case-c, respectively. In these three cases, all the thresh-old values are set as 5σ, to determine the clocks for Case-a, Case-b and Case-c, respectively. The red points in the Fig. 2 show the clocks, which are different from each other. Note we only choose maximum points above the threshold value as the clocks in temporal windows, thus the clock is uniquely determine in a temporal window. The condi-tional averages using these clocks are carried out for these three cases, and the results are shown in Figs. 3 (a)-(c). It is clear that these waveforms are different from each other, in terms their amplitude, phase and the start of their changes. The convergence property of the three cases is studied. The amplitudes atτ= 0µs against the ensemble number, as is shown in Fig. 3 (d), show that the amplitudes converge to the different values. The total ensemble numberN for Case-a, Case-b and Case-c are 43, 99 and 38, respectively. The time differences of the clocks between three cases are shown in Fig. 3 (e). The probability density function (PDF) of the time lags between three cases clearly demonstrate that the finite difference is produced against the data pro-cess of the conditional averages.
3.3
Template method
The rough procedure of the conditional average using the template method is explained in the following. First, an initial template waveform Xi=0(τ), which is similar to the target bursts, is prepared in any manner. For example, the waveform obtained from the threshold method, Case-a, is used as initial template represented as black line in
Fig. 4 The procedure of the template method is shown. (a) Raw signal of ˙Bpoland (b) cross correlation between raw
sig-nal and initial template where the red point indicates the clocks. (c) initial/0th iterated template (black), 1st iter-ated template (red) and converged, 10th iteriter-ated template (blue).
Fig. 4 (c). Then, cross correlationCi(t) between a signal
x(t) (Fig. 4 (a)) and the initial templateXi=0(τ) is calculated as,Ci(t) = x(t+τ)Xi(τ)/
x(t+τ)2
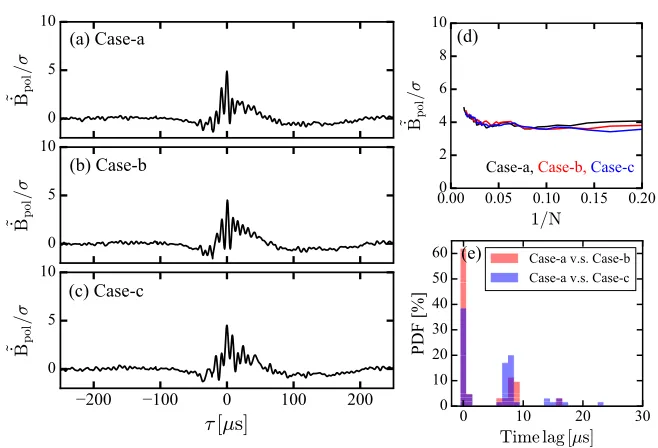
Fig. 5 Template method is performed. (a), (b) and (c) show the conditionally averaged waveforms of the bursts for the Case-a, Case-b and Case-c, respectively. (d) Convergence of the amplitude of the bursts atτ =0µs. (e) PDF of the clocks difference between Case-a and Case-b/Case-c.
Figure 4 (b) shows the cross correlationCi=0(t), which shows several local peaks indicated by the red points. Here, the clocks are selected the peak of the reference, where the cross-correlation should be above 0.45. Using the obtained clocks, the conditional average is carried out to give a new template waveform. Using the new template, the iteration is fulfilled until the template converges. In this case, the convergence is obtained after 10 times iteration, as shown in blue line in Fig. 4 (c). In order to investigate the dependence of the initial template, two other cases of the conditional averages are calculated using different ini-tial templates corresponding to Case-b and Case-c in the threshold method in Figs. 3 (b) and 3(c).
Figure 5 show the results of these conditional aver-ages, and demonstrate that the results are almost the same in spite of usage of the different initial templates. Simi-larly to the threshold method, Fig. 5 (d) indicates the con-vergence of the amplitudes atτ = 0 µs against the en-semble number for the three cases. The total enen-semble numberN for Case-a, Case-a and Case-c are 73, 63 and 65, respectively. In the template method, every case con-verges to the almost same values. Besides, the time lags between the cases are almost around 0µs, as shown in the PDF at Fig. 5 (e). It is noted that in Figs. (a)-(c), the template method provides the increase and decrease of high-frequency fluctuation components accompany with the bursts, which is consistent with the previous work [11]. Template method can conserve even high frequency com-ponents clearly.
4. Discussion and Summary
The comparison between the results of conditional
av-erages using threshold and template methods is made in the case of the quasi-periodic phenomenon observed in I-mode in ASDEX Upgrade. The comparison shows the ex-cellent properties of the template method that the obtained waveforms are independent of the choice of initial template waveforms. The excellent point is associated with the fact that the template method determines the clock and period of the phenomena from the whole properties of the wave-forms,e.g., shapes, height, length, and so on. The property guarantees that typical features can be extracted more auto-matically in quasi-periodic phenomena. On the other hand, here the three cases using the threshold method shows dif-ferent waveforms, since the method only determines the clocks from a local property of the waveforms,e.g., maxi-mum values of local peaks. This suggests that the method could be useful to extract particular features with focus on a specific aspect of the target phenomena.
Acknowledgments
We thank members of ASDEX Upgrade experimen-tal group for providing experimenexperimen-tal data. One of the authors (FK) cordially acknowledges the hospitality of Max Plank Institute for Plasma Physics. This work was partly supported by JSPS Research Fellow (JP16J00560) and was partly supported by Grand-in-Aid for Scientific Research of JSPS, Japan (JP15H02155, JP16H02442 and JP17H06089).
[1] T.P. Goodmanet al., Phys. Rev. Lett.106, 245002 (2011). [2] P.B. Snyderet al., Nucl. Fusion44, 320 (2004).
Plasma and Fusion Research: Regular Articles Volume 14, 1402114 (2019)
[5] T. Kobayashiet al., Phys. Rev. Lett.120, 045002 (2018). [6] F. Kinet al., Phys. Plasmas25, 062304 (2018).
[7] S. Inagakiet al., Plasma Fusion Res.9, 1201016 (2014). [8] Y. Kawachiet al., Plasma Fusion Res.13, 3401105 (2018). [9] T. Happelet al., Nucl. Fusion56, 064004 (2016). [10] T. Happelet al., Plasma Phys. Control. Fusion59, 014004
(2017).
[11] P. Manzet al., Nucl. Fusion57, 086022 (2017). [12] D.G. Whyteet al., Nucl. Fusion50, 105005 (2010). [13] F. Ryteret al., Nucl. Fusion57, 016004 (2017). [14] D.G. Whyteet al., Nucl. Fusion51, 113005 (2011). [15] P. Bloomfield, Fourier Analysis of Time Seriese