0.08 ± 0.03 pM; dan SiO4 = 9.98 ± 0.54 µM) adalah rendah dan mencerminkan keadaan oligotrofik. Sifat oligotrofik perairan Pulau Redang pula menyokong biojisim yang rendah iaitu kelimpahan bakteria = 6.6 ± 0.5 × 10⁵ sel ml–1; kelimpahan pikoplankton = 9.3 ± 0.8 × 10⁴ sel ml–1; kelimpahan fitoplankton = 4.8 ± 2.2 × 10³ sel ml–1 dan kelimpahan zooplankton = 1.18 ± 0.57 × 10³ sel l–1. Komuniti fitoplankton terdiri daripada sepuluh genus (Asteramphalus sp., Bacteriastrum sp., Chaetoceros sp., Cosinodiscus sp., Diploneis sp., Hemialus sp., Leptocylindricus sp., Navicula sp., Nitzschia sp., dan Rhizosolenia sp.) , dan secara bererti berbeza dari perairan dekat pantai. Perairan Pulau Redang mempamerkan komuniti fitoplankton yang lebih ringkas, dan yang lebih mudah dipengaruhi oleh perubahan iklim.
INTRODUCTION
Phytoplankton plays an important role functioning at the base of the food web through photosynthesis, in-corporating dissolved carbon dioxide (CO2) as bio-mass [5,23]. In recent years, anthropogenic activi-ties have greatly affected the global carbon (C) cycle where an increasing amount of CO2 being released into the atmosphere is identified as the main cause of global warming [9,11]. This has accelerated research on ocean primary producers (e.g. phytoplankton) as primary production is responsible for removing 30 – 60% of the CO2 emissions [5,17]. Phytoplankton is usually classified as > 2 µm fraction, and consists mainly of diatoms and dinoflagellates [18]. Variabil -ity in phytoplankton biomass is attributed to light intensity, seawater temperature and inorganic nutri-ent concnutri-entrations [3,26,30] whereas phytoplankton
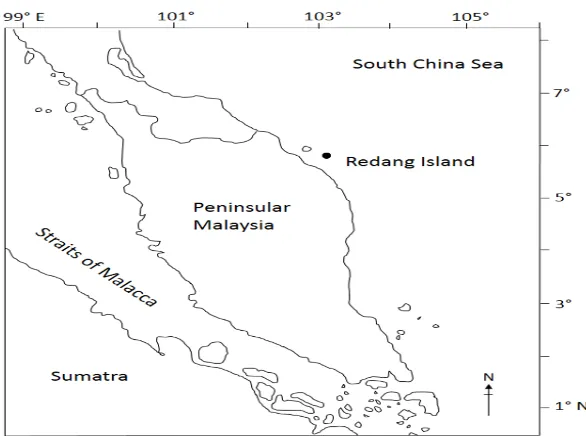
diversity reflects the resilience of the phytoplankton community to environmental stresses [12,28]. The Sunda Shelf region is important in terms of ma -rine biodiversity and yet studies on phytoplankton in this region have mainly focused on near-shore coastal waters e.g. Klang and Port Dickson [13]. This present study was an attempt to complement our understanding of phytoplankton distribution by studying waters with less anthropogenic influence. We chose Redang Island waters located on the east side of Peninsular Malaysia. Redang Island is a pop-ular tourist spot with teeming coral reefs. As phy-toplankton exhibits relatively short reaction time to environmental change, we adopted a short-timescale sampling strategy to observe for any temporal vari-ation. Although we only captured ‘snapshots’ of the environment in this study, short-term changes can
SHORT-TIMESCALE VARIATION OF PHYTOPLANKTON ABUNDANCE AND
DIVERSITY AT REDANG ISLAND
1Laboratory of Microbial Ecology, Institute of Biological Sciences, University of Malaya, 50603 Kuala
Lum-pur, Malaysia
Joon Hai Lim
1, Choon Weng Lee
1,2,*ABSTRACT A short-timescale sampling of phytoplankton abundance and diversity was carried out at Redang Island waters, South China Sea. Physico-chemical variables measured at four intervals over a day were relatively stable (temperature = 29 ± 0.6°C ; salinity = 27 ± 2 ppt, pH = 7.8 ± 0.1; total alkalinity = 2025 ± 33 µeq l–1) whereas inorganic nutrient concentrations (NH4 = 1.36 ± 0.51 µM; NO2 = 0.06 ± 0.03 µM; PO4 = 0.08 ± 0.03 µM; and SiO4 = 9.98 ± 0.54 µM) were low and reflected oligotrophic conditions. The oligotrophic nature of Redang
Island waters supported relatively lower biomass i.e. bacterial abundance = 6.6 ± 0.5 × 10⁵ cell ml–1; picoplankton abundance = 9.3 ± 0.8 × 10⁴ cell ml–1; phytoplankton abundance = 4.8 ± 2.2 × 10³ cell ml–1 and zooplankton abundance = 1.18 ± 0.57 × 10³ cell l–1. Phytoplankton community was made up of ten genera (Asteramphalus sp., Bacteriastrum sp., Chaetoceros sp., Cosinodiscus sp., Diploneis sp., Hemialus sp., Leptocylindricus sp.,
Navicula sp., Nitzschia sp., and Rhizosolenia sp.), and significantly different from near-shore waters. Redang
Island waters exhibited a simpler phytoplankton community which is probably more susceptible to climate change.
ABSTRAK Penyampelan cara skala masa pendek mengkaji kelimpahan dan kepelbagaian fitoplankton telah dijalankan di perairan Pulau Redang, Laut China Selatan. Pembolehubah fiziko-kimia yang diukur empat kali dalam sehari adalah agak stabil (suhu = 29 ± 0.6 ° C; kemasinan = 27 ± 2 ppt, pH = 7.8 ± 0.1; jumlah kealkalian = 2025 ± 33 μeq l–1) manakala kepekatan nutrien tak organik (NH
4 = 1.36 ± 0.51 µM; NO2 = 0.06 ± 0.03 µM; PO4 =
(Keywords: coral reef, Redang Island, phytoplankton abundance, phytoplankton diversity, Sunda Shelf) 2Institute of Ocean and Earth Sciences, University of Malaya, 50603 Kuala Lumpur, Malaysia
drive long-term patterns [29], and results from this study could give us a lead on possible long-term re-search strategies.
MATERIALS AND METHODS
Sampling and Physiochemical Characteristics
Short-timescale sampling was carried out at Redang Island (N5º46’, E103º02’), east coast of Malaysia (Figure 1). Four samplings were carried out over a one-day period (8:00 am, 11:00 am, 14:30 pm and 17:30 pm), and about 12 l of water sample was col-lected each time. Physical parameters such as tem-perature, salinity (YSI–30, USA) and pH (Mi 106, USA) were measured in-situ. For inorganic nutrient analyses [ammonium (NH4), phosphate (PO4), ni-trite (NO2) and silicate (SiO4)] [19] and total al-kalinity measurements [7], seawater sample was preserved with mercury chloride (HgCl2) (1% final concentration). Although nitrate (NO3) predomi-nates in island or offshore waters in this region [13], it was not measured here as the preservation method was not suitable for NO3 analysis [8]. Additionally, 10 ml of the seawater sample was preserved with glutaraldehyde (4% final concentration) for bacteria and phototrophic picoplankton enumeration. The remaining water sample (≈ 5.5 l) was concentrated via plankton nets with mesh sizes of 140 µm and 20 µm for zooplankton and phytoplankton, respective-ly. These samples were then preserved with 4% Lu
-gol’s iodine [27]. All preserved samples were kept cold until further analyses in the laboratory.
Plankton Enumeration
Bacterial abundance was determined via epifluo -rescence microscopy (Olympus BX60, Japan) on samples stained with 4’,6-diamidino-2-phenylin-dole (DAPI) [21] whereas unstained samples were viewed for autofluorescing phototrophic picoplank -ton (Ppico). For phytoplank-ton and zooplank-ton enumeration, samples were placed in a sedimen-tation chamber and observed via an inverted mi-croscope (Olympus IX51, Japan) whereas phyto-plankton identification was carried out according to Salleh & Tajuddin [24].
Statistical Analyses
All values were reported as mean ± standard devi-ation (S.D.) unless otherwise stated. Shannon-Wie-ner diversity index (H’) [25] was used to express phytoplankton species richness in the community, taking into account the proportion of each genus rel-ative to their abundance whereas correlation anal-ysis was used to show the relationship among the different parameters measured. Comparison of the phytoplankton community was carried out via Anal-ysis of Similarity (ANOSIM). All tests were carried out with the software PAST [10].
RESULTS
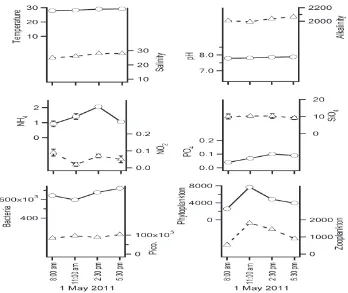
Seawater temperature measured varied within a narrow range throughout the day, from 28 to 29°C (29 ± 0.6°C) whereas salinity varied from 25 to 28 ppt (27 ± 2 ppt) (Figure 2). There was also minimal change in pH i.e. from 7.8 to 7.9 (7.8 ± 0.1) throughout the day. Similarly, total alkalinity ranged from 1990 to 2060 µeq l–1 (2025 ± 33 µeq
l–1). As for inorganic nutrient concentrations, NH 4
and NO2 fluctuated from 0.92 to 2.06 µM (1.36 ± 0.51 µM) and 0.02 to 0.09 µM (0.06 ± 0.03 µM), respectively. On the other hand, PO4 and SiO4 fluctuated from 0.04 to 0.10 µM (0.08 ± 0.03 µM) and 9.20 to 10.33 µM (9.98 ± 0.54 µM), respectively.
In terms of the biology, bacterial abundance varied from 5.8 to 7.2 × 10⁵ cell ml–1 (6.6 ± 0.5 × 10⁵ cell
ml–1) whereas Ppico abundance was about two–
orders of magnitude lower, from 0.8 to 1.0 × 10⁴
cell ml–1 (9.3 ± 0.8 × 10⁴ cell ml–1). Both bacterial
and Ppico abundance were relatively stable
(Coefficient of Variation, CV = 13%). In contrast, phytoplankton and zooplankton abundance varied over two-fold. Phytoplankton abundance fluctuated from 2.6 to 7.7 × 10³ cell ml–1 (4.8
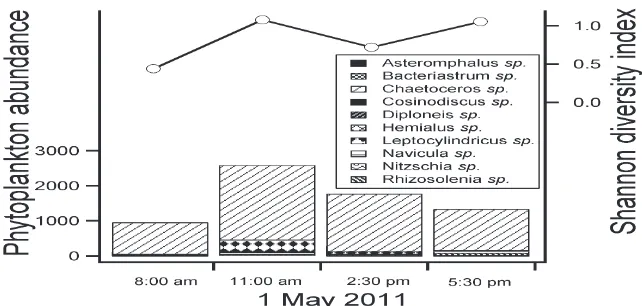
± 2.2 × 10³ cell ml–1) (Figure 2) and the genera
observed were Asteramphalus sp., Bacteriastrum sp., Chaetoceros sp., Cosinodiscus sp., Diploneis sp., Hemialus sp., Leptocylindricus sp., Navicula sp., Nitzschia sp., and Rhizosolenia sp. (Figure 3). The predominant genus observed here was Chaetoceros sp. which accounted for >58% of the phytoplankton abundance. Phytoplankton diversity in terms of Shannon-Wiener diversity index (H’) ranged from 0.439 to 1.076 (0.822 ± 0.303). Zooplankton abundance fluctuated in tandem with phytoplankton abundance and varied more than two-fold from 0.54 to 1.82 × 10³ cell l–1 (1.18 ± 0.57 × 10³ cell l–1). Both
phytoplankton and zooplankton abundance were highest at around noon (11:00 am).
Figure 2. Short-timescale variation of temperature (°C), salinity (ppt), pH, alkalinity (µeq l–1),
ammo-nium (NH4, µM), nitrite (NO2, µM), phosphate (PO4, µM), silicate (SiO4, µM), bacterial abundance (cell ml–1), phototrophic picoplankton abundance (Pico., cell ml–1), phytoplankton abundance (cell ml–1)
DISCUSSION
Generally, the temperature observed at Redang Island is typical of tropical waters [13]. Average salinity and pH were relatively constant probably because there was no significant freshwater input at Redang Island. Total alkalinity was reported for the first time for coral reef waters in Malaysia, and was within the range measured at other coral reef systems e.g. Great Barrier Reef [2]. In general, in-organic nutrient concentrations (NH4, NO2, PO4, and SiO4) at Redang Island were low and reflected an oligotrophic state. This is typical of coral reef systems that are characterized by low nutrient in-puts [16].
The oligotrophic nature of the Redang Island wa -ters supported a strikingly lower amount of biomass compared to other coastal water systems in this re-gion [13,14]. Both bacterial and Ppico abundance at Redang Island were about one order lower than near-shore coastal waters [13,15]. Ppico abundance in Redang Island waters also correlated significant -ly to phytoplankton abundance (R = 0.87, p < 0.05). This is in contrast to near-shore waters where Ppi -co abundance was independent of phytoplankton abundance (unpublished data). Our observations concurred with others who reported the co-domi-nance of Ppico and phytoplankton as typical in oli-gotrophic waters [1,22] due to the nutrient uptake efficiency of Ppico with their high surface-to-vol -ume ratio [22].
In this study, phytoplankton abundance varied over two-fold, and peaked at around noon. This tem -poral pattern is probably the result from increased
phytoplankton growth with day-light. From the phytoplankton community profile, we observed the predominance of Chaetoceros sp. in Redang Island waters throughout the day. Chaetoceros sp. employs the r-strategy, is small in size and could respond to the nutrient limiting conditions [20]. Chaetoceros sp. also correlated with zooplankton abundance (R = 0.93, p < 0.01). Although we did not measure zoo-plankton grazing rate, zoozoo-plankton grazing is an im-portant process that accounts for 60 – 75% of daily phytoplankton production [4,6], and the correlation between zooplankton abundance and Chaetoceros sp. that we observed could be a result of preda-tor-prey coupling.
In order to place our study here within a larger spatial context, we compared our study here with data from Port Dickson and Klang estuary (unpublished data), representing mesotrophic and eutrophic systems, respectively. Generally, phytoplankton abundance at Redang Island was similar to Port Dickson (9.85 ± 0.15 × 10³ cell ml–1) but lower compared to Klang
(1.39 ± 0.99 × 10⁴ cell ml–1). Eutrophic systems have
higher amounts of nutrients that support a higher phytoplankton biomass [13]. However in terms of phytoplankton community, we observed that the phytoplankton community from these three stations were significantly different (ANOSIM: R= 0.85, P< 0.001). The lower phytoplankton abundance and oligotrophic nature at Redang Island resulted in a simpler phytoplankton community (with 10 genera) compared to Klang (28 genera) and Port Dickson (28 genera). One of the perils of small phytoplankton community is the susceptibility to climate change due to the decreased variety of response from the community [12,28]. Figure 3. Composition of different phytoplankton based on abundance (cell ml–1) and Shannon diversity
CONCLUSION
From this study, we reported the phytoplankton community from Redang Island waters which also represented coral reef waters. The oligotrophic nature of these waters supported a lower phyto-plankton abundance and a simpler phytophyto-plankton community, suggesting the susceptibility of these communities to climate change.
ACKNOWLEDGEMENTS
We are grateful to University of Malaya for the grants (UM.C/625/1/HIR/050, RU006D-2014 and PV060/2011B) that supported this work. We also thank the Ministry of Science, Technology and In -novation for the eScience grant (04-01-03-SF0671) and the Ministry of Education for the HiCoE grant (IOES-2014D).
REFERENCES
2. Albright, R., Langdon, C., & Anthony, K.R.N. (2013). Dynamics of seawater carbonate chem-istry, production, and calcification of a coral reef flat, central Great Barrier Reef. Biogeosci -ences 10, 6747–6758.
3. Arin, L., Morán, X.A.G., & Estrada, M. (2002). Phytoplankton size distribution and growth rates in the Alboran Sea (SW Mediterranean): short term variability related to mesoscale hy-drodynamics. Journal Plankton Research 24, 1019−1033.
4. Calbet, A., & Landry, M.R. (2004). Phyto-plankton growth, microzooPhyto-plankton grazing, and carbon cycling in marine systems. Limnol
-ogy and Oceanography 49(1), 51–57.
5. Falkowski, P., Scholes, R.J., Boyle, E., Canadell, J., Canfield, D., Elser, J., Gruber, N., Hibbard, K., Höegberg, P., Linder, S., Macken-zie, F.T., Moore III, B., Pedersen, T., Rosenthal, Y., Seitzinger, S., Smetacek, V., & Steffen, W. (2000). The global carbon cycle: a test of our knowledge of earth as a system. Science 290, 291−296.
6. Goldyn, R., & Kowalczewska-Madura, K. (2008). Interactions between phytoplankton and zooplankton in the hypertrophic Swarzedz-kie Lake in western Poland. Journal Plankton Research 30(1), 33–42.
7. Gran, G. (1950). Determination of the equiv-alence point in potentiometric titrations. Acta Chemica Scandinavica 4, 559–577.
8. Grasshoff, K., Kremling, K., & Ehrhardt, M. (1999). Methods of Seawater Analysis, 3rd edn. Weinheim: Wiley-VCH.
9. Gregg, W.W., Conkright, M.E., Ginoux, P., O’Reilly, J.E., & Casey, N.W. (2003). Ocean primary production and climate: global decadal changes. Geophysical Research Letters 30,15. 10. Hammer, Ø., Harper, D.A.T., & Ryan, P.D.
(2001). PAST: Paleontological Statistics Soft -ware Package for Education and Data Analysis. Palaeontologia Electronica 4(1), 1–9.
11. IPCC (Intergovernmental Panel on Climate Change). (2007). Climate change: the physical science basis. Contribution of Working Group I to the 4th Assessment Report of the Inter-governmental Panel on Climate change. Cam-bridge, Cambridge University Press.
12. Ives, A.R., Gross, K., & Klug, J.L. (2000). Sta-bility and variaSta-bility in competitive communi-ties. Science 286, 542−544.
13. Lee, C.W., & Bong, C.W. (2008). Bacterial abundance and production and their relation to primary production in tropical coastal waters of Peninsular Malaysia. Marine & Freshwater Research 59, 10–21.
14. Lee, C.W., Bong, C.W., & Hii, Y.S. (2009). Temporal variation of bacterial respiration and growth efficiency in tropical coastal waters. Applied and Environmental Microbiology 75, 7594 – 7601.
15. Lee, C.W., Lim, J.H., & Heng, P.L. (2013). In-vestigating the spatial distribution of phototro-phic picoplankton in a tropical estuary. Envi
-ronmental Monitoring and Assessment 185, 9697–9704.
16. Mohamed Che, A.R., & Lee, J.N. (2011). Ac-cumulation of settling particles in some coral reef areas of Peninsular Malaysia. Sains Ma
-laysiana 40(6), 549–554. 1. Agawin, N.S.R., Duarte, C.M., & Agustí, S.
17. Mullineaux, C.W. (1999). The plankton and the planet. Science 283, 801−802.
18. Nyabakken, J.W. (1997). Marine biology: An ecological approach. USA: Addison-Wesley Education.
19. Parsons, T.R., Maita, Y., & Lalli, C.M. (1984). A manual of chemical and biological methods for seawater analysis. Oxford: Pergamon Press. 20. Pianka, E.R. (1970). On r and K selection. The
American Naturalist 104 (940), 592–597. 21. Porter, K.G., & Feig, Y.S. (1980). The use of
DAPI for identifying and counting aquatic microflora. Limnology and Oceanography 25, 943–948.
22. Raven, J.A. (1998). Small is beautiful: the pico-plankton. Functional Ecology 12(4), 503–513. 23. Sabine, C.L., Feely, R.A., Gruber, N., Key,
R.M., Lee, T., Bullister, J.L., Wanninkhof, R., Wong, C.S., Wallace, D.W.R., Tilbrook, B., Millero, F.J., Peng, T.H., Kozyr, A., Ono, T., & Rios, A.F. (2004). The Oceanic sink for anthro -pogenic CO2. Science 305, 367−371.
24. Salleh, A., & Tajuddin, Z.M. (2006). Phy -toplankton of Carey Island. Kuala Lumpur: Golden Hope Plantation Berhad and Institute of Biological Sciences, University of Malaya.
25. Shannon, C.E., & Weaver, W. (1949). The mathematical theory of communication. Urba-na: The University of Illinois Press.
26. Sigman, D.M., & Hain, M.P. (2012). The bi -ological productivity of the ocean: Section 1. Nature Educational Knowledge 3, 21.
27. Throndsen J. (1978). Preservation and storage. In A Sournia (Ed.), Phytoplankton Manual, (pp. 69−74). Paris: UNESCO.
28. Vasseur, D.A., & Gaedke, U. (2007). Spectral analysis unmasks synchronous and compensa-tory dynamics in plankton communities. Ecol
-ogy 88, 2058−2071.
29. Vaulot, D., & Marie, D. (1999). Diel variability of photosynthetic picoplankton in the equato-rial Pacific. Journal of Geophysical Research
104, 3297 – 3310.