Optimization of the centre ground method
of Electrical Impedance Tomography
System
MUKTA VERMA
Research Scholar , Department of Electronic Science, Savitribai Phule Pune University, Pune, Maharashtra, India
DR. D C GHARPURE
Professor, Department of Electronic Science, Savitribai Phule Pune University, Pune, Maharashtra, India
Dr. V. G WAGH
V N Naik college, Nasik, Pune [email protected]
Abstract :Electrical Impedance Tomography (EIT) is a non-invasive medical imaging technique where current is injected and voltages are measured through surface electrodes. For good quality images the hardware of the system must be optimized.Researchers have earlier reported that single ended measurements give more information about the test object than the differential measurement, this paper reports the optimization of EIT system based on common ground method. The reconstructed images get affected not only by the amplitude of current but also by the value of frequency at which the current is injected especially if the size and the conductivity difference between the target and the background are small.Targets with different sizes are introduced in saline solution to find the optimum value of current and frequency which gives good reconstructed images. It is observed that the optimum value of current and the frequency which gives good quality images depends on the size of the target as well as the conductivitydifference between the target and the background.
Keywords : Electrical Impedance tomography (EIT), EIDORS, Optimisation of EIT systems 1. Introduction
EIT is an emerging imaging technique which is used for imaging electrical conductivity within the body using surface measurements [Barber and Brown , (1984)]. It has wide applications in biomedical imaging like lung imaging, brain tumour and cancer detection [Akhtari Zavare, (2015)]. Though EIT image has low spatial resolution, due to its high temporal resolution lot of research has been done in this area [Yang, C.L.,( 2014)]. It has advantages over other imaging techniques namely CT, X-ray, MRI like it is non-invasive, non expensive, portable with high temporal resolution.
Different EIT systems are based on different current injection patterns like the adjacent method, the opposite method, the cross method and the trigonometric method. All these methods use differential voltage measurement. Recently single ended measurement has been getting more attraction since it gives more information about the test object than differential measurement [Brown and Seagar, (1987)]. In single ended measurement current is injected through one electrode with common electrode as the reference ground and voltages are measured on each electrode with respect to the ground electrode.In medical applications esophageal reference electrode is used in the centre to increase the sensitivity [Tehrani, (2012)].
The hardware designed for the EIT system is discussed in the next section. The third section deals with the experiments performed followed by the results.
2 . Materials and Methods 2.1 Experimental Set up
A practical phantom is developed with a circular plastic vessel of 20cm diameter and 5cm height. 16 Stainless steel electrodes of width 2cm each were cut from 100µm thick sheet and attached to the inner wall of the tank using stainless steel paper clips. It is filled with a saline solution of conductivity 0.06S/m to a height of 20mm.A stainless steel rod of 2cm diameter is fixed at the centre for the ground [Bera. and Nagaraju, (2012)].
PCB for switching between the electrodes is designed using Analog Multiplexers ADG504A. All the electrodes are connected to the PCB which in turn connects them to the multiplexers’ channels through FRI cable. One MUX is used for selecting the electrode for current injection and the other for voltage measurement. Howland current source which is a voltage controlled current source is used to inject constant current [Ross and Isaacson, D., (2003)]. A current is injected through one electrode and the centre electrode is connected to the system ground. Voltages are measured on each electrode one at a time with respect to ground. Voltages developed on the electrodes are filtered using low pass filter with cutoff frequency of 1KHz to eliminate any noise and dc signals. Data is acquired using Data Acquisition card from NI whose sampling frequency is 100KS/s. It has been reported that we get better images when the current is set so that the homogeneous data has the peak value as 75% of the maximum allowed voltage as input to the DAQ [Ranade, and Gharpure (2017)]. Hence, the output from the low pass filter goes to the Instrumentation Amplifier whose gain is set so that the peak to peak voltages are 4V. Fig1 shows the designed hardware for the data acquisition.
Fig.1. Data Acquisition system for centre ground method of Electrical Impedance Tomography
2.2 Reconstruction
Surface voltages are collected from a 16 electrode circular vessel with saline solution of conductivity 0.06S/m. These voltages are used for reconstructing 2D images using an open source software EIDORS version 3.8 [Adler, A. and Lionheart, W.R., (2006)]. One-step Gauss Newton EIT reconstruction algorithmis used for the reconstruction. It is a non iterative process and hence takes less computational time [Yasin, M, (2011)]. Regularisation parameter is selected using BestRes Method and throughout the experiments it is kept constant to be 0.01[Graham, B.M. and Adler, A., (2006)].
2.3 Optimization of the developed EIT system
The quality of the reconstructed images for a given EIT systemdepends on the size of the target, the conductivity contrast, the amplitude of current and the frequency at which the current is injected. To optimize the system, targets of differentsizes are introduced at different positionsand certain experiments are performed to find
1. The minimum size of the target that is detectable
2. The optimumvalue of current and frequency that should be injected to obtain good reconstructed images for different size targets depending on the position and the conductivity contrast.
3. If the system can detect multiple objects of different conductivities
0.25cm, plastic pen of radius 0.5cm, plastic rod of radius 1cm. Results are analysed to find the minimum value of current for which different size targets get detected and to find the minimum size of the target that is detectable for a minimum current of 1mA.
Since EIT is widely used in medical applications where the conductivity differences are very small, it becomes important to optimize the system with a small difference in conductivity. For this, carrot and cucumber whose conductivities are 0.02S/m and 0.04S/m are taken and the following experiments are performed :
1. Current is kept constant at 1ma and frequency is varied as 5Khz, 10KHz, 15Khz to see the effect on reconstructed images.
2. For each frequency, current is varied from 1mA to 5mA and the images are reconstructed.
Experiments are also performed to see if the system detects multiple objects of different conductivity contrasts For all these experiments, the gain for the instrumentation amplifier is set so that the peak to peak voltage is 4V.
3. Results and Discussions 3.1 Effect of Current:
Current is varied from 1ma to 5ma and its effect on the reconstructed imaged is analyzed for different sized targets like pencil, pen and a plastic rod, resulting in high conductivity contrast with the background.
Fig 2(b) shows the reconstructed images of the targets of radius r’ = 0.025(wooden pencil), 0.05(pen), 0.1(plastic bottle) for different values of current kept closer to the electrode number 9.
Wooden pencil ( r = 0.25cm)
Pen plastic(r = 0.5cm) Plastic rod (r = 1cm)
Fig. 2. (a)Phantom images with wooden pencil, plastic pen and plastic rod kept closer to the electrode number 9, (b) Reconstructed images for pencil radius 0.25cm(1st row), pen of radius 0.5cm(2nd row), plastic rod of radius 1cm(3rd row) as the current is varied from
1ma to 5ma
From the above figure it is observed that targets of radius 0.25 and 0.5cm kept closer to the electrodes are detected for currents greater than 4ma whereas target of radius 1cm is detected even at 1ma of current. The targets of radius 0.5cm and 1 cm are kept at different positions to find the optimum value of current depending on the position and size of the target.Fig 3 shows the reconstructed images.
Size I = 1ma I =2ma I =3ma I = 4ma I = 5ma R = 0.25cm
(r’= 0.025)
R = 0.5cm (r’= 0.05)
R = 1cm (r’= 0.1)
(a)
Position(d’) Target of radius 0.5cm Target of radius 1cm
I = 1ma I = 4ma I =5ma I =1ma I = 3ma I = 5ma
d’ = 0.8
d’ = 0.4
d’ = 0.2
Fig. 3. Reconstructed images of the targets of radius 0.5cm and 1cm kept at different positions for different values of current
Fig. 3. shows that target of radius 0.5 cm gets detected with good resolution if it is kept towards the electrodes and current is greater than 4ma, however if it is kept in the middle (d’ =0.5) or towards the centre (d’ =0.2), it gets detected but with artefacts. Target of radius 1cm gets detected for all the positions even if the current is 1ma without any artefacts. Hence, we can say that the minimum detectable size of the target is 1cm radius for 1ma of current.
3.2 Effect of frequency
3.2.1 High conductivity contrast targets:
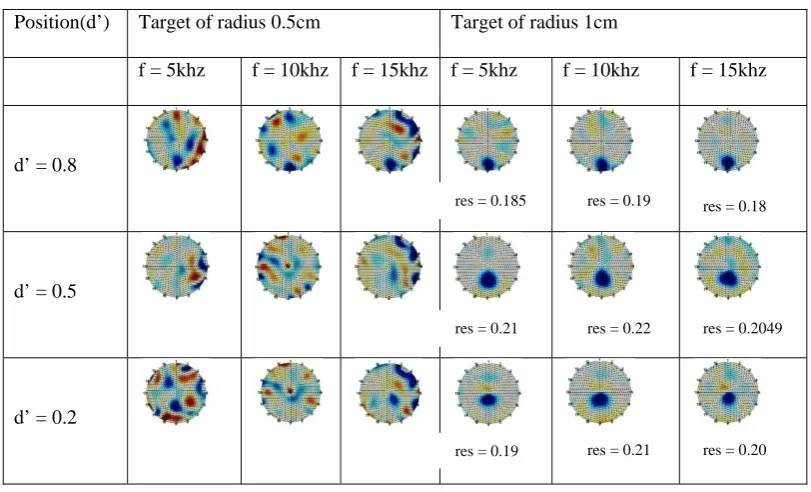
Non conducting targets made of plastic of radius 0.5cm (pen) and 1cm (plastic rod) are used. To see the effect of frequency on the reconstruction, targets are kept at three different positions (towards centre, middle, towards electrodes), current is kept constant at 1ma and frequency is varied as 5khz,10khz,15khz.
Position(d’) Target of radius 0.5cm Target of radius 1cm
f = 5khz f = 10khz f = 15khz f = 5khz f = 10khz f = 15khz
d’ = 0.8
d’ = 0.5
d’ = 0.2
Fig. 4. Reconstructed images of the targets of radius 0.5cm and 1cm kept at different positions for different values of frequency. Fig. 4. shows that there isn’t much difference in the quality of reconstructed images with the change in frequency for both the targets. To quantitatively analyse the reconstructed images for the target of radius 1cm, parameter called resolution is calculated according to the formula as proposed by Mamaitjain , (2011) where PSF is taken as the area containing 50% of the maximum amplitude. It is observed that for each position, res doesn’t show significant change with the change in frequency.
res = 0.185
res = 0.21
res = 0.19
res = 0.19
res = 0.22
res = 0.21
res = 0.18
res = 0.2049
Carrot of 1cm radius is placed towards the electrodes with its skin peeled off. Initially current of 1mA is injected at three different frequencies to analyze the effect on the reconstruction of the carrot of radius 1cm kept at different positions. Fig. 5. shows the reconstructed images as the carrot is kept at three different positions, towards the centre(d’ = 0.2), in the middle (d’ = 0.5) and towards the electrodes(d’ = 0.8)
Carrot Kept towards the electrode 5
Position f = 5Khz f = 10Khz
f = 15Khz
d’ = 0.8
d’ = 0.5
d’ = 0.2
Fig. 5. Reconstructed images for carrot of radius 1cm kept at three different positions with 1mA of current injected at different frequencies
Fig. 5. shows carrot gets detected for all the positions with 1ma of current irrespective of the frequency.
Next Cucumber of radius 1cm is introduced in the saline solution at three different positionswith its skin and outer part peeled off with inner part having the conductivity of 0.04S/m. The difference in conductivity between the cucumber and the background is 0.02S/m which is 30% of the background conductivity. The effect of frequency on the reconstructed images of such small conductivity contrast is analysed with 1ma of current injected for targets kept at different positions. Fig. 6. shows the reconstructed images
Fig. 6. Reconstructed images for cucumber of radius 1cm kept at three different positionswith 1mA of current injected at different frequencies
Fig. 6. shows that at 5Khz better images for cucumber are obtained at all the three positions. At 10Khz and 15Khz cucumber gets detected only if it is kept either closer to the boundary or towards the centre electrode where the sensitivity is the highest. If it is kept in the middle cucumber doesn’t get detected when 1mA of current is injected at frequency greater than or equal to10Khz. Though cucumber gets detected at 5khz when kept in the middle but shows some artefacts.
Now the current is also varied as 1ma , 3mA, 5ma for each frequency and the reconstructed images are analysed by keeping the cucumber in the middle (d’ = 0.5). It is observed that reconstruction for cucumber depends largely on the frequency and the amplitude of the injected current.
Position F = 5khz F = 10khz F =15khz
d’ = 0.8
d’ = 0.5
Position I = 1mA I = 3mA I = 5ma
F = 5khz
F = 10khz
F = 15khz
Fig . 7. Effect of current and frequency on the reconstructed image of cucumber kept in the middle (d’ = 0.5) of the tank
Fig. 7. shows that, though cucumber kept in the middle(d’ = 0.5)gets detected when 3ma of current is injected at 5khz frequency, however best image is obtained when 5ma of current is injected at 5Khz frequency.
3.3 Detection of multiple objects
Cucumber and carrot both are placed on opposite sides of the tank filled with saline solution of conductivity 0.06S/m to see if it is distinguishable. Cucumber is placed near the electrode 13 and carrot is placed near the electrode 5 (Fig 5(a)). Plastic rod of 1cm radius is also introduced at electrode 5(Fig 5(b)). 5ma current is injected at a frequency 5khz.
Actual image Reconstructed image
Actual image Reconstructed
image .
Fig . 8.: Reconstructed images of (a) cucumber and carrot keptat electrode 13,5 (b) cucumber , carrot and a plastic rod kept at electrodes 13,5,8 with saline solution of conductivity0.06S/m
Fig. 8. (a) shows that both cucumber and carrot get detected but cucumber shows some artefacts. Fig. 8 (b) shows that only plastic gets detected because of high conductivity contrast.
Next tap water is taken without any added salt. Maximum current allowable by the system for this conductivity was 3ma p-p. Images are reconstructed with cucumber, carrot and plastic kept near the electrodes 5,13,9 for 3ma p-p current injected at 5khz frequency. Fig. 9. shows the reconstructed image.
Actual Image Reconstructed image
Fig . 9. Reconstructed image9 of cucumber, carrot and plastic kept near the electrodes 5,13,9
4. Conclusions
EIT is a promising technique with large number of applications in medical imaging. Due to its ill posed nature it becomes important to optimize the hardware for the better reconstruction. This paper reports the optimization of the designed EIT system based on the common ground method of injection which includes finding the optimum value of current and frequency which gives good reconstructedimages. It is observed that the non conducting target of radius 0.5cm gets detected if kept closer to the electrodes and current is increased to 5ma, however if kept in the middle or towards centre it shows lot of artefacts. However, the target of radius 1cm gets detected at all positions even for smaller value of current which is 1mA.Effect of frequency on the reconstruction is also studied. It is observed that variation in frequency doesn’t show significant changes in the reconstruction of targets with high conductivity contrasts. For smaller conductivity contrasts, cucumber and carrot of conductivities 0.04S/m and 0.02S/m were used. Carrot was detected for all the positions even for 1mA of current irrespective of the frequency at which it is injected. Cucumber gets detected when 5mA of current was injected at 5KHz of frequency. The developed EIT system is also capable of detecting multiple objects of different conductivities.
From all the experiments that were performed, it can be concluded that the minimum detectable size of the target for our system is of 1cm radius.
The optimum value of current for high conductivity contrast targets ranges from 1ma to the maximum allowable value depending on the conductivity of the solution
For smaller conductivity contrast targets with change in conductivity upto 30% of background conductivity, the optimum value of current and frequency is 5ma and 5KHz.
References
[1] Adler, A., Dai, T. and Lionheart, W.R., 2007. Temporal image reconstruction in electrical impedance tomography.Physiological measurement, 28(7), p.S
[2] Adler, A. and Lionheart, W.R., 2006. Uses and abuses of EIDORS: an extensible software base for EIT. Physiological measurement, 27(5), p.S25.
[3] Akhtari-Zavare, Mehrnoosh, and Latiffah A. Latiff. "Electrical impedance tomography as a primary screening technique for breast cancer detection." Asian Pac J Cancer Prev16.14 (2015): 5595-5597.
[4] Barber, D.C. and Brown, B.H., 1984. Applied potential tomography. Journal of Physics E: Scientific Instruments, 17(9), p.723. [5] Bera, T.K. and Nagaraju, J., 2012. Common ground method of current injection in electrical impedance tomography. In Global Trends
in Information Systems and Software Applications (pp. 574-587). Springer, Berlin, Heidelberg.
[6] Brown, B.H. and Seagar, A.D., 1987. The Sheffield data collection system. Clinical Physics and Physiological Measurement, 8(4A), p.91
[7] Electrical Impedance Tomography: Methods, History and Applications, David S. Holder
[8] Evaluation of EIT images using Esophageal electrodesStephanieEng, Martin Grambone,Volker Koch, JornJustiz, Andy Adler [9] Graham, B.M. and Adler, A., 2006. Objective selection of hyperparameter for EIT. Physiological measurement, 27(5), p.S65. [10] Ranade, N.V. and Gharpure, D.C., Chracterization of LabVIEW based 16-electrode 2D EIT system.
[11] Ross, A.S., Saulnier, G.J., Newell, J.C. and Isaacson, D., 2003. Current source design for electrical impedance tomography. Physiological measurement, 24(2), p.509.
[12] Sajib, S.Z., Jeong, W.C., Kyung, E.J., Kim, H.B., Oh, T.I., Kim, H.J., Kwon, O.I. and Woo, E.J., 2016. Experimental evaluation of electrical conductivity imaging of anisotropic brain tissues using a combination of diffusion tensor imaging and magnetic resonance electrical impedance tomography. AIP Advances, 6(6), p.065109.
[13] Srinivasan, S., 2006. Electrode/electrolyte interfaces: Structure and kinetics of charge transfer. Fuel Cells, pp.27-92. [14] Tehrani, J.N., Jin, C. and McEwan, A.L., 2012. Modelling of an oesophageal electrode for cardiac function
tomography. Computational and mathematical methods in medicine, 2012.
[15] Yang, C.L., 2014. Electrical impedance tomography: algorithms and applications (Doctoral dissertation, Universityof Bath).