University of New Hampshire
University of New Hampshire Scholars' Repository
UNH Stormwater Center Research Institutes, Centers and Programs
12-1-2017
Berry Brook Watershed Management Plan
–Implementation Projects Phase III
The City of Dover
University of New Hampshire Stormwater Center (UNHSC)
Follow this and additional works at:https://scholars.unh.edu/stormwater
Recommended Citation
The City of Dover and University of New Hampshire Stormwater Center (UNHSC), "Berry Brook Watershed Management Plan –Implementation Projects Phase III" (2017).UNH Stormwater Center. 45.
Berry Brook Watershed Management
Plan –Implementation Projects
Phase III
Funding for this project was provided in part by a Watershed Assistance Grant from the NH Department of Environmental Services with Clean Water Act Section 319 funds from the
Final Report to
The New Hampshire Department of Environmental Services
Submitted by
Submitted by
Contents
EXECUTIVE SUMMARY ... 1
INTRODUCTION... 3
PROJECT PERFORMANCE: OBJECTIVES AND DELIVERABLES ... 5
Objective 1: Implementation of LID ... 5
Deliverable 1 ... 7
Deliverable 2 ... 8
Deliverable 3 ... 8
Deliverable 4 ... 9
Deliverable 5 ... 9
Deliverable 6 ... 10
Deliverable 7 ... 10
Deliverable 8 ... 11
Objective 2: A site specific project plan (SSPP) ... 11
Objective 3: Calculate Pollutant Load Reductions ... 11
Deliverable 10 ... 12
Objective 4: Project Monitoring ... 17
Deliverable 11 ... 17
Hydrology ... 17
Water Quality ... 4
Temperature ... 16
Objective 5: Operation and Maintenance ... 17
Deliverable 12 ... 17
Objective 7 (6): Provide Grant and Project management ... 17
Deliverable 13 ... 17
CONCLUSIONS AND RECOMMENDATIONS ... 17
E
XECUTIVES
UMMARYBerry Brook is a highly urbanized 1st order stream located in Dover, NH, that is classified
as Class B waters. The Brook is located in a built-out, 186-acre watershed with 29.7% effective impervious cover (EIC) and includes medium-density housing with commercial and industrial uses. The stream has been placed on the NHDES 2006 Section 303(d) list and is impaired for primary recreation and for aquatic life. The source of this impairment includes urbanization resulting in an increase of pollutant mass and runoff volumes from stormwater.
With funds provided by the New Hampshire Department of Environmental Services (NHDES) the City of Dover has been working with the University of New Hampshire Stormwater Center (UNHSC) and the Cocheco River Watershed Coalition to design and implement Low Impact Development (LID) best management practices (BMPs) in this highly urbanized environment for the purpose of effective impervious cover (EIC) reduction. The project goal is to filter, infiltrate, and reduce stormwater runoff from EIC as a means for managing pollutant loading and controlling runoff volumes to Berry Brook and consequently the Cocheco River. This project is the third and final phase of an overall watershed management plan implementation project. Previously in phases I and II, a total of twelve stormwater BMP installations were implemented leading to a reduction in 27 acres of effective impervious cover (EIC) and a total effective impervious cover (EIC) for the watershed of 29 acres down from 56 acres at the start of the project. For the purposes of this project EIC refers to impervious cover (IC) that is directly connected, through impervious surfaces, to receiving waters. Disconnection refers to the practice of directing runoff from IC such that it does not contribute directly to stormwater runoff from a site, but directs stormwater runoff to an appropriately sized, on-site treatment practice, or vegetated buffer to be filtered or infiltrated into the native soils. By the end of Phases I and II of the project the EIC% in the watershed was 16% down from 30% at the start of the project.
I
NTRODUCTIONBerry Brook, a tributary to the Cocheco River, is a 0.9 mile long stream in a 186-acre watershed in downtown Dover that is nearly completely built-out with 30% effective impervious cover (EIC) at the onset of the project. The brook is listed as impaired for aquatic habitat and primary contact recreation. This project is the third and final phase of a series of grants implementing restoration actives recommended in the Berry Brook Watershed Management Plan (WMP) completed in 2008 (LBG, 2008).
The City of Dover was assisted in this Grant by the University of New Hampshire Stormwater Center (UNHSC) and New Hampshire Department of Environmental Services (NHDES). The UNHSC: provided recommendations on low impact development (LID), survey work, retrofit designs, and engineering oversight of the stormwater treatment systems; coordinated community outreach activities in conjunction with NHDES and the city; and developed post construction reports and modeling. In addition a modest monitoring effort was undertaken and coordinated by the City of Dover and the UNHSC to track receiving water impacts pre- and post- project completion. The City of Dover, from the Department of Public Works (DPW) and administration of the overall grant, generously provided matching funds over the entire scope and timeframe of the project in the form of time, equipment, and materials in the construction of BMPs. All treatment practices were designed by the UNHSC in close collaboration with the City and installed by the DPW, with engineering oversight provided by UNHSC.
the impervious cover model assessment method NHDES uses to determine attainment) was met. These series of projects (3 watershed assistance grants and 1 aquatic resource mitigation grant) and the ensuing partnership have resulted in the installation of 26 low impact development (LID) and green infrastructure (GI) retrofits. Installations include: 12 bioretention systems, a tree filter, a subsurface gravel wetland, one acre of new wetland, day lighted and restored 1,100 linear feet of stream at the headwaters and restored 500 linear feet of stream at the confluence including two new geomorphically-designed stream crossings, three grass-lined swales, two subsurface gravel filters, an infiltration trench system and developed an innovative filtering catch basin design that has been installed in 3 different locations in the watershed. Some of the stormwater BMPs were based on designs tested at the UNHSC field site and proven for their ability to treat water quality and reduce runoff, and other systems were re-invented by City staff to decrease costs and reduce operation and maintenance burdens. The ability for City staff to reinvent and adapt stormwater BMPs was critical to the success of the project and involved the direct participation of respected staff like Bill Boulanger, Superintendent of Public Works and Utilities for the city and Gretchen Young, the assistant City Engineer. They were able to tackle three fundamental challenges that are often associated with municipal adoption of innovative stormwater management approaches: compatibility, complexity and trialability, or in other words, does it fit the management culture, can people understand it, and can local staff adapt the designs for greater utility? Due to the inherent flexibility of innovative LID management strategies, it seems logical that trusted municipal officials experiment with designs to more easily adapt seemingly complex configurations into a form more readily understood and accepted by peers.
increases (Schueler 1994; Schueler et al. 2009). More local studies have verified this threshold as well (Deacon et al. 2005).
Stream studies performed by the Center for Watershed Protection support the use of IC as a surrogate measure of the impacts on hydrology, chemistry, and biology of a stream, including impacts to aquatic life. There is also a strong correlation between pollutant loads and stormwater flows from impervious areas. According to studies, it is reasonable to rely on the surrogate measure of percent IC to represent the combination of pollutants that can contribute to aquatic life impacts (Schueler et al. 2009). The ICM concept has engendered much debate and some confusion among planners, engineers, and regulators. Most communities continue to struggle with how to influence or optimize watershed IC limits and/or how to apply techniques to mitigate its impact.
P
ROJECTP
ERFORMANCE:
O
BJECTIVES ANDD
ELIVERABLESThe objectives and deliverables of this final report are outlined below.
Objective 1: Implementation of Low Impact Development (LID) Best Management Practices (BMPs) to disconnect impervious cover (IC) and reduce pollutant loading at eight locations throughout the Berry Brook watershed will be completed. The completion of this objective will represent 83% completion of the BMPs recommended in the Watershed Management Plan (LBG, 2008), and will lead to the reduction of Effective Impervious Cover (EIC) in the entire watershed to 10.4% fulfilling the criteria to delist the Berry Brook from the 303d impaired waters list based on the impervious cover model as a surrogate for attainment.
Measures of Success: Installation of each of the LID BMP retrofits.
Stormwater treatment practices were installed at various locations throughout the Berry Brook watershed to infiltrate and treat stormwater runoff from building rooftops and parking areas.
Deliverable 1: Roosevelt Avenue Bioretention. A series of catch basins and treatment systems were installed off of Roosevelt Avenue to treat a drainage area of 1.9 acres with 0.92 acres of previously untreated DCIA associated with suburban residential development. Runoff from existing roadway was collected by a series of two deep sump catch basins (CB #3 and #4) and directed to a stone infiltration basin off the north side of Roosevelt Avenue. The infiltration basin was designed to remove coarse sediments and debris while also reducing the velocity of the runoff before discharging to a deep sump catch basin (CB #2). Discharge from CB #2 was directed to a bioretention system designed to treat a water quality volume of 0.15 inches. The bioretention system discharges to an additional deep sump catch basin (CB #1) before discharging to Berry Brook. In addition a stone infiltration trench was installed to manage and treat sheet flow across an un-stabilized area between the old waterworks building and Berry Brook. The infiltration trench also serves as part of a pedestrian path leading through the upper Berry Brook restoration area. The Roosevelt installation was constructed in May through June of 2014. Details of the installation are provided in the photo documentation and design drawing in Appendix A.
Deliverable 2: Horne Street Bioretention 2
A bioretention system was designed and installed to treat runoff from 4.78 acres of drainage area with 1.88 acres of previously untreated DCIA associated within a suburban residential development. Discharge from existing roadside runoff was directed to a series of deep sump pre-treatment catch basins on either side of the road and then piped to the bioretention system. System was constructed in October of 2013. Details of the installation are provided in the photo documentation and design drawing in Appendix A.
Deliverable 3: Roosevelt Filtering Catch Basin 1
The close partnership between UNHSC staff and city DPW employees has resulted in new and innovative adaptations to conventional GI designs that resulted in more effective, more economical, and easier to maintain system designs. The City of Dover worked directly with UNHSC staff to ensure that the systems being implemented could not only be maintained with existing personnel and equipment but could be affordable and understood by local staff. This system was the first iteration of a deep sump catch basin that also filters first flush stormwater runoff. The system was designed and installed to treat runoff from 1.4 acres of drainage area with 0.59 acres of previously untreated DCIA associated with a suburban residential development. Details of the installation are provided in the photo documentation and design drawing in Appendix A.
Photograph 2: Bioretention system at lower Horne Street
Deliverable 4: Grove Street Subsurface Gravel Filter
Another innovation pioneered in this project was the development of a subsurface gravel filter. Lacking equipment to maintain the recommended porous asphalt system, they developed the “Boulanginator,” a system that mimics the features of a porous asphalt system through a subsurface storage and filtration component connected to easily maintainable catch basins. This system looks like a typical cross-section of a porous pavement but is paved with normal dense mix asphalt. The hydraulic inlet and outlet are instead controlled through perforated inlets and underdrains. The system was designed and installed to treat runoff from 1.96 acres of drainage area and 0.61 acres of previously untreated DCIA associated with a suburban residential development. Details of the installation are provided in the photo documentation and design drawing in Appendix A.
Deliverable 5: Hillcrest Avenue Infiltration Trench
Taking advantage of highly permeable soils (HSG A) City staff installed additional drainage structures and instead of connecting them with solid pipe, connected them with perforated pipe bedded in two feet of crushed stone. A simple but effective adaptation, this approach can be replicated in other suitable areas throughout the city. The system was designed and installed to treat runoff from 3.36 acres of drainage area and 1.04 acres of previously untreated DCIA associated with a suburban residential development. Details of the installation are provided in the photo documentation and design drawing in Appendix A.
Photograph 4: Grove Street subsurface gravel filter.
Deliverable 6: Roosevelt Filtering Catch Basin 2
The close partnership between UNHSC staff and city DPW employees has resulted in new and innovative adaptations to conventional GI designs that resulted in more effective, more economical, and easier to maintain system designs. The City of Dover worked directly with UNHSC staff to ensure that the systems being implemented could not only be maintained with existing personnel and equipment but could be affordable and understood by local staff and personnel. This system was the second iteration of a deep sump catch basin that also filters first flush stormwater runoff. The system was designed and installed to treat runoff from 2.02 acres of drainage area and 0.77 acres of previously untreated DCIA associated with a suburban residential development. Details of the installation are provided in the photo documentation and design drawing in Appendix A.
Deliverable 7: Kettlebell Subsurface Gravel Filter
The first of the subsurface gravel filter systems installed is located in the parking lot of Seacoast Kettlebell, a fitness center located off of Horne Street. The primary treatment mechanism of this control is filtration; however, the design may also reduce runoff volumes through infiltration. Due to the extremely low hydraulic conductivity of the native soils at this site, volume reduction through infiltration is most likely negligible. The system was designed and installed to treat runoff from 2.41 acres of drainage area and 1.73 acres of previously untreated DCIA associated with a suburban residential development. Details of the installation are provided in the photo documentation and design drawing in Appendix A.
Photograph 6: Roosevelt Avenue filtering catch basin 2.
Deliverable 8: Grove Street Filtering Catch Basin 1
The close partnership between UNHSC staff and city DPW employees has resulted in new and innovative adaptations to conventional GI designs that resulted in more effective, more economical, and easier to maintain system designs. The City of Dover worked directly with UNHSC staff to ensure that the systems being implemented could not only be maintained with existing personnel and equipment but could be affordable and understood by local staff and personnel. This system was the third and final iteration of a deep sump catch basin that also filters first flush stormwater runoff. The City has purchased four additional filtering catch basins and will install them in other areas throughout the city. The system was designed and installed to treat runoff from 0.68 acres drainage area and 0.32 acres of previously untreated DCIA associated with a suburban residential development. Details of the installation are provided in the photo documentation and design drawing in Appendix A.
Objective 2: A site specific project plan (SSPP) for tracking pre- and post-project IC values and pollutant load reductions will be developed.
Measures of Success: SSPP developed and approved.
The SSPP was developed and approved. It is on file with NHDES.
Objective 3: Calculate Pollutant Load Reductions and Disconnected Impervious Cover
Measures of Success: Hydrological and water quality data, pre- and post-IC estimates developed, project impact evaluated.
As outlined in the Site Specific Project Plan, UNHSC used the Simple Method to estimate load reduction for this project. The Simple Method is recommended by NHDES for use on Section 319 grant projects. The model was used to estimate pre- and post-BMP implementation pollutant loads. We note that the Simple Method does not account for volume or flow reductions and therefore may underestimate the pollutant load reductions achieved by each BMP. As such, UNHSC has refined the model using a technical support
document produced specifically for NH by EPA Region 1 (EPA, 2011). The method can be used to determine DCIA reduction based on Interim Default BMP Disconnection Multipliers. The subsequent runoff reduction can then be subtracted from the pollutant load as it has been hydraulically disconnected from conveyance to the receiving water. This method was not available and thus not included in the SSPP report however it follows standards and quality assurance criteria outlined by EPA Region 1 and offers a better estimate of actual load reduction.
Below is a summary of the disconnected impervious area (IA) and the pollutant load reduction for each BMP.
Deliverable 10
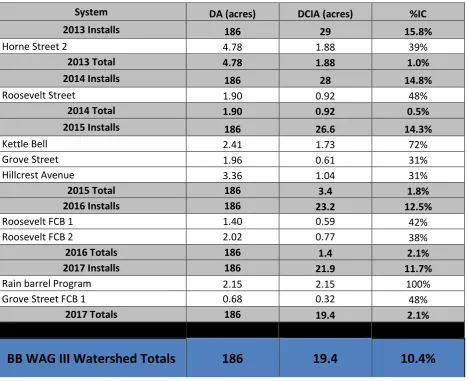
The table below depicts the eight structural and one non-structural BMPs implemented through phase III of the project.
TABLE 1: IMPERVIOUS COVER DISCONNECTED IN PHASE III OF THE PROJECT
System DA (acres) DCIA (acres) %IC
2013 Installs 186 29 15.8%
Horne Street 2 4.78 1.88 39%
2013 Total 4.78 1.88 1.0%
2014 Installs 186 28 14.8%
Roosevelt Street 1.90 0.92 48%
2014 Total 1.90 0.92 0.5%
2015 Installs 186 26.6 14.3%
Kettle Bell 2.41 1.73 72%
Grove Street 1.96 0.61 31%
Hillcrest Avenue 3.36 1.04 31%
2015 Total 186 3.4 1.8%
2016 Installs 186 23.2 12.5%
Roosevelt FCB 1 1.40 0.59 42%
Roosevelt FCB 2 2.02 0.77 38%
2016 Totals 186 1.4 2.1%
2017 Installs 186 21.9 11.7%
Rain barrel Program 2.15 2.15 100%
Grove Street FCB 1 0.68 0.32 48%
2017 Totals 186 19.4 2.1%
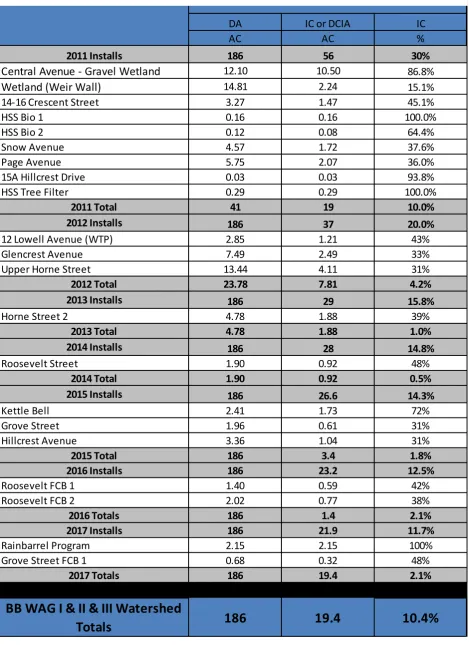
DA IC or DCIA IC
AC AC %
2011 Installs 186 56 30%
Central Avenue - Gravel Wetland 12.10 10.50 86.8%
Wetland (Weir Wall) 14.81 2.24 15.1%
14-16 Crescent Street 3.27 1.47 45.1%
HSS Bio 1 0.16 0.16 100.0%
HSS Bio 2 0.12 0.08 64.4%
Snow Avenue 4.57 1.72 37.6%
Page Avenue 5.75 2.07 36.0%
15A Hillcrest Drive 0.03 0.03 93.8%
HSS Tree Filter 0.29 0.29 100.0%
2011 Total 41 19 10.0%
2012 Installs 186 37 20.0%
12 Lowell Avenue (WTP) 2.85 1.21 43%
Glencrest Avenue 7.49 2.49 33%
Upper Horne Street 13.44 4.11 31%
2012 Total 23.78 7.81 4.2%
2013 Installs 186 29 15.8%
Horne Street 2 4.78 1.88 39%
2013 Total 4.78 1.88 1.0%
2014 Installs 186 28 14.8%
Roosevelt Street 1.90 0.92 48%
2014 Total 1.90 0.92 0.5%
2015 Installs 186 26.6 14.3%
Kettle Bell 2.41 1.73 72%
Grove Street 1.96 0.61 31%
Hillcrest Avenue 3.36 1.04 31%
2015 Total 186 3.4 1.8%
2016 Installs 186 23.2 12.5%
Roosevelt FCB 1 1.40 0.59 42%
Roosevelt FCB 2 2.02 0.77 38%
2016 Totals 186 1.4 2.1%
2017 Installs 186 21.9 11.7%
Rainbarrel Program 2.15 2.15 100%
Grove Street FCB 1 0.68 0.32 48%
2017 Totals 186 19.4 2.1%
BB WAG I & II & III Watershed
186
19.4
10.4%
Installed BMPs in Upper Berry Brook Watershed
BMP Subwatershed parameters
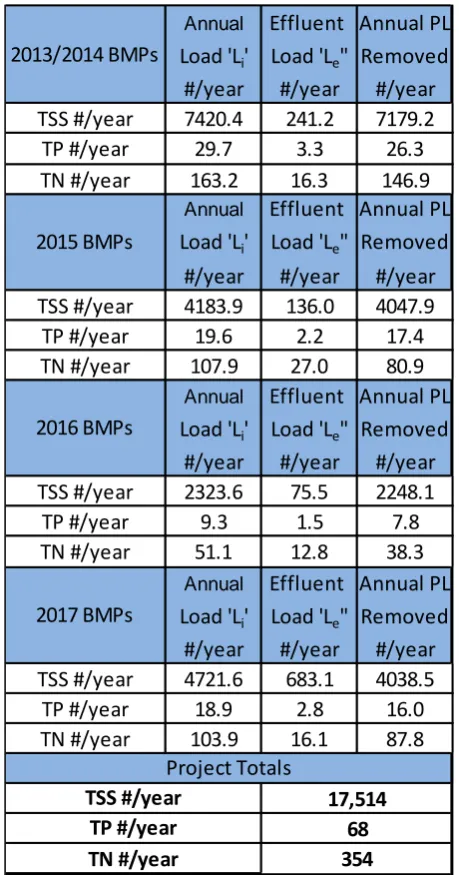
Table 3 summarizes the pollutant load reduction estimates for phase III of the project.
TABLE 3: POLLUTANT LOAD REDUCTION ESTIMATES FOR PHASE III INSTALLATIONS
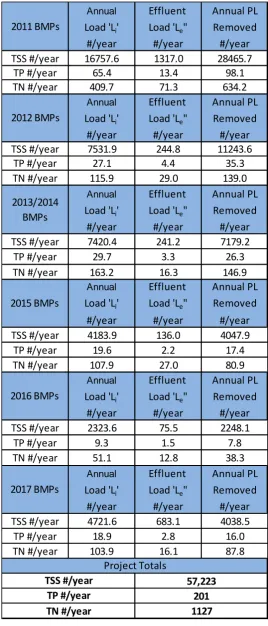
Table 4 summarizes the pollutant load reduction estimates for all phases (I, II and III) of the project.
Annual Effluent Annual PL
Load 'Li' Load 'Le" Removed
#/year #/year #/year TSS #/year 7420.4 241.2 7179.2 TP #/year 29.7 3.3 26.3 TN #/year 163.2 16.3 146.9
Annual Effluent Annual PL
Load 'Li' Load 'Le" Removed
#/year #/year #/year TSS #/year 4183.9 136.0 4047.9 TP #/year 19.6 2.2 17.4 TN #/year 107.9 27.0 80.9
Annual Effluent Annual PL
Load 'Li' Load 'Le" Removed
#/year #/year #/year TSS #/year 2323.6 75.5 2248.1 TP #/year 9.3 1.5 7.8 TN #/year 51.1 12.8 38.3
Annual Effluent Annual PL
Load 'Li' Load 'Le" Removed
#/year #/year #/year TSS #/year 4721.6 683.1 4038.5 TP #/year 18.9 2.8 16.0 TN #/year 103.9 16.1 87.8
TSS #/year 17,514
TP #/year 68
TN #/year 354
2013/2014 BMPs
2015 BMPs
2016 BMPs
2017 BMPs
TABLE 4: POLLUTANT LOAD REDUCTION ESTIMATES FOR PHASE ALL INSTALLATIONS
Annual Effluent Annual PL
Load 'Li' Load 'Le" Removed
#/year #/year #/year TSS #/year 16757.6 1317.0 28465.7
TP #/year 65.4 13.4 98.1 TN #/year 409.7 71.3 634.2
Annual Effluent Annual PL
Load 'Li' Load 'Le" Removed
#/year #/year #/year TSS #/year 7531.9 244.8 11243.6
TP #/year 27.1 4.4 35.3 TN #/year 115.9 29.0 139.0
Annual Effluent Annual PL
Load 'Li' Load 'Le" Removed
#/year #/year #/year TSS #/year 7420.4 241.2 7179.2 TP #/year 29.7 3.3 26.3 TN #/year 163.2 16.3 146.9
Annual Effluent Annual PL
Load 'Li' Load 'Le" Removed
#/year #/year #/year TSS #/year 4183.9 136.0 4047.9 TP #/year 19.6 2.2 17.4 TN #/year 107.9 27.0 80.9
Annual Effluent Annual PL
Load 'Li' Load 'Le" Removed
#/year #/year #/year TSS #/year 2323.6 75.5 2248.1
TP #/year 9.3 1.5 7.8
TN #/year 51.1 12.8 38.3
Annual Effluent Annual PL
Load 'Li' Load 'Le" Removed
A summary of IC and pollutant load reductions may be found in Table 5.
TABLE 5: SUMMARY OF IC AND PLR REDUCTIONS THROUGHOUT THE PROJECT
Objective 4: Project Monitoring
Summary of Objective 4 Activities
Deliverable 11
Hydrology
Urbanization and impervious surfaces typically reduce infiltration and alter the delivery of stormwater runoff to receiving waters. Urbanized areas modify natural drainage flow pathways and convey stormwater more quickly to receiving waters with far less water quality improvement than natural surfaces and flow paths. These urban stormwater conveyance systems tend to therefore increase peak flows which may then result in streambank erosion and alteration to stream geomorphology. Due to altered urban hydrology it becomes increasingly difficult to maintain stream habitat integrity. Furthermore, connected impervious cover has been found to decrease base (Hlas, 2012, Schueler 2009), flows in areas of moderately to heavily urbanized watersheds and increase temperatures in receiving waters further degrading aquatic habitat.
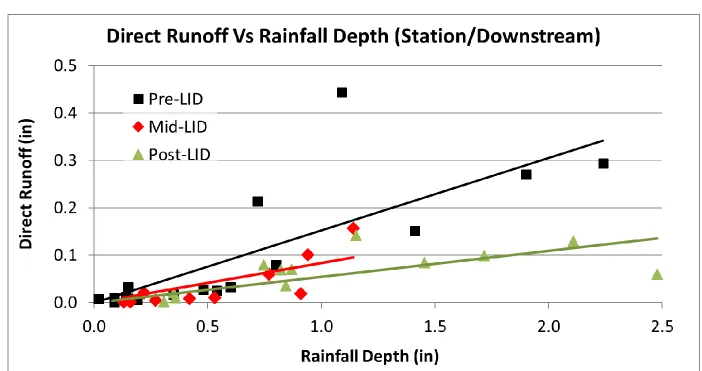
To measure the hydrologic project impacts, Aqua Troll 200 probes (manufactured by In-Situ Inc.) were used to monitor in stream water depths. Data was recorded every 15 minutes during the pre-LID, mid-LID and post-LID project periods. Stream gaging using the transect method was then performed at various stream stages at both the Roosevelt and Station locations. Stream gaging velocities were measured with a Marsh McBirney Current Meter. Mean velocities were measured by the six-tenths-depth-method and discharge was computed using the midsection method (USBR, 1975). From the stream gaging events, a stage-discharge calibration curve was developed (Figure 6) from which the real-time measured
Phase Number of
Installations Disconnected IC TSS #/year TP #/year TN #/year
III 9 10.0 17514 68 354
The observed Berry Brook hydrology data was also analyzed on a storm event basis for the pre-LID (July-December 2011), mid-LID (January 2012 - August 2016), and post-LID (September - December 2016) time periods. Berry Brook storm event hydrograph parameters were then compared between these time periods. Direct runoff hydrographs were calculated using a constant slope base flow separation from the total runoff hydrographs for each storm event. The area under the direct surface runoff hydrographs is the volume of runoff. The volume of runoff divided by the watershed area is the runoff depth (effective precipitation). Implementation of green infrastructure should demonstrate that less runoff (effective precipitation) occurs for the same precipitation depth.
According to the impervious cover model, as BMPs are implemented throughout the watershed the hydrological regime should trend toward lower thresholds of excess precipitation. In conventional models this is demonstrated by a declining curve number (CN).
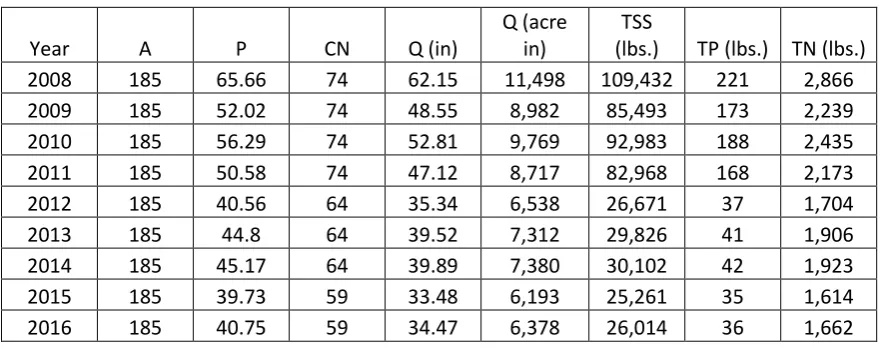
The Curve Number method was used to assess the effect of the GI implementation in Berry Brook. In this case, from Figure 6, at a precipitation depth of one inch (P), the direct runoff (Q) was read for each watershed EIC condition. Then for each pair of P-Q values, the potential maximum soil storage (S) was computed assuming initial abstraction as 5% of S (Lim, et al, 2006). From S, the Curve Number (CN) were developed (USDA, 2004). A high CN means much of the rainfall that fell from the sky runs off. As shown in Tables 6-7, it is evident that the Berry Brook watershed demonstrated dramatic reductions in runoff as GI was implemented.
TABLE 6: RESULTS FOR BERRY BROOK AT STATION DRIVE 1-INCH STORM, IA = 0.05 S
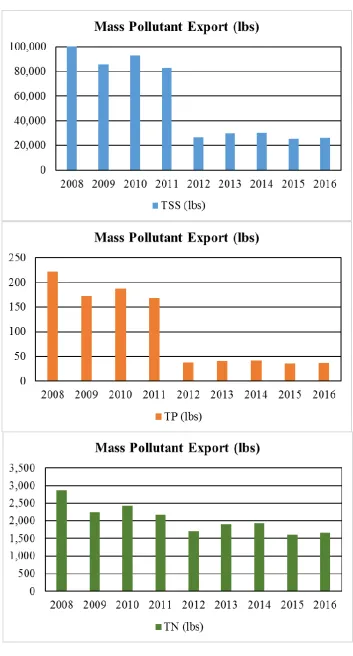
TABLE 7: EXCESS RUNOFF AND ANNUAL POLLUTANT EXPORT BASED ON CHANGING LAND USE CONDITIONS (CN)
AND ANNUAL PRECIPITATION DEPTHS (P) THROUGHOUT THE STUDY PERIOD.
Year A P CN Q (in)
Q (acre in)
TSS
(lbs.) TP (lbs.) TN (lbs.) 2008 185 65.66 74 62.15 11,498 109,432 221 2,866 2009 185 52.02 74 48.55 8,982 85,493 173 2,239 2010 185 56.29 74 52.81 9,769 92,983 188 2,435 2011 185 50.58 74 47.12 8,717 82,968 168 2,173 2012 185 40.56 64 35.34 6,538 26,671 37 1,704 2013 185 44.8 64 39.52 7,312 29,826 41 1,906 2014 185 45.17 64 39.89 7,380 30,102 42 1,923 2015 185 39.73 59 33.48 6,193 25,261 35 1,614 2016 185 40.75 59 34.47 6,378 26,014 36 1,662
Water Quality
The goal of this objective was to assess the impact of urban watershed stormwater management retrofits that included the implementation of: innovative stormwater controls, wetland restoration, and stream restoration. The output of the research component of this project is the characterization of the water quality and hydrological impacts in the receiving stream during pre-retrofit, mid-project and post-project activities and the dissemination of this information to stakeholders.
As part of this objective, routine monitoring and sampling was conducted in Berry Brook using automated samplers and flow monitoring equipment (QAPP on file at NHDES). The water quality assessment is based on samples collected from twenty-one (21) qualified storm events, at two distinct instream locations. The upstream monitoring location immediately follows the headwaters at the outlet of the Roosevelt Avenue culvert. The downstream monitoring location is near Station Drive, approximately 500 feet prior to discharge to the Cocheco River.
Storm event characteristics (Table 8) such as total rainfall depth, peak rainfall intensity, and stream depth recorded at 5-minute intervals provide water quantity data throughout each qualified storm event.
TABLE 8: RAINFALL DATA FROM QUALIFIED STORM EVENTS
Storm Date Total Rainfall (in) Peak Intensity (in/hr.) PRE-RETROFIT
6/11/2011 1.13 0.24 6/18/2011 0.15 0.15 7/6/2011 0.10 0.04 7/13/2011 0.29 0.24 7/25/2011 0.11 0.04 7/26/2011 0.07 0.06 7/29/2011 0.27 0.09 8/6/2011 0.55 0.15 8/9/2011 0.53 0.20 8/15/2011 1.96 0.27 9/6/2011 0.24 0.06
MINIMUM 0.07 0.04
MEDIAN 0.27 0.15
MAXIMUM 1.96 0.27
MID-PROJECT
10/19/2012 0.92 0.24 11/8/2012 0.38 0.14 11/13/2012 0.15 0.07 12/2/2012 0.11 0.04 12/7/2012 0.24 0.08
MINIMUM 0.11 0.04
MEDIAN 0.24 0.08
MAXIMUM 0.92 0.24
POST-PROJECT
10/21/2016 2.73 1.16 10/27/2016 1.87 0.30 4/21/2017 0.76 0.11 5/1/2017 0.75 0.21 5/13/2017 1.66 0.24
MINIMUM 0.75 0.11
MEDIAN 1.66 0.24
Table 8 lists the rainfall data associated with the 21 qualified storms monitored (11 pre-retrofit, 5 mid-project, and 5 post-project). With the relative small number of monitored storm events over rapidly changing land use characteristics there is naturally some difficulty in determining the effectiveness of LID implementation on overall water quality. The pre-retrofit phase covers a typical distribution of rainfall depths and peak rainfall intensities during spring and summer months. The mid-project phase has a typical distribution of rainfall depths and intensities, but is concentrated in the fall season. The post-project phase covers a distribution of larger rainfall depth and more intense rainfall events and are spread over fall and early spring seasons. The disparity in annual and seasonal rainfall characteristics is common in environmental data, and are difficult to control beyond the selection or targeting of seasonal coverage. As with many stormwater studies the relative low number of qualified events must be considered when evaluating this data set for prediction of long-term trends.
The event mean concentration (EMC) and water quantity data were used to assess stream water quality for individual rainfall events as well as over the course of the three project phases. Water quality parameters included total suspended sediments (TSS), total zinc (TZn), total nitrogen (TN), which includes dissolved inorganic nitrogen (nitrate/nitrite, ammonia) (DIN), and total Kjeldahl nitrogen, and finally total phosphorous (TP). Selection of parameters for routine analysis is based on initial constituent characterization performed over the past six years by UNHSC. Laboratory analysis of water samples were performed by Absolute Resource Associates in Portsmouth, New Hampshire, a certified laboratory for drinking water and waste water.
Table 9 presents median EMC values collected over the course of the project separated by project phase. A flow-weighted composite sampling regimen was utilized for collection of all samples. The analytical results of flow-weighted composite samples provide instream water quality data in the form of event mean concentrations (EMCs).
sediments and sediment associated pollutants, such as phosphorus (Figure 6.b), at the downstream monitoring location (Station) during the post-project phase. The higher TP (Figure 6.c) and TZn (Figure 6.d) EMC values, which are typically sediment bound pollutants, provide additional verification of this assumption.
The disproportionate rainfall depths appear to have less of an effect on instream nitrate concentrations (Figure 6.e), which remain relatively unchanged between monitoring location and across project phases. The slight reduction in nitrate (40% difference) at the upstream location (Roosevelt) between pre- and post- phases may indicate the effectiveness of the denitrifying components of the systems constructed in Berry Brook headwaters. These systems include a subsurface gravel wetland and standard wetland complex, which are the only two systems constructed in this project that target the removal of inorganic nitrogen species. The median TN values (Figure 6.f) show a slight decrease (37%) at the upstream location and a slight increase (-31%) at the downstream location (Station). The increase in TN may be affected by the larger rainfall depths due to the mobilization of organic material and subsequent concentrations of total nitrogen from decaying vegetative matter.
TABLE 9: IN-STREAM WATER QUALITY DATA FOR 5 PARAMETERS AT 2 SAMPLING LOCATIONS ALONG BERRY BROOK PRESENTED IN ORDER FROM HEADWATERS (ROOSEVELT) TO TAILWATER (STATION) FOR EACH PROJECT PHASE. TABULATED VALUES INCLUDE MEDIAN EVENT MEAN CONCENTRATION (EMC) FOR EACH PROJECT PHASE AND PERCENT DIFFERENCE FOR MID- AND POST-PROJECT EMCS COMPARED TO PRE-RETROFIT EMC.
Pre Mid Post Pre Mid Post Pre Mid Post Pre Mid Post Pre Mid Post
Median EMC 190 40 100 0.02 0.01 0.03 0.3 0.2 0.2 1.8 1.9 1.2 0.36 0.10 0.10
% Difference 130% 62% 67% -40% 40% 40% -8% 37% 112% 112%
Median EMC 45 17 140 0.02 0.01 0.05 0.3 0.3 0.3 1.1 1.2 1.5 0.09 0.02 0.28
% Difference 93% -103% 67% -86% 0% 0% -4% -31% 127% -103%
112% -20% 67% -63% 20% 20% -6% 3% 120% 5%
Total Phosphorus (mg/l)
Station
Average % Difference
TSS (mg/l) Zinc (mg/l) Nitrate-N (mg/l) Total Nitrogen (mg/l)
Due to the fact that rainfall depth is an uncontrolled variable that drives water chemistry and subsequent pollutant concentrations rainfall depth weighed EMCs were calculated. In order to provide an equivalent assessment across each project phase the median EMC values were divided by the median rainfall depths producing a weighted EMC per inch of rainfall depth. This data is presented in Table 9 and Figure 6 and is separated by project phase. By weighting the EMCs the data can more accurately be compared in consideration of both the water quality and water quantity values. This provides a more accurate representation of pollutant concentrations monitored during each project phase. The weighted EMC values for TSS (Figure 7.b), TP (Figure 7.c), and TZn (Figure 7.d) show a decrease in these parameters though each project phase.
TABLE 10: WEIGHTED IN-STREAM WATER QUALITY DATA WHICH DIVIDES THE MEDIAN EVENT MEAN CONCENTRATION (EMC) BY THE MEDIAN RAINFALL DEPTH PER PROJECT PHASE. THIS CALCULATION RESULTS IN PARAMETER CONCENTRATION PER INCH OF RAINFALL.
Pre Mid Post Pre Mid Post Pre Mid Post Pre Mid Post Pre Mid Post
Weighted EMC 704 167 60 0.07 0.04 0.02 1.1 0.8 0.1 6.5 7.9 0.7 1.31 0.42 0.06
% Difference 123% 168% 56% 121% 29% 161% -20% 160% 104% 182%
Weighted EMC 167 69 85 0.07 0.04 0.03 1.1 1.3 0.2 4.1 4.8 0.9 0.33 0.08 0.17
% Difference 83% 65% 56% 84% -12% 144% -16% 127% 120% 65%
103% 117% 56% 103% 8% 152% -18% 144% 112% 124%
TSS (mg/l) / (in) Zinc (mg/l) / (in) Nitrate-N (mg/l) / (in) Total Nitrogen (mg/l) / (in) Total Phosphorus (mg/l) / (in)
Roosevelt
Station
Temperature
As urbanization and build-out occurs, the thermal regime of the surrounding environment is altered. In the summers, heated stormwater runoff flows into receiving waters where it mixes, and potentially increases the base temperature of the surface water in lakes, streams, and estuaries. The amount of heat transferred, and the degree of thermal pollution is of great importance for fisheries management and the ecological integrity of receiving waters. Coldwater fisheries in particular are most sensitive to thermal pollution.
FIGURE 10: SUMMER PERIOD CUMULATIVE DEGREE DAYS OVER 65F THRESHOLD THROUGHOUT THE PROJECT PERIOD.
O
bjective 5: Operation and MaintenanceOperation and maintenance guidelines and checklists for all classes of BMPs implemented throughout the project period have been developed and provided to City staff.
Deliverable 12: The O&M documentation is on file with the City and is provided in appendix B.
Objective 7 (6): Provide Grant and Project management
Deliverable 13: All interim progress reports are on file with NHDES.
CONCLUSIONS AND RECOMMENDATIONS
involved with decisions/outreach such that they “own” the solution, and implementing strategies at the local scale in the context of the watershed. While this was not a required task in the project the outcomes weigh heavily on the future NPS management decisions in the city and region. While it’s difficult to measure and quantify what municipal ownership and investment in NPS management decisions look like this project not only led to the reduction of EIC to the 10% target, but changed the way stormwater BMPs where designed and how sites were selected. Outputs include at least three new types of stormwater controls that are more maintainable and ultimately more cost effective for the community. This re-invention and ownership process is one of the most unique and impactful developments of this project, and has sustained implementation efforts as a matter of routine within the community beyond the term and scope of the project.
Currently much of the environmental investigation in New Hampshire and other states has gone into identifying impairment locations, pollutant stressors, and their respective sources. This information is important as we begin to understand the environmental restoration challenges that lie ahead. Water resources and in particular, NPS pollution and stormwater management, is an area that is targeted for significant investments in the years to come. To move forward on this objective there needs to be a clear strategy that addresses the financial and municipal ownership aspects as well as optimized restoration approaches. Systems need to be well designed and effective, but they also need to be amenable to the long-term municipal owners. Often there is disproportionate focus on the technical elements and the loading models and not enough effort on the long-term operation and maintenance of the systems.
planning efforts and optimization of system sizing and configuration need to be flexible so as to accommodate and capitalize on the dynamic nature of the process of adoption and installation. Flexibility and innovation are not common words in traditional watershed management plans where solutions are predetermined and siting within the watershed already optimized. It is an interesting aside that while all those traditional planning efforts were completed numerous times throughout this project few, if any, installations actually were installed where and as originally designed. The reasons for this are varied and plentiful. Some are predictable such as constraints around property ownership, rights of ways, and difficulties with acquiring maintenance easements. Others are confounding and difficult to plan for such as the existence of relic structures, utilities that were not mapped or known, contaminated sediments and uncovering historic artifacts that need documentation and proper permitting.
work and improvements to infrastructure, once the shift is made future upgrades can be more easily adapted to achieve resiliency benefits.
Resilience is defined as the capacity of an ecosystem to absorb repeated disturbances or shocks and adapt to change without continually degrading and fundamentally switching to an alternative stable state (Holling, 1973). Precipitation patterns are changing. Overall, our region is experiencing changing precipitation and more extreme storm events. Between 1996 and 2014, extreme precipitation (two inches or more in one day) in the Northeast was 53% higher than it was in the previous 94 years (PREP, 2018) The 2006 Mother’s Day Storm alone greatly increased levels of dissolved organic matter and brought salinity levels close to zero for five days. Annual precipitation is expected to increase by as much as 20 percent by the end of the 21st century compared to the late 20th century, and extreme precipitation events are projected to increase in frequency and in the amount of precipitation produced (CRHC, 2016). Despite these troubling patterns the spread of impervious cover continues to threaten coastal communities like Dover. Between 1990 and 2010, impervious surfaces in our watershed increased by 120% (UNHSC, 2015) and have continued to increase over the last five years. The city of Dover had the largest increase in IC between 2010-2015 with an addition of 56 acres of IC or 11.2 acres per year (PREP, 2018). These changes are indeed threats to our water quality and standard of living and the results achieved through these efforts demonstrate the potential to build resilience in the landscape to these stressors increasing and fortifying community resiliency.
REFERENCES/CITATIONS
Clark, W.C. (2010). Sustainable development and sustainability science. In report from Toward a Science of Sustainability conference. Airlie Center, Washington, DC.
Deacon, J. R., Soule, S. A., Smith, T. E., Geological Survey (U.S.), and New Hampshire. Dept. of Environmental Services. (2005). "Effects of urbanization on stream quality at selected sites in the seacoast region in New Hampshire, 2001-03." U.S. Dept. of the Interior, U.S. Geological Survey, Reston, Va.
Holling, C.S., (1973). Resilience and stability of ecological systems. Annu. Rev. Ecol. Syst. 4, 1–23.
Lim, K. J., Engel, B. A., Muthukrishnan, S., and Harbor, J. (2006). Effects of initial abstraction and urbanization on estimated runoff using CN technology. J. Am. Water Resource Assoc., 42 (3), 629–643.
New Hampshire Coastal Risk and Hazards Commission (2016). Preparing New Hampshire for Projected Storm Surge, Sea-Level Rise and Extreme Precipitation. http://www.nhcrhc.org/wp-content/uploads/2016-CRHC-final-report.pdf
Piscataqua Regional Estuaries Partnership (PREP) (2018). State of our estuaries 2018. University of New Hampshire, Durham, NH. Available at: file:///C:/Users/jjhoule/Downloads/SOOE_2018_web%20(1).pdf
Schueler, T. R. (1994). "The Importance of Imperviousness." Watershed Protection Techniques, 1(3).
Schueler, T. R., Fraley-McNeal, L., and Cappiella, K. (2009). "Is Impervious Cover Still Important? Review of Recent Research." Journal of Hydrologic Engineering, 14(4), 309-315.
U.S. Dept. of Agriculture (USDA). (1986). Urban hydrology for small watersheds. Technical Release 55, Natural Resources Conservation Service (NRCS), Washington, DC.
U.S. Dept. of Agriculture (USDA). (2004). Estimation of direct runoff from storm rainfall. Chapter 10, part 630, National engineering handbook, USDA Natural Resource Conservation Service (NRCS), Washington, DC.
University of New Hampshire Stormwater Center, (2015). Minimizing Environmental Impacts Through Stormwater Ordinance and Site Plan Regulation, a final report to the US Environmental Protection Agency Pollution Prevention Program, Boston MA. https://www.unh.edu/unhsc/sites/default/files/media/unhsc_p2_final_report_12-24-15.pdf