Comparative Analysis of Propagation Path loss
Models with Field Measured Data
Purnima K. Sharma R.K.Singh
Doctoral candidate Professor
UTU,Dehradun(India) KEC ,Dhawarahat(India)
Abstract –The propagation path loss models may give different results if they are used in different environment other than in which they were designed. In this paper we compare the different path loss propagation models with measured field data. For comparative analysis we use the log distance path loss model, Stanford University Interim (SUI) Model, Hata model, Okumura’s Model, COST231 Extension to Hata Model and ECC-33 model along with the field measured data. The field measurement data is taken in urban(high density region), sub urban(medium density region) and rural(low density region) environments in INDIA at 900 MHz &1800 MHz frequency with the help of spectrum analyzer. After analyzing the results COST-231 and SUI Model shows the better results in all the three environments particularly in urban and sub urban environments.
Keywords— Path loss, Stanford University Interim (SUI) Model, Hata Model, Okumura’s Model, Received signal strength.
I. INTRODUCTION
The path loss propagation models have been an active area of research in recent years. Path loss is unwanted signal strength reductions that signal suffers when propagating from transmitter to receiver. the losses present in a signal during propagation from base station to receiver may be classical and already exiting . General classification includes three forms of modeling to analyze these losses:
General classification
Deterministic Statistical Empirical (Maxwell’s Eq.) (Probability) (Measured data)
In the above models Deterministic models are better to find the propagation path losses. This model uses Maxwell’s equations along with reflection and diffraction laws. The Statistical models Uses Probability analysis By finding the probability density function. The empirical models uses Existing equations obtained from results of several measurement efforts .this model also gives very accurate results but the main problem with this type of model is computational complexity. The field measurement data was taken in the urban, sub urban and rural environments of Narnaul city (State: Haryana, INDIA).
II. PROPAGATION PATH LOSS MODELS A.Log-distance Path Loss Model
Theoretical and measurement based propagation models indicate that average received signal power decreases logarithmically with distance in radio channels.the expression for path loss in this model is [1]:
0
( )
n d PL d
d
(1)
0
0
( ) ( ) 10 log d
PL dB PL d n d
(2) Where ‘n’ is path loss exponent
B. Stanford University Interim (SUI) Model
The proposed standards for the frequency bands below 11 GHz contain the channel models developed by Stanford University, namely the SUI models. Note that these models are defined for the Multipoint Microwave Distribution System (MMDS) frequency band which is from 2.5 GHz to 2.7 GHz. Their applicability to the 3.5 GHz frequency band that is in use in the UK has so far not been clearly established [4]. The SUI models are divided into three types of terrains1, namely A, B and C. Type A is associated with maximum path loss and is appropriate for hilly terrain with moderate to heavy foliage densities. Type C is associated with minimum path loss and applies to flat terrain with light tree densities. Type B is characterized with either mostly flat terrains with moderate to heavy tree densities or hilly terrains with light tree densities. The basic path loss equation with correction factors is presented in [2,3].
10 0
10 log d f h
PL A X X s
d
for
d
>d
0(3)
where, d is the distance between the Access Points (AP) and the Customer Premises Equipment (CPE) antennas in meters, d0 = 100 m and s is a log normally distributed factor that is used to account for the shadow fading owing to trees and other clutter and has a value between 8.2 dB and 10.6 dB [2]. The other parameters are defined as,
(4)
b b
c
a bh h
(5)
where, the parameter hb is the base station height above ground in metres and should be between 10 m and 80 m. The constants used for a, b and c are given in Table II. The parameter γin (5) is equal to the path loss exponent. For a given terrain type the path loss exponent is determined by hb.
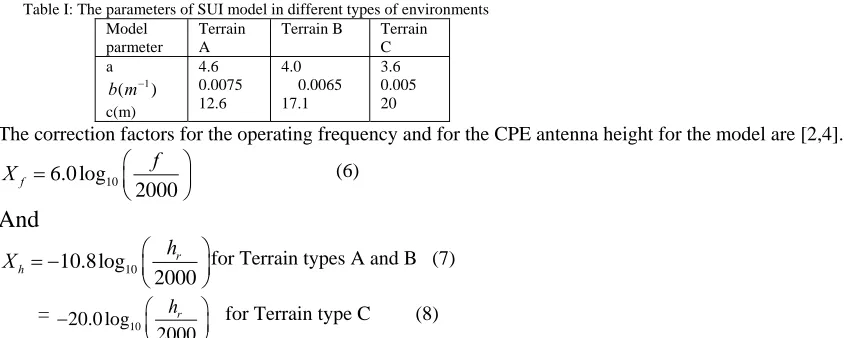
Table I: The parameters of SUI model in different types of environments Model
parmeter
Terrain A
Terrain B Terrain C a
1
( )
b m
c(m) 4.6 0.0075 12.6 4.0 0.0065 17.1 3.6 0.005 20
The correction factors for the operating frequency and for the CPE antenna height for the model are [2,4]. 10
6.0 log
2000
f
f
X
(6)
And
10 10.8log 2000 r h hX
for Terrain types A and B (7) = 10 20.0 log 2000 r h
for Terrain type C (8)
Where, f is the frequency in MHz and hr is the CPE antenna height above ground in meters. The SUI model is used to predict the path loss in all three environments, namely rural suburban and urban.
C. Okumura’s Model
One of the most general models for signal prediction in large urban macro cells is Okumura’s model [5]. This model is applicable frequency ranges of 150-1920 MHz and over distances of 1-100 Km. Okumura used extensive measurements of base station-to-mobile signal attenuation to develop a set of curves giving median attenuation relative to free space of signal propagation in irregular terrain.
The base station heights for these measurements were 30-100 m, the upper end of which is higher than typical base stations today. The path loss formula of Okumura is given by
50( ) ( , ) ( f) ( )r AREA
L dB Lf Amu f d G h G h G
(9)
and GAREA is the gain due to the type of environment. The values of Amu and GAREAare obtained from Okumura’s
empirical plots [1,5]. Okumura derived empirical formulas for G(ht) and G(hr) as 10
( ) 20 log ,30 < <1000m 200
t
t h t
G h m h (10)
10
( ) 10 log , 3
3
r
r h r
G h h m
(11)
10
20 log ,3 < <10m 3
r
r
h m h
(12)
Correction factors related to terrain are also developed in [5] that improve the model accuracy. Okumura’s model has a 10-14 dB empirical standard deviation between the path loss predicted by the model and the path loss associated with one of the measurements used to develop the model. Okumura’s model is wholly based on measured data and doesn’t provide any analytical explanation. The major disadvantage with the model is its slow response to rapid changes in the terrain; therefore the model is fairly good in urban and suburban aeas, but not good in rural area.
D. Hata Model
The Hata model [6] is an empirical formulation of the graphical path loss data provided by Okumura and is valid over roughly the same range of frequencies, 150-1500 MHz. This empirical model simplifies calculation of path loss since it is a closed-form formula and is not based on empirical curves for the different parameters. The standard formula for median path loss in urban areas under the Hata model is
50,urban 10 c 10 te
re te 10
L (dB) = 69.55+26.16 log (f )-13.82 log (h )-a (h )+(44.9-6.55 log10(h )) log (d).
(13)
The parameters in this model are the same as under the Okumura model, and a(hre) is a correction factor for the mobile antenna height based on the size of the coverage area. For small to medium sized cities, this factor is given by [1,6]:
r 10 c r 10 c
a(h ) = (1.1 log (f ) - 0.7)h - (1.56 log (f ) -0.8)dB
(14) and for larger cities at frequencies
f
c > 300 MHz by2
r 10 r
a(h ) = 3.2(log (11.75h ) - 4.97 dB. (15)
Corrections to the urban model are made for suburban and rural propagation, so that these models are,
respectively, 2
50,suburban 50,urban 10 c
L (dB) = L (dB) - 2[log (f /28)] - 5.4 (16)
2 50,rural 50,urban 10 c
10 c
L (dB) = L (dB) - 4.78[log (f )] +
18.33log (f ) - K
(17)
Where K ranges from 35.94 (countryside) to 40.94 (desert). Hata’s model does not provide for any path specific correction factors, as is available in the Okumura model. The Hata model well-approximates the Okumura model for distances d > 1 Km. Thus, it is a good model for first generation cellular systems, but does not model propagation well in current cellular systems with smaller cell sizes and higher frequencies. Indoor environments are also not captured with the Hata model.
E. COST231 Extension to Hata Model
10 10
10 10
PL=46.3+33.9log ( ) 13.82 log ( ) (44.9 6.55 log ( )) log
b m
b m
f h ah
h d c
(18)
where, f is the frequency in MHz, d is the distance between AP and CPE antennas in km, and hb is the AP antenna height above ground level in metres. The parameter cm is defined as 0 dB for suburban or open environments and 3 dB for urban environments. The parameter ahmis defined for urban environments as [8]
2
m 10
ah = 3.20(log (11.75hr)) -4.97, for f > 400 MHz (19) for suburban or rural (flat) environments,
m 10 r 10
ah = (1.1 log f - 0.7)h - (1.56 log f - 0.8) (20) where, hr is the CPE antenna height above ground level.
Observation of (18) to (20) reveals that the path loss exponent of the predictions made by COST-231 Hata model is given by, ncost (44.9 6.55 log ( )) 10 10 hb (21)
To evaluate the applicability of the COST-231 model for the 3.5 GHz band, the model predictions are compared against measurements for three different environments namely, rural (flat), suburban and urban.
F. ECC-33 model
The ECC 33 path loss model, which is developed by Electronic Communication Committee (ECC), is extrapolated from original measurements by Okumura and modified its assumptions so that it more closely represents a fixed wireless access (FWA) system. The path loss model is defined as [4],
s m t r
PL(dB) = Af +Ab - G - G (22)
Where,
Af
s is free space attenuation,Ab
m is basic median path loss,G
tis BS height gain factor andG
ris received antenna height gain factor.They are individually defined as,
2
2 92.4 20 log( ) 20 log
20.41 9.83log( ) 7.894 log( ) 9.56[log( )] log( )[13.98 5.8(log( )) ]
200
fs
bm
b t
A d f
A d f f
h
G d
(23)
for medium city environments,
42.57 13.7 log( ) log(
) 0.585
r m
G f h (24)
Where, f is frequency in GHz,
The performance analysis is based on the calculation of received signal strength, path loss between the base station and mobile from the propagation model. The GSM based cellular d is distance between base station and mobile (km) hb is BS antenna height in meters and hm is mobile antenna height in meters.
III. COMPARSION WITH MEASUREMENTS
Fig.1 Measured path loss in different enviroment
Fig.2 Comarsion of path loss models with measurents from a urban environment
Fig.4 Comarsion of path loss models with measurents from a rural environment
IV. CONCLUSION
Here we discussed different models and calculated path loss in three different environments (urban, suburban and rural) using MATLAB Software and those results are compared with the field measurement data taken at three different environments of
Narnaul city (State: Haryana,INDIA). The obtained path losses are graphically plotted for the better conclusion using the same software. By observing the graphical representation we concluded that ECC-33 and SUI models are giving the best results in urban area. ECC-33, SUI and COST-231 models are showing better results in sub urban area. HATA and Log-distance path loss models are also giving better results in rural areas. Okumara model is showing better results in urban and sub urban environments.
REFERENCES
[1] T.S Rappaport, Wireless communications –Principles and practice, 2nd Edition , Prentice Hall, 2001.
[2] V.Erceg, K V S Hari, et al., “Channel models for fixed wireless applications,” tech. rep., IEEE 802.16 Broadband wireless access working group, jan-2001
[3] V. Erceg, L. J. Greenstein, et al., “An empirically based path loss model for wireless channels in suburban environments,” IEEE
Journal on Selected Areas of Communications, vol. 17, pp. 1205–1211, July 1999.
[4] V.S. Abhayawardhana, I.J. Wassell, D. Crosby, M.P. Sellars, M.G. Brown”Comparison of empirical propagation path loss models for
fixed wireless access systems”Vehicular Technology Conference, 2005. IEEE Date: 30 May-1 June 2005 Volume: 1, On page(s):
73- 77 Vol. 1
[5] T. Okumura, E. Ohmori, and K. Fukuda, “Field strength and its variability in VHF and UHF land mobile service,” Review Electrical Communication Laboratory, Vol. 16, No. 9-10, pp. 825–873, Sept.-Oct. 1968.
[6] M. Hata, “Empirical formula for propagation loss in land mobile radio services,” IEEE Trans. Vehic. Technol., Vol VT-29, No. 3, pp. 317–325, Aug. 1980.
[7] COST Action 231, “Digital mobile radio towards future generation systems, final report,” tech. rep., European Communities, EUR 18957, 1999.
[8] H. R. Anderson, Fixed Broadband Wireless System Design. John Wiley & Co., 2003.
Mrs K. Purnima Sharma was born on 2nd june1983 in Eluru, Andhra Pradesh (India). She received her M.Tech.degree in Communication and Signal Processing Engineering from NAGARJUNA UNIVERSITY (A.P.),India. She is a Associate Member of the IETE. She has published several Research papers in national and international journals/conferences. She is presently research scholar in UTTARAKHAND TECHANICAL UNIVERSITY, Dehradun (INDIA) . Her present research interest is in Image Processing and Wireless Communication.
Dr. R.K. Singh Professor, KEC, Dwarahat, Almora , Jointly submitting research and development project in
UCOST, Uttranchal.He is member of academic staff of Kumaon Engineering College, Dwarahat, Almora, where he