University of New Hampshire
University of New Hampshire Scholars' Repository
Honors Theses and Capstones Student Scholarship
Spring 2018
Evaluation of Cracking Indices for Asphalt
Mixtures Using SCB Tests at Different
Temperatures and Loading Rates
Katie E. Haslett
University of New Hampshire, Durham, [email protected]
Follow this and additional works at:https://scholars.unh.edu/honors Part of theCivil and Environmental Engineering Commons
This Senior Honors Thesis is brought to you for free and open access by the Student Scholarship at University of New Hampshire Scholars' Repository. It has been accepted for inclusion in Honors Theses and Capstones by an authorized administrator of University of New Hampshire Scholars' Repository. For more information, please [email protected].
Recommended Citation
Haslett, Katie E., "Evaluation of Cracking Indices for Asphalt Mixtures Using SCB Tests at Different Temperatures and Loading Rates" (2018).Honors Theses and Capstones. 380.
Evaluation of Cracking Indices for Asphalt Mixtures
Using SCB Tests at Different Temperatures and
Loading Rates
Katie Haslett
University of New Hampshire
Honors Thesis Spring 2018
Table of Contents
ABSTRACT ... 5
INTRODUCTION ... 6
METHODOLOGY ... 7
Fracture Energy (Gf) ... 10
Flexibility Index (FI)... 10
Fracture Strain Tolerance (FST) ... 10
Cracking Resistance Index (CRI) ... 10
Toughness Index (TI) ... 11
Nflex Factor ... 11
RESULTS AND DISCUSSION ... 12
Comparing use of Line-Load Displacement and Crack Mouth Opening Displacement for Calculation of Fracture Indices ... 12
Effect of Test Temperature and Loading Rate ... 14
SUMMARY AND CONCLUSIONS ... 15
ACKNOLEWGEMENTS ... 16
REFERENCES ... 17
APPENDICES ... 19
SCB Load-Displacement Curves VA Mixture ... 19
List of Tables
Table 1: Summary tested mixtures and test parameters (loading rates and temperature). ... 7 Table 2: Line-load displacement comparison of VA mixtures for all cracking index at varying test temperature and loading rate combinations (green to red represents best to worst
performing). ... 12 Table 3: CMOD comparison of VA mixtures for all cracking index at varying test temperature and loading rate combinations (green to red represents best to worst performing). ... 13 Table 4: Line-load displacement comparison of VT mixtures for all cracking index at varying test temperature and loading rate combinations (green to red represents best to worst
List of Figures
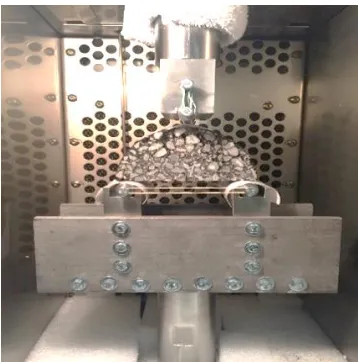
Figure 1: Typical SCB set in environmental chamber of the testing machine. ... 7
Figure 2: Example of ratio based method to determine trial testing conditions using VA 20% RAP mixture [3]. ... 8
Figure 3: Example of dynamic modulus data used to determine loading rate for different test temperatures [3]. ... 9
Figure 4: Typical load-displacement curve generated from SCB test. ... 9
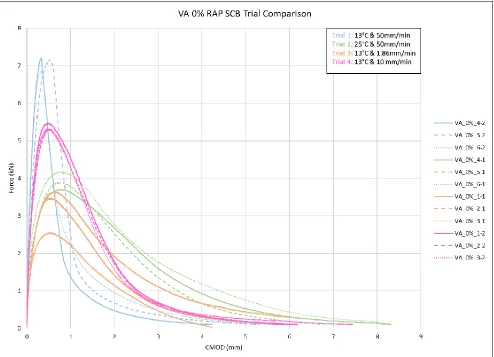
Figure 5: SCB load-displacement curves for VA 0% RAP mixtures. ... 19
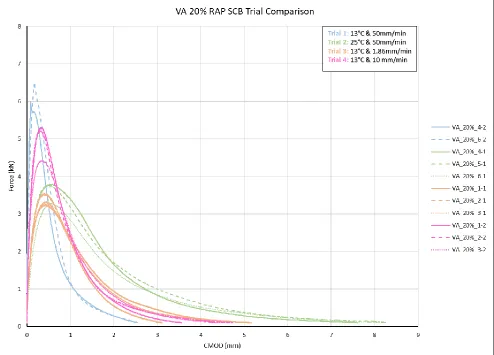
Figure 6: SCB load-displacement curves for VA 20% RAP mixtures. ... 20
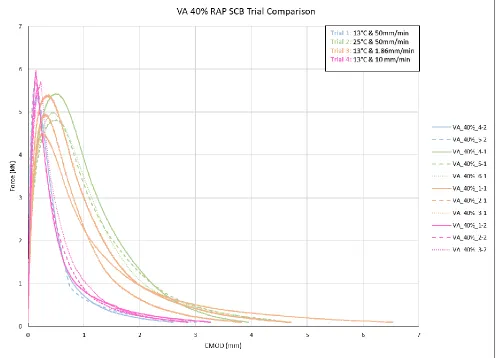
Figure 7: SCB load-displacement curves for VA 40% RAP mixtures. ... 21
Figure 8: SCB load-displacement curves for VT 20% RAP mixtures... 22
ABSTRACT
In recent years, there has been a shift towards implementing performance based
pavement specifications (PBPS) to increase reliability of asphalt concrete mixture specifications and enhance service lives of roadways. Several of the performance indices used in PBPS are based on the asphalt mixture fracture tests. There is an increasing need for a better understanding the effects of temperature and loading rate interdependency for fracture properties of asphalt mixtures. The goal of this study is to build upon previous work conducted during a Summer Undergraduate Research Program (SURF) project entitled, “Exploration of Temperature and Loading Rate Interdependency for Fracture Properties of Asphalt Mixtures,” as well as to incorporate ongoing research studies at the University of New Hampshire (UNH). There are many proposed fracture indices including Fracture Energy (Gf), Illinois Flexibility Index (FI),
Toughness Index (TI), Nflex, and Fracture Strain Tolerance (FST). The objective of this study is to evaluate different fracture indices and their variations with changes in test temperature and loading rates. Results from Semi-Circular Bend (SCB) fracture tests on five asphalt mixtures (from Vermont and Virginia) are being evaluated. All mixtures represent same aggregate maximum sizes and consist of varying amounts of Reclaimed Asphalt Pavement (RAP). Conclusions will be drawn on the effectiveness of each fracture index to distinguish and appropriately rank mixtures as well as on the variations of these indices with changes in test temperature and loading rates. On basis of this study, use of crack mouth opening displacements for fracture index calculations is recommended obtain better distinction of cracking
performances between mixtures.
INTRODUCTION
Every four years, the American Society of Civil Engineering releases a report card scoring America’s Infrastructure. The most recent infrastructure report card was released in 2017, with an overall rating of America’s infrastructure as a D-. The overall grade is based on several categories such as, drinking water, energy, bridges, transit and roads. The US road network system received a grade of a D. Similar to the national report card, New Hampshire has also adopted the same report card system. In 2017, New Hampshire’s received an infrastructure report card score was a C-. Per the NH Infrastructure report card grading system, a C
corresponds to mediocre performance with the network in fair to good condition, however it is deteriorating and requires attention. A grade of a D corresponds to infrastructure in poor to fair condition and is generally rated as being below standard and approaching the end of its service life [1, 2]. There is an increasing need to address the aging road network at both the state and national level.
In recent years the asphalt industry is shifting towards a performance based specification system to improve the service life of roads. Developing a greater understanding of fracture performance at low and intermediate temperatures of asphalt concrete mixtures is a critical part of this process. Data acquired for the research conducted as part of the honors thesis study was obtained from a previous project entitled, “Exploration of Temperature and Loading Rate Interdependency for Fracture Properties of Asphalt Mixtures” [3].
Fracture performance testing and cracking related index parameters to evaluate low and intermediate temperature cracking resistance of asphalt mixtures are gaining increased attention. The development cracking indexes using the Semi-Circular Bend (SCB) test has been conducted by several individuals [4, 5, 6, 7, 8] and is currently an ongoing topic of research in the asphalt pavement field.
One of the challenges with cracking tests is the selection of test temperature and loading rate that is appropriate for a given pavement climatic location. Cracking performance testing should be performed at temperatures that resemble those experienced in the field in order to appropriately evaluate mixture performance. Temperature has a significant impact on asphalt binder properties. In general, as temperature decreases asphalt binder modulus and strength increase. Therefore, at a lower testing temperature a mixture will behavior more brittle compared to when tested at a higher temperature it will behavior more ductile. A study conducted by Minnesota Department of Transportation (MNDOT) reported that, “Even at low temperatures asphalt mixtures are complex viscoelastic composite materials that significantly temperature and loading rate dependent” [9].
The goal of this study is to conduct an evaluation of the various cracking indices using output from SCB fracture test which was performed over a range of testing temperatures and loading rate combinations. Analysis consisted primarily of the comparisons of load-displacement curves and the ranking of cracking indices. Specific research objectives included:
1. Evaluate various cracking indices using SCB fracture test conducted over a range of testing temperature and loading rates.
2. Compare effects of using different displacement measurements from lab tests (Line-Load Displacement (LLD) versus Crack Mouth Opening (CMOD) Displacement) on calculated fracture properties.
METHODOLOGY
The SCB test is a relative new testing method to measure fracture energy of asphalt mixtures at intermediate temperatures. For this study, the Illinois method of SCB testing was used in accordance with AASTHO TP 105 [4, 10] test specifications. Figure 1 shows the typical SCB testing set up.
Figure 1: Typical SCB set in environmental chamber of the testing machine.
The scope of this project included five asphalt mixtures from two regional sources, Virginia and Vermont. The percentage of Reclaimed Asphalt Pavement (RAP) varied from 0% to 40% and Superpave performance graded (PG) asphalt binders were used to produce the study mixtures, as shown in Table 1. The high temperature PG grade for the Virginia binders was adjusted in an effort to compensate for the increasing percentage of RAP. All mixtures evaluated in this study have a nominal maximum aggregate (NMA) size of 9.5 mm and were sampled at a hot-mix production plant. Test specimens were fabricated from gyratory compacted specimens prepared on-site without reheating the material.
Table 1: Summary tested mixtures and test parameters (loading rates and temperature).
Mixture Virginia Vermont
Testing Condition
25°C & 50 mm/min 25°C & 50 mm/min 13°C & 50 mm/min 13°C & 50 mm/min 13°C & 1.86 mm/min 1°C & 50 mm/min
13°C & 10 mm/min 1°C & 2 mm/min
PG RAP
76-22 0% 52-34 20% 70-22 20% 52-34 40%
64-22 40%
Time-Temperature-Superposition Principle (TTSP). For each testing condition 3 replicate specimens were tested. The first and second set of testing conditions were conducted at 13°C (12 °C cooler than standard test temperature of 25 °C, which is equivalent to two PG grades) and 25 °C using the standard loading rate of 50 mm/minute. The average Gf was determined at 13°C and 25 °C and the ratio P13/P25 was calculated. This ratio is equivalent to the viscoelastic shift factor assuming the time-temperature superposition principle is valid. Then the dynamic modulus (|E*|) ratio (E*13/E*25) was compared to the P13/P25 ratio to yield the equivalent loading rates at the two temperatures (Figure 2).
Figure 2: Example of ratio based method to determine trial testing conditions using VA 20% RAP mixture [3].
The average ratio between the two loading rates was multiplied by the original loading frequency (50 mm/min) to obtain the new testing frequency for the third test condition, which was carried out at 13°C. A similar methodology was used for determining testing conditions for the fourth set of replicates. Figures 3 (a) and (b) demonstrate an example of the TTSP shift factor plot and a complex modulus (|E*|) master curve for the Virginia 20% RAP mixture to determine the third set of testing conditions.
1.E+01 1.E+02 1.E+03 1.E+04
1.E-03 1.E-01 1.E+01 1.E+03
Dy n am ic Mo d u lu s (MP a)
Reduced Frequency (Hz) VA 20% RAP 13C
VA 20% RAP 25C
E at 25C
E at 13C
Testing condition 3: loading rate sample calculation
𝑎𝑡= 𝑃13
𝑃25=
𝐸13
𝐸25
Avg ratio total Gf
=
VA 0% EE13
25+ VA 20% E13
E25+ VA 40% E13 E25 3
=0.0376+0.0344+0.0397
3 = 0.0372
Test Condition 3 loading rate
= Avg ratio total Gf* standard loading rate
(a) TTSP shift factor-temperature plot. (b) 20% RAP VA Mix master curve.
Figure 3: Example of dynamic modulus data used to determine loading rate for different test temperatures [3].
Outputs from the SCB test include line-load displacement (LLD), crack-mouth opening displacement (CMOD), and load (P). For further comparison, all fracture indices were calculated using both total LLD and CMOD. Figure 4 shows a typical load-displacement curve that is generated from the SCB test output. All load displacement curves for each testing condition by mixture are included in the Appendix.
Figure 4: Typical load-displacement curve generated from SCB test. -3 -2 -1 0 1 2 3 4
0 10 20 30 40 50
L o g Sh if t Facto r a( T ) Temperature (°C) (a) Shift Factor 4.4 21.1 37.8 10 100 1000 10000 100000
1.0E-07 1.0E-04 1.0E-01 1.0E+021.0E+05
Dy n am ic Mo d u lu s (MP a)
Loading Frequency (Hz) (b) 0 0.5 1 1.5 2 2.5 3 3.5 4 4.5
0 1 2 3 4 5 6 7 8
L oa d (kN ) Displacement (mm) 𝑃𝑚𝑎𝑥
𝑊𝑓= area under curve
0
(0.5 𝑃𝑚𝑎𝑥)
Δmdp
𝑇𝑖nf= area under curve till inflection point
𝑠𝑙𝑜𝑝𝑒(𝑚)
𝑊𝑓,𝑝𝑜𝑠𝑡 𝑝𝑒𝑎𝑘= area under curve after 𝑃𝑚𝑎𝑥
. = Inflection point
The cracking indices evaluated in this study included: Fracture Energy (Gf), Illinois
Flexibility Index (FI), Toughness Index (TI), Nflex Factor, Fracture Strain Tolerance (FST), and the Cracking Resistance Index (CRI). In the subsequent sections the method to determine each index is briefly describe including the mathematical formula to calculate each index.
Fracture Energy (Gf)
The fracture energy of a given material is defined as the energy needed to create a new unit fracture surface in the body [11]. Equation 1 is used to calculate Gf, which is defined as the
area under the load-displacement curve (Wf) normalized by fracture area. The fracture area is the
product of the width of the specimen (t) and the ligament length (a).
𝐺𝑓= 𝑊𝑓
𝑡∗𝑎 (1) Flexibility Index (FI)
Upon calculating Gf, the Flexibility Index can be determined. The Illinois method in
accordance with AASTHO TP 105 was utilized to determine FI in this study [10]. One of the main advantages to normalize Gf by another parameter is to better distinguish fracture resistance
between mixtures. Different mixture may have very high peak load and steep post-peak softening slopes and vice versa conditions. Therefore, to normalize fracture energies a parameter that considers the shape of post-peak portion may be utilized. In the case of the FI, Gf is normalized
by the average post peak slope (m) as shown in Equation 2.
𝐹𝐼 = 𝐺𝑓
|𝑚| (2)
Fracture Strain Tolerance (FST)
Similar to the FI where Gf is normalized by another parameter to better distinguish
mixtures, FST utilizes the Fracture Strength (Sf) of specimens to normalize fracture energies. To
determine Sf from the SCB geometry, a similar approach that was used for Disk-Shaped
Compact Tension (DCT) test in Zhu et al. in combination with ASTM E399-90 was
implemented to develop Equation 3 [7, 12]. Fracture strength takes into consideration the peak load as well as the specimen’s geometry where (t) is the specimen’s thickness, (w) is the specimen’s width, and (a) is the ligament length.
𝑆𝑓=
2𝑃𝑚𝑎𝑥(2𝑤+𝑎)
𝑡(𝑤−𝑎)2 (3)
FST is then calculated by normalizing fracture energy with Sf as shown in Equation 4.
𝐹𝑆𝑇 = 𝐺𝑓
𝑆𝑓 (4)
Cracking Resistance Index (CRI)
𝐶𝑅𝐼 = 𝐺𝑓
𝑃𝑚𝑎𝑥 (5)
Toughness Index (TI)
Toughness Index is calculated using the post peak Gf rather than the total area under the
curve, and multiplying it by the displacement between the peak load (∆P𝑚𝑎𝑥) and 50% of the peak load (∆mdp). A scale adjustment factor of 10-3 is included in Equation 6.
𝑇𝐼 = (𝐺𝑓,𝑝𝑜𝑠𝑡 𝑝𝑒𝑎𝑘) ∗ (∆𝑚𝑑𝑝 − ∆𝑃𝑚𝑎𝑥)*10-3 (6)
Nflex Factor
Finally, the Nflex Factor that was utilized in this study was adopted from work conducted at the National Center for Asphalt Technology (NCAT) by Yin et al using the Indirect Tensile Test (IDT). Originally, the Nflex Factor was inspired by the Illinois Flexibility Index [13], which relies on the determination of the slope of the inflection point on the post peak curve. Raw data was fitted using a sixth-degree polynomial function, slope calculated at the post peak point of inflection and the area under the load displacement curve up to the inflection point (toughness) was calculated. The Nflex Factor is then simply calculated by diving the toughness by the absolute value of the post peak slope as shown in Equation 7.
𝑁𝑓𝑙𝑒𝑥 𝐹𝑎𝑐𝑡𝑜𝑟 = 𝑇𝑖𝑛𝑓
RESULTS AND DISCUSSION
Comparing use of Line-Load Displacement and Crack Mouth Opening Displacement for Calculation of Fracture Indices
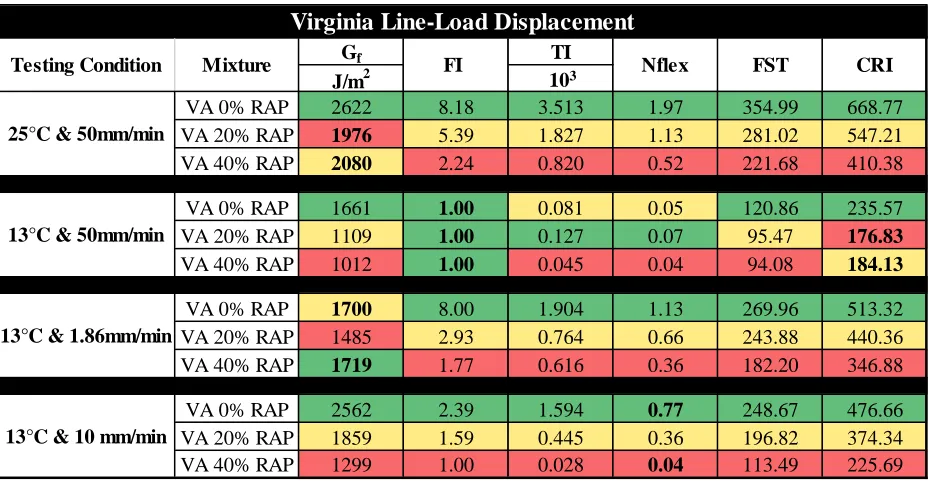
Tables 2 and 3 summarize the results for the VA mixtures, while Tables 4 and 5
summarize results for the VT mixtures at the 4 different testing conditions. Within each testing condition, mixtures are ranked from best performers (i.e. most resistant to cracking) in green to worst performers in red.
Table 2: Line-load displacement comparison of VA mixtures for all cracking index at varying test temperature and loading rate combinations (green to red represents best to worst performing).
Gf TI
J/m2
VA 0% RAP 2622 8.18 3.513 1.97 354.99 668.77
VA 20% RAP 1976 5.39 1.827 1.13 281.02 547.21
VA 40% RAP 2080 2.24 0.820 0.52 221.68 410.38
Avg Nflex (TD)Avg FST (TD)
VA 0% RAP 1661 1.00 0.081 0.05 120.86 235.57
VA 20% RAP 1109 1.00 0.127 0.07 95.47 176.83
VA 40% RAP 1012 1.00 0.045 0.04 94.08 184.13
Avg Nflex (TD)Avg FST (TD)
VA 0% RAP 1700 8.00 1.904 1.13 269.96 513.32
VA 20% RAP 1485 2.93 0.764 0.66 243.88 440.36
VA 40% RAP 1719 1.77 0.616 0.36 182.20 346.88
Avg Nflex (TD)Avg FST (TD)
VA 0% RAP 2562 2.39 1.594 0.77 248.67 476.66
VA 20% RAP 1859 1.59 0.445 0.36 196.82 374.34
VA 40% RAP 1299 1.00 0.028 0.04 113.49 225.69
Virginia Line-Load Displacement
25°C & 50mm/min
13°C & 50mm/min
13°C & 1.86mm/min
13°C & 10 mm/min
Testing Condition Mixture FI Nflex FST CRI
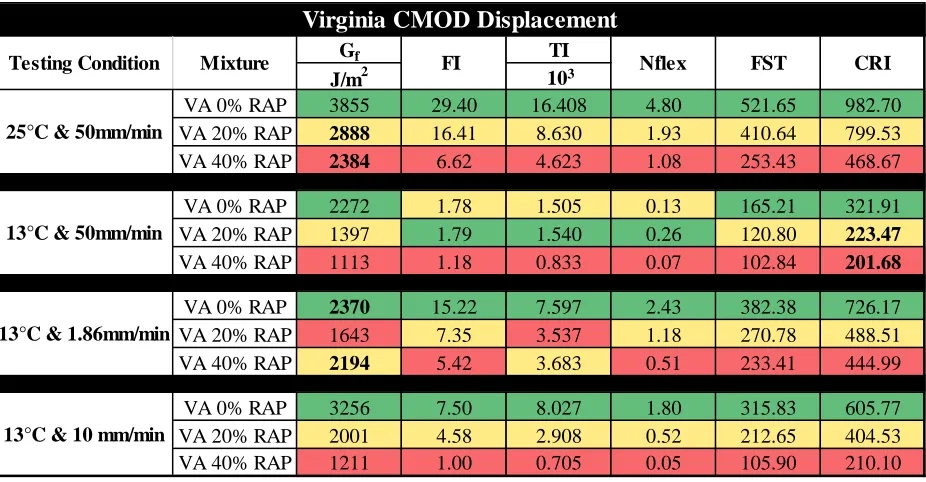
Table 3: CMOD comparison of VA mixtures for all cracking index at varying test temperature and loading rate combinations (green to red represents best to worst performing).
Table 4: Line-load displacement comparison of VT mixtures for all cracking index at varying test temperature and loading rate combinations (green to red represents best to worst performing).
Gf TI
J/m2
VA 0% RAP 3855 29.40 16.408 4.80 521.65 982.70
VA 20% RAP 2888 16.41 8.630 1.93 410.64 799.53
VA 40% RAP 2384 6.62 4.623 1.08 253.43 468.67
VA 0% RAP 2272 1.78 1.505 0.13 165.21 321.91
VA 20% RAP 1397 1.79 1.540 0.26 120.80 223.47
VA 40% RAP 1113 1.18 0.833 0.07 102.84 201.68
Avg FI CMOD) Avg Nflex (CMOD)
VA 0% RAP 2370 15.22 7.597 2.43 382.38 726.17
VA 20% RAP 1643 7.35 3.537 1.18 270.78 488.51
VA 40% RAP 2194 5.42 3.683 0.51 233.41 444.99
Avg Gf (CMOD)Avg FI CMOD) Avg Nflex (CMOD)
VA 0% RAP 3256 7.50 8.027 1.80 315.83 605.77
VA 20% RAP 2001 4.58 2.908 0.52 212.65 404.53
VA 40% RAP 1211 1.00 0.705 0.05 105.90 210.10
Mixture FI Nflex FST CRI
Virginia CMOD Displacement
25°C & 50mm/min
13°C & 50mm/min
13°C & 1.86mm/min
13°C & 10 mm/min Testing Condition
103
Gf TI
J/m2
VT 20% RAP 1165 16.57 2.351 3.80 491.48 886.81
VT 40% RAP 1419 17.70 3.944 4.20 473.53 802.64
mix
VT 20% RAP 2072 8.77 2.699 1.85 359.08 663.49
VT 40% RAP 2050 3.45 1.525 1.09 284.72 522.92
mix
VT 20% RAP 1424 1.00 0.208 0.15 135.80 248.28
VT 40% RAP 1125 1.00 0.049 0.06 114.21 205.13
mix
VT 20% RAP 1558 4.09 1.263 0.90 258.66 489.21
VT 40% RAP 1571 1.87 0.736 0.44 192.53 359.55
25°C & 50mm/min
1°C & 50mm/min
1°C & 2mm/min)
Vermont Line-Load Displacement
Testing Condition Mixture FI Nflex FST CRI
13°C & 50mm/min
Table 5: CMOD comparison of VT mixtures for all cracking index at varying test temperature and loading rate combinations (green to red represents best to worst performing).
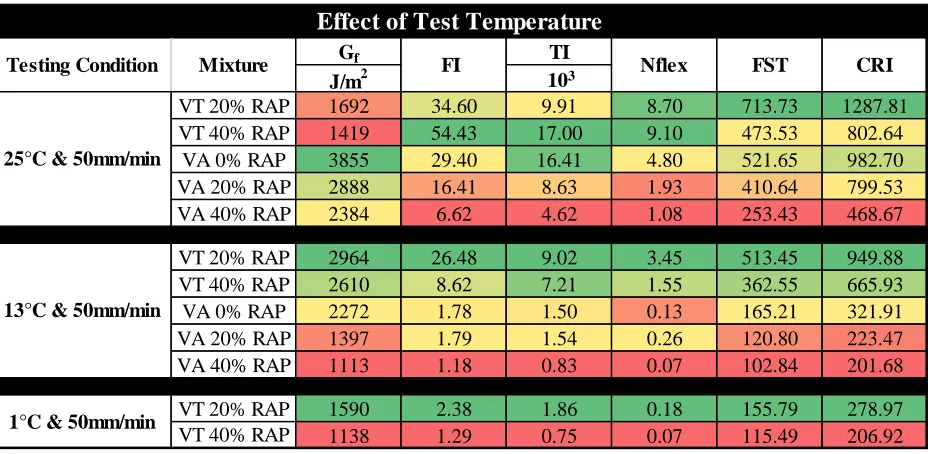
Effect of Test Temperature and Loading Rate
Asphalt is considered a viscoelastic material meaning it exhibits both a viscous and elastic component when undergoing deformation. Asphalt also exhibits both time and temperature dependent properties in response to loading. Table 6 highlights the effect of test temperature on the six cracking indices from 1 ℃ to 25 ℃ while holding the loading rate constant at 50 mm/min. Only the two mixtures from VT were tested at 1℃, as the fourth combination of test temperature and loading rate for the VA mixtures was focused on
investigating the effect of loading rate as temperature was held constant. Table 7 summarizes the effect of varying loading rate while temperature is held constant on the corresponding cracking indices.
Table 6: Effect of test temperature on ranking of mixtures at performed at 25 C, 13 C and 1 C with constant loading rate of 50 mm/min (green to red represents best to worst performing).
Gf TI
J/m2
VT 20% RAP 1692 34.60 9.91 8.70 713.73 1287.81
VT 40% RAP 1419 54.43 17.00 9.10 473.53 802.64
mix
VT 20% RAP 2964 26.48 9.02 3.45 513.45 949.88
VT 40% RAP 2610 8.62 7.21 1.55 362.55 665.93
VT 20% RAP 1590 2.38 1.86 0.18 155.79 278.97
VT 40% RAP 1138 1.29 0.75 0.07 115.49 206.92
VT 20% RAP 2068 12.77 5.74 2.00 345.71 653.81
VT 40% RAP 1911 5.83 3.55 0.82 234.18 437.28
Testing Condition Mixture FI Nflex FST CRI
25°C & 50mm/min
13°C & 50mm/min
1°C & 50mm/min
1°C & 2mm/min)
Vermont CMOD Displacement
103
Gf TI
J/m2
VT 20% RAP 1692 34.60 9.91 8.70 713.73 1287.81
VT 40% RAP 1419 54.43 17.00 9.10 473.53 802.64
VA 0% RAP 3855 29.40 16.41 4.80 521.65 982.70
VA 20% RAP 2888 16.41 8.63 1.93 410.64 799.53
VA 40% RAP 2384 6.62 4.62 1.08 253.43 468.67
VT 20% RAP 2964 26.48 9.02 3.45 513.45 949.88
VT 40% RAP 2610 8.62 7.21 1.55 362.55 665.93
VA 0% RAP 2272 1.78 1.50 0.13 165.21 321.91
VA 20% RAP 1397 1.79 1.54 0.26 120.80 223.47
VA 40% RAP 1113 1.18 0.83 0.07 102.84 201.68
VT 20% RAP 1590 2.38 1.86 0.18 155.79 278.97
VT 40% RAP 1138 1.29 0.75 0.07 115.49 206.92
Mixture FI Nflex FST CRI
Effect of Test Temperature
25°C & 50mm/min
13°C & 50mm/min
1°C & 50mm/min Testing Condition
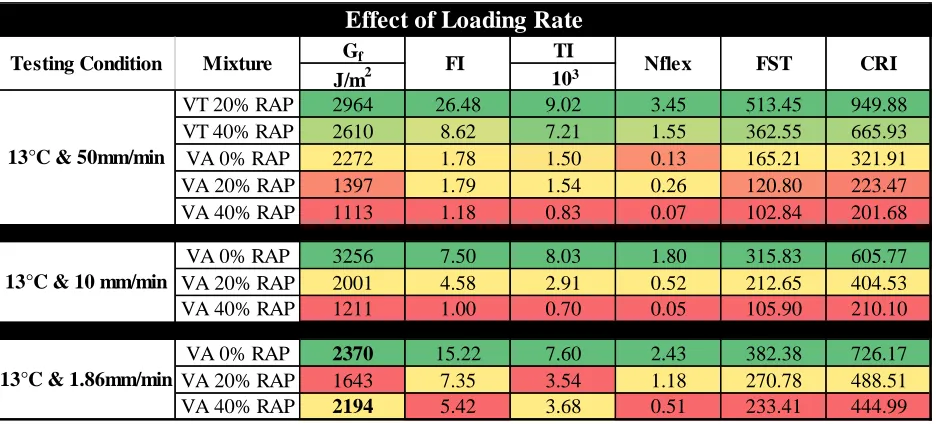
Table 7: Effect of loading rate on ranking of mixtures performed at 50 mm/min, 10 mm/min and 1.86 mm/min while holding testing temperature constant at 13 C (green to red represents best to worst
performing).
SUMMARY AND CONCLUSIONS
As the asphalt industry shifts towards a PPBS, there is an increasing number of proposed cracking indices to evaluate fracture performance of asphalt mixtures. Understanding the effects of test temperature and loading rate on the performance of mixtures is a critical step in
implementation of performance based testing. This study evaluated 6 different cracking indices used to rank the performance of asphalt mixtures. Five different mixtures with varying amounts of RAP and PG grades were tested at 4 different test temperature and loading rate combinations. Key conclusions from this study include:
Similar ranking of mixtures using line-load versus CMOD displacement. However, the magnitude and distinction between mixtures varies significantly with temperature.
Post peak slope behaviour has an impact on the ranking of mixtures.
Consideration to climatic region should be incorporated into selection of appropriate test temperature and loading rate combination for fracture testing.
Recommendations for future work consists of expanding the mixture database and incorporating finite element analysis (FEA) to gain a greater understanding of the effect of temperature on fracture performance. Further study on the development of stresses within the SCB specimen while undergoing loading using the cohesive zone (CZ) model should be
conducted to simulate the fracture in asphalt mixtures. By incorporating CZ model into the FEA process, the weakening of material near the crack tip to resist crack initiation and propagation
Gf TI
J/m2
VT 20% RAP 2964 26.48 9.02 3.45 513.45 949.88
VT 40% RAP 2610 8.62 7.21 1.55 362.55 665.93
VA 0% RAP 2272 1.78 1.50 0.13 165.21 321.91
VA 20% RAP 1397 1.79 1.54 0.26 120.80 223.47
VA 40% RAP 1113 1.18 0.83 0.07 102.84 201.68
VA 0% RAP 3256 7.50 8.03 1.80 315.83 605.77
VA 20% RAP 2001 4.58 2.91 0.52 212.65 404.53
VA 40% RAP 1211 1.00 0.70 0.05 105.90 210.10
VA 0% RAP 2370 15.22 7.60 2.43 382.38 726.17
VA 20% RAP 1643 7.35 3.54 1.18 270.78 488.51
VA 40% RAP 2194 5.42 3.68 0.51 233.41 444.99
Testing Condition Mixture FI Nflex FST CRI
13°C & 50mm/min
13°C & 10 mm/min
13°C & 1.86mm/min
Effect of Loading Rate
may be capture and analysed further. Validation of mixture performance is also strongly encouraged using field performance data.
ACKNOWLEDGEMENTS
REFERENCES
[1] “America's Infrastructure Scores a D+.” ASCE's 2017 Infrastructure Report Card, American Society of Engineers, 2017, www.infrastructurereportcard.org/.
[2] “New Hampshire 2017 Report.” ASCE's 2017 Infrastructure Report Card, American Society of Engineers, 2017, www.infrastructurereportcard.org/state-item/new-hampshire/.
[3] Haslett, K. E., Dave, E. V., Daniel. J. Sias., “Exploration of Temperature and Loading Rate Interdependency for Fracture Properties of Asphalt Mixtures.”RILEM 2017, vol. 4, Sept. 2017, pp. 521–530.
[4] Ozer, H., Al-Qadi, I., Lambros, J., Khatib, A., Singhvi, P., Khan, T., Rivera, J., Doll, B. (2015). “Testing Protocols to Ensure Performance of High Asphalt Binder Replacement Mixes Using RAP and RAS,” Report No. FHWA-ICT-15-017, Illinois Center for Transportation, Rantoul, IL.
[5] Kuruppu, Mahinda D, and Ken P Chong. “Fracture Toughness Testing of Brittle Materials Using Semi-Circular Bend (SCB) Specimen.” Engineering Fracture Mechanics, vol. 91, 2 Jan. 2012, pp. 133–150.
[6] Mihai Marasteanu, William Buttlar, Hussain Bahia, and Christopher Williams, et al.,
“Investigation of Low Temperature Cracking in Asphalt Pavements, National Pooled Fund Study – Phase II.” Final Report. University of Minnesota: Department of Civil Engineering, 2012, Minneapolis, Minnesota.
[7] Zhu, Y., Dave, E. V., Rahbar-Rastegar, R., Daniel, J. S., and Zofka, A. (2017) “Comprehensive Evaluation of Low Temperature Cracking Fracture Indices for Asphalt
Mixtures”, Road Materials and Pavement Design, DOI: 10.1080/14680629.2017.1389085, pp. 1-24 (Published Online).
[8] Kaseer, Fawaz & Yin, Fan & Arambula, Edith & Epps Martin, Amy & Sias, Jo & Salari, Saman. (2018). Development of an index to evaluate the cracking potential of asphalt mixtures using the semi-circular bending test. Construction and Building Materials. 167. 286-298. 10.1016/j.conbuildmat.2018.02.014.
[9] “Investigation of Low Temperature Cracking in Asphalt Pavements.” Phase I. TPF-5(080).
National Pooled Fund Executive Summary, May 2007.
[10] American Association of State Highway and Transportation Officials, “Determining the Fracture Potential of Asphalt Mixtures Using the Semicircular Bend Geometry (SCB) at Intermediate Temperature,” AASHTO TP 105-13-b_IL_SCB.
[12] “Standard Test Method for Plane-Strain Fracture Toughness of Metallic Materials.” ASTM International, E399 – 90. www.compass.astm.org/download/E399-90R97.4592.pdf.
APPENDICES
SCB Load-Displacement Curves VA Mixture
SCB Load-Displacement Curves VT Mixture
![Figure 2: Example of ratio based method to determine trial testing conditions using VA 20% RAP mixture [3]](https://thumb-us.123doks.com/thumbv2/123dok_us/9597364.1488257/9.612.80.556.200.427/figure-example-ratio-method-determine-testing-conditions-mixture.webp)
![Figure 3: Example of dynamic modulus data used to determine loading rate for different test temperatures [3]](https://thumb-us.123doks.com/thumbv2/123dok_us/9597364.1488257/10.612.72.559.419.670/figure-example-dynamic-modulus-determine-loading-different-temperatures.webp)