ANALYSIS OF PERFORMANCE
CHARACTERISTICS OF LASER BEAM
WELDING
G HARINATH GOWD1*
Associate Professor, Department of Mechanical Engineering Sri Krishnadevaraya Engineering college,
NH-7, Gooty, Anantapur Dist, PIN 515 401 Andhra Pradesh., INDIA
hari.skd@gmail.com
E VENUGOPAL GOUD
Associate Professor, Department of Mechanical Engineering Pullareddy Engineering college,
Kurnool, Anantapur Dist, PIN 515 401 Andhra Pradesh., INDIA
venugoud@gmail.com
Abstract :
Laser Beam Welding (LBW) is a widely used welding technique in Automotive, Aerospace, and Electronic and Heavy manufacturing industries to join a variety of metals and alloys because of its high speed, fine welding seam quality, low heat input per unit volume, deep penetration, and narrow heat affected zone, and reduced tendency to cracking. LBW process is so complex in nature that the selection of appropriate input parameters is not possible by the trial-and-error method. The selection of welding parameters in any machining process significantly affects the weld quality and the production cost. In this work, the effects of welding input parameters, viz., pulse duration, pulse frequency, welding speed and pulse energy on Bead geometrical parameters, viz., bead penetration, bead width and bead volume are analyzed. It is based on the empirical models developed by response surface methodology.
Keywords: Laser beam welding, Modeling, Analysis, Performance characteristics.
1. INTRODUCTION
The principle of operation as shown in Fig 1 is that the laser beam is pointed on to a joint and the beam is moved along the joint. The process will melt the metals in to a liquid, fuse them together and then make them solid again thereby joining the two pieces.
Fig. 1 Principle of Laser Welding
Laser beam welding has high power density (of the order of 1 Megawatt/cm² (MW)), having high heating and cooling rates which result in small heat affected zones (HAZ). Industrial lasers are used for welding, cutting, drilling and surface treatment of a wide range of engineering materials. An inert gas, such as helium or argon, is used to protect the weld bead from contamination, and to reduce the formation of absorbing plasma. LBW is a very versatile process, which is capable of welding a variety of materials like stainless steels, carbon steels, aluminum, copper, tool steels, etc. This process involves a large number of control factors. Moreover, the process is stochastic in nature. These factors do not allow the operator to obtain the optimal performance just by the trial-and-error method.
2. LITERATURE SURVEY
In any welding process, bead geometrical parameters play an important role in determining the mechanical properties of the weld and hence quality of the weld [2]. In Laser Beam welding, bead geometrical variables are greatly influenced by the process parameters such as Pulse frequency, Welding speed, Input energy, Shielding gas [3]. Therefore to accomplish good quality it is imperative to setup the right welding process parameters. Quality can be assured with embracing automated techniques for welding process. Welding automation not only results in high quality but also results in reduced wastage, high production rates with reduce cost to make the product. Benyounis et al. [4] has investigated the Effect of welding parameters on the heat input and weld bead profile using continuous wave 1.5 KW CO2 laser. The welding parameters taken in to
consideration were welding speed, laser power and focal point position. Linear and quadratic polynomial equations were developed using RSM and the experimental plan was based on Box-Behnken design. Lung Kwang pan et al. [5] used ND:YAG laser for optimization of thin plate magnesium alloy butt welding using the Taguchi method. They have considered the effects of six welding parameters on the ultimate tensile stress of the weld joint. Nagesh and Datta [6] developed a back-propagation neural network, to establish the relationships between the process parameters and weld bead geometric parameters, in a shielded metal arc welding process. Jantre et al. [7] applied artificial neural networks to predict the pulsed current Gas Metal Arc Welding (GMAW) process. Balasubramanian et al. [8] applied neural networks to modeling and Buvanasekaran et al. [9] studied the Analysis of Laser welding parameters using artificial neural networks. The Taguchi method was utilized by Tarng and Yang [10] to analyze the affect of welding process parameter on the weld-bead geometry. Casalino [11] has studied the effect of welding parameters on the weld bead geometry in laser welding using statistical and Taguchi approaches. Murugan and Parmar [12] have developed mathematical models to study the effect of MIG process parameters on bead geometry in surfacing of stainless steel and the direct and interaction effect of process parameters were analyzed.
turbocharger rotors and seals, electric submersible well pump motor shafts, high temperature fasteners, chemical processing and pressure vessels, heat exchanger tubing, rocket motors, space craft, nuclear reactors pumps and tooling. In the present work, the analysis of performance measures of LBW was carried out based on the models derived earlier by the authors in ref [13].
3. ANALYSIS OF PERFORMANCE CHARACTERISTICS
Bead penetration, Bead width and Bead volume are considered as the output responses and measured using Toolmaker’s microscope. For each response the readings were measured at three different sections of the weld joint and the average value is taken.
The following models of Bead penetration, Bead width and Bead volume in terms of coded factors were secured from authors’ previous work [13] for analysis:
1 2 3 4 1 2 2 1 3 1 4 2 3 2 4 3 4 1
2 2 2
2 3 4
2 . 0 6 0 . 3 4 0 . 0 8 1 - 0 . 1 1 0 . 1 2 - 0 . 1 6
- 0 . 0 7 6 - 0 . 0 5 1 0 . 0 1 4 0 . 0 1 9 0 . 1 3 - 0 . 1 8
- 0 . 0 2 0 0 . 0 3 4 - 0 . 0 3 6
P e n e t r a t i o n x x x x x x
x x x x x x x x x x x
x x x
= + + +
+ + +
+
(1)
1 2 3 4 1 2
1 3 1 4 2 3 2 4 3 4
0 . 9 6 0 . 0 6 0 0 . 0 2 2 - 0 . 2 4 0 . 0 4 6 0 . 0 6 5
0 . 1 7 0 . 0 9 1 0 . 0 5 5 0 . 0 0 6 5 0 . 1 5
B e a d w i d t h x x x x x x
x x x x x x x x x x
= + + − +
+ + − − +
(2)
1 2 3 4
1 2 1 3 1 4 2 3 2 4
2 2 2 2
3 4 1 2 3 4
0 . 5 0 0 . 0 1 6 0 . 1 4 - 0 . 0 7 7 0 . 0 3 0
- 0 . 0 0 0 7 5 - 0 . 0 0 3 2 5 0 . 0 3 5 0 . 1 1 0 . 0 3 4
0 . 0 2 2 - 0 . 0 6 3 - 0 . 1 3 0 . 0 0 4 5 5 - 0 . 0 2 8
B e a d v o l u m e x x x x
x x x x x x x x x x
x x x x x x
= + + +
+ + +
− +
(3)
Where x1, x2, x3 and x4 represent the decoded values of pulse duration, pulse frequency, welding speed and pulse
energy respectively.
These models were tested for their adequacy using the Analysis of Variance Test (ANOVA) and regression coefficients (R2) [13]. Analysis of variance (ANOVA) is carried out for the quadratic response surface models. The statistics of ANOVA for Bead penetration, Bead width and Bead volume are given in the Tables 1, Table 2 and Table 3 respectively.
Table 1: ANOVA [Partial sum of squares] for Bead Penetration
Source Sum of Squares d. f. Mean Square F-Value Prob > F
Model 1.0167 14 0.073 15.22 0.0001*
x1 0.6987 1 0.699 146.4 0.0001*
x2 0.0393 1 0.039 8.23 0.0111
x3 0.0754 1 0.075 15.8 0.0011
x4 0.0858 1 0.086 17.98 0.0006
x1x2 0.026 1 0.026 5.45 0.0329
x1x3 0.0058 1 0.006 1.22 0.286
x1x4 0.0026 1 0.003 0.55 0.4689
x2x3 0.0002 1 2.00E-04 0.04 0.8447
x2x4 0.0004 1 4.00E-04 0.07 0.7895
x3x4 0.0179 1 0.018 3.75 0.0707
x12 0.0587 1 0.059 12.29 0.0029
x22 0.0007 1 7.00E-04 0.15 0.7012
x32 0.002 1 0.002 0.43 0.5221
x42 0.0023 1 0.002 0.49 0.4938
Residual 0.0764 16 0.005
Pure Error 0.014 6 0.002
Cor Total 1.0931 30
Std. Dev. 0.069 R2 0.9301
Mean 2.02 Adj. R2 0.869
* - Refers to Significant terms
Table 2: ANOVA [Partial sum of squares] for Bead width
Source Sum of Squares d. f. Mean Square F-Value Prob > F
Model 0.4573 10 0.046 23.92 0.0001*
x1 0.022 1 0.022 11.49 0.0029
x2 0.003 1 0.003 1.57 0.2253
x3 0.3514 1 0.351 183.8 0.0001*
x4 0.0126 1 0.013 6.59 0.0184
x1x2 0.0042 1 0.004 2.21 0.1527
x1x3 0.0294 1 0.029 15.39 0.0008
x1x4 0.0082 1 0.008 4.28 0.0516
x2x3 0.0031 1 0.003 1.61 0.2189
x2x4 0 1 0 0.02 0.8833
x3x4 0.0234 1 0.023 12.25 0.0023
Residual 0.0382 20 0.002
Pure Error 0.0043 6 7.00E-04
Cor Total 0.4955 30
Std. Dev. 0.044 R2 0.9228
Mean 0.96 Adj. R2 0.8843
Table 3: ANOVA [Partial sum of squares] for Bead volume
Source Sum of Squares d. f. Mean Square F-Value Prob > F
Model 0.2128 14 0.015 12.16 0.0001*
x1 0.0015 1 0.002 1.22 0.2864
x2 0.1214 1 0.121 97.14 0.0001*
x3 0.0357 1 0.036 28.53 0.0001*
x4 0.0053 1 0.005 4.25 0.0559
x1x2 0 1 0 0 0.9833
x1x3 0 1 0 0.01 0.9279
x1x4 0.0012 1 0.001 0.97 0.3403
x2x3 0.0112 1 0.011 8.95 0.0086
x2x4 0.0011 1 0.001 0.91 0.3539
x3x4 0.0005 1 5.00E-04 0.38 0.5471
x12 0.0071 1 0.007 5.67 0.0301
x22 0.0293 1 0.029 23.41 0.0002
x32 0 1 0 0.03 0.8654
x42 0.0013 1 0.001 1.1168 0.3063
Residual 0.0199 16 0.001
Pure Error 0.0009 6 2.00E-04
Cor Total 0.2327 30
Std. Dev. 0.035 R2 0.9141
Mean 0.46 Adj. R2 0.8389
* - Refers to Significant terms
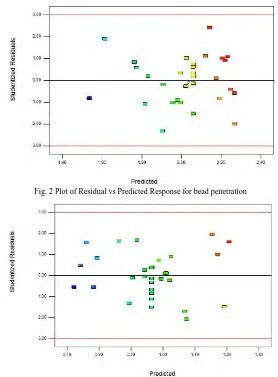
Fig. 2 Plot of Residual vs Predicted Response for bead penetration
Fig. 3 Plot of Residual vs Predicted Response for bead width
Fig. 4 Plot of Residual vs Predicted Response for bead volume
The above developed models have been employed to predict the Penetration, bead width, and bead volume for the range of parameters used in the investigation. Based on these models, the main effects and the interaction effects of the process parameters on penetration, bead width and bead volume are computed and plotted using statistical software, Design Expert, 7.1.3v [16].
Fig. 5 Effect of Pulse duration on penetration
The main effect of Frequency on Depth of penetration is shown in Fig. 6 and it can be observed that the depth of penetration increases with the frequency. This is also due to the overlapping of pulses. Overlapping of pulses increases the density of pulse and in turn increases the penetration. Hence in order to obtain more depth of penetration, the Pulse duration and the frequency should be increased.
Fig. 6 Effect of Frequency on penetration
The effect of welding speed on depth of penetration as seen in Fig.7. It is observed that the depth of penetration decreases with increase in the welding speed. The trend of decrease in penetration depth with increase of the welding speed can be explained by the amount of heat conduction transmitted to the base metal decreasing as the welding speed increases.
Fig. 7 Effect of welding speed on penetration x2 = 14 HZ
x3 = 500 mm/min
x4 = 15 J
x1 = 3µs x3 = 500 mm/min x4 = 15 J
x1 = 3µs
x2 = 14 Hz
Fig. 8 Effect of pulse energy on penetration
The effect of energy on the depth of penetration is observed in Fig. 8. Energy has a direct influence on the heat input at each pulse. The depth of the weld increases with increase in energy. As the magnitude of laser power increases, the depth of penetration increases. This is due to the increase in heat input when beam power increases resulting in more melting of base metal.
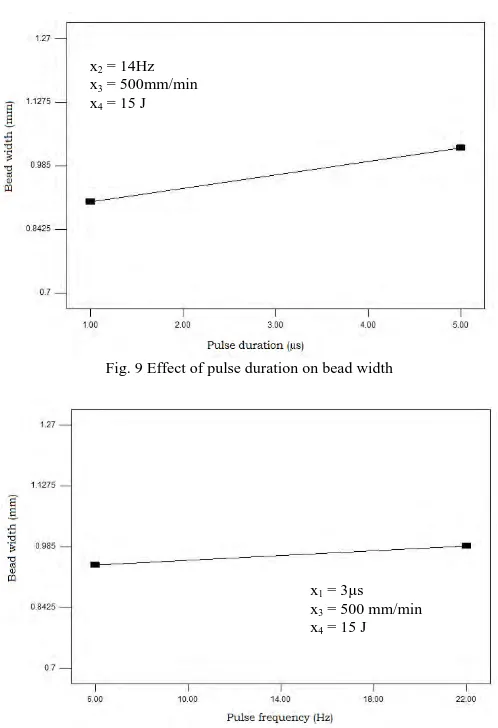
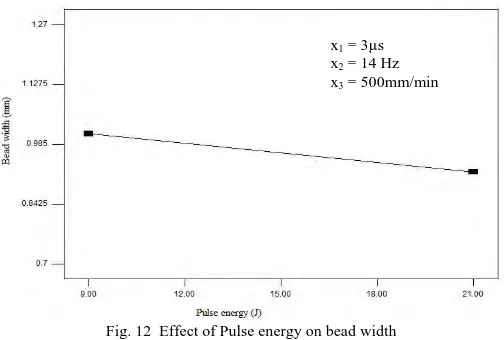
The effect of pulse duration, pulse frequency, welding speed and pulse energy on bead width are shown in Fig. 9, Fig. 10, Fig.11 and Fig. 12. It is observed from Fig. 9 and 10 that, the bead width increases with the increase of pulse duration and frequency. This is due to increase of overlapping of pulses with the increase in pulse duration. The overlapping of pulses increases the density of pulse and this in turn increases the bead width.
Fig. 9 Effect of pulse duration on bead width
Fig. 10 Effect of pulse frequency on bead width
x1 = 3µs
x2 = 14 Hz
x3 = 500mm/min
x2 = 14Hz
x3 = 500mm/min
x4 = 15 J
x1 = 3µs
x3 = 500 mm/min
Fig. 11 Effect of Welding speed on bead width
The effect of welding speed on bead with is shown in Fig. 11. It is observed that as the welding speed increases, the bead width decreases. As the welding speed increases the welding torch travels at great speed over the base metal, resulting in a lower metal deposition rate on the joint. Also the heat input decreases appreciably when welding speed increases. Hence because of less heat input and a lower metal deposition rate, bead width decreases.
The effect of energy on the bead width is observed in Fig. 12. There is a slight decrease of bead width as the pulse energy increases. The variation of bead width is less significant for the variation of energy, indicating that it may be a function of laser beam spot diameter. As the spot diameter was maintained constant for all the trials, not much of variation was observed in the bead width.
Fig. 12 Effect of Pulse energy on bead width
The individual effect of pulse duration on bead volume can be observed from Fig. 13. The pulse duration has a bilateral effect on weld volume. The volume of weld increases with the duration of the pulses of up to certain limit. If the duration of pulse exceeds that limit, the weld volume decreases with the duration of the pulse. This is attributed to increasing the heat induced in the materials with the pulse duration below that value. Beyond that, the maximum power of each pulse reduced due to limitation in the power of laser and therefore the laser maximum energy induced in the weld bead decreases.
x1 = 3µs
x2 = 14 Hz
x3 = 500mm/min
x1 = 3µs
x2 = 14 Hz
Fig. 13 Effect of Pulse duration on bead volume
The individual effect of Frequency on bead volume can be observed from Fig. 14. The bead volume increases with increase in laser frequency. This is due to increase of number of pulses with frequency, which in turn increases the heat induced in the material.
Fig. 14 Effect of Frequency on bead volume
The effect of Welding speed on bead with is seen in Fig. 15. It is observed that as the welding speed increases, the welding torch travels at great speed over the base metal, resulting in a lower metal deposition rate on the joint. Also the heat input decreases appreciably when welding speed increases. Hence because of less heat input and a lower metal deposition rate, bead volume decreases. The effect of energy on the bead volume is observed in Fig. 16. The energy has a direct influence on the heat input at each pulse. The volume of weld increases with the increase of Energy.
x2 = 14Hz
x3 = 500mm/min
x4 = 15 J
x1 = 3µs
x3 = 500 mm/min
Fig. 15 Effect of Welding speed on bead volume
Fig. 16 Effect of Pulse energy on bead volume
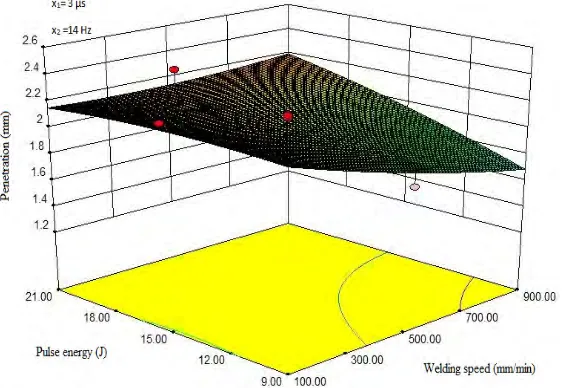
The Fig.17 shows the interaction effects of pulse energy and welding speed on bead penetration. It can be observed that as the pulse energy increases from minimum to maximum, the depth of penetration is found to increase and as the welding speed increases, the depth of penetration decreases.
Fig. 17 Interaction effect of welding speed and pulse energy on bead penetration x1 = 3µs
x2 = 14 Hz
x4 = 15 J
x1 = 3µs
x2 = 14 Hz
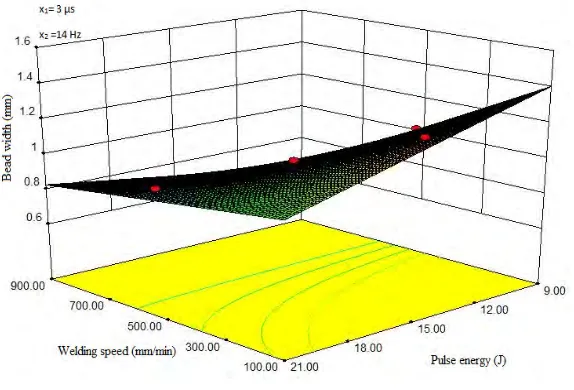
The Fig.18 shows the interaction effects of pulse energy and welding speed on bead width. Bead width increases with decrease of pulse energy and when welding speed decreases from 900mm/min to 100mm/min. At high value of welding speed and low value of pulse energy, bead width is about 0.6 mm and is the lowest.
Fig. 18 Interaction effect of pulse energy and welding speed on bead width
Fig.19 depicts the interaction effects of pulse duration and welding speed on bead volume. The bead volume gradually decreases with the increase in welding speed. The maximum value of bead volume (0.52mm3) is observed when pulse duration increases from 1µ s to 5 µs. Thus pulse duration has a positive effect on the bead volume.
Fig. 19 Interaction effect of pulse duration and welding speed on bead volume
4. CONCLUSION
REFERENCES
[1] Steen W.M., Laser material processing”, Springer, London, 1991.
[2] Howard B.Cary., “Modern Welding Technology”, Prentice Hall, New Jersey, 1989.
[3] Murugan N., Bhuvanasekharan G., “Effects of process parameters on the bead geometry of laser beam butt welded stainless sheets”, International Journal of Advanced Manufacturing Technology, 32:1125-1133, 2007.
[4] Benyounis K.Y., Olabi A.G., Hashmi M.S.J., “Effect of laser welding parameters on the heat input and weld bead profile”, Journal of Materials processing technology, 65:978-985, 2005.
[5] Lung Kwang pan., Che Chang Wang., Ying Ching Hsiao., Kye Chyn Ho., “Optimization of Nd:YAG laser welding on to magnesium alloy via Taguchi analysis”, Optics and Laser technology, 37: 33-42, 2004.
[6] Nagesh D S., Datta G L., “Prediction of weld bead geometry and penetration in shielded metal-arc welding using artificial neural networks”, Journal of Materials Processing Technology, 123: 303–312, 2002.
[7] De A., Jantre J., Ghosh P.K., ”Prediction of weld quality in pulsed current GMAW process using artificial neural network”, Science and Technology of Welding and Joining 9 (3): 253–259, 2004.
[8] Balasubramanian K.R., Bhuvanasekaran G., Sankaranarayanaswamy K., “Mathematical & ANN Modeling of ND:YAG Laser welding of Thin SS Sheets”.
[9] Bhuvanasekaran G., Balasubramanian K.R., Sankaranarayanaswamy K., “Analysis of Laser welding parameters using Artificial neural network”, International journal for the joining of Materials, Volume 18 No.3/4, pp 99-104. ISSN 0905-6866, December 2006. [10] Tarng Y.S., Yang W.H., “Optimization of the weld-bead geometry in gas tungsten arc welding by the Taguchi method”, International
Journal of Advanced Manufacturing Technology, 14(8), 549–554, 1998.
[11] Casalino G., “Investigation on Ti6A14V laser welding using statistical and taguchi approaches”, International Journal of Advanced Manufacturing technology, 2008.
[12] Murugan N., Parmar RS., “Effect of MIG process parameters on the geometry of the bead in the automatic surfacing of stainless steel”, Journal of Materials Processing Technology, 41:381–398, 1994.
[13] G. Harinath Gowd, A. Gopala Krishna, “Empirical modeling of Bead geometry and optimization in laser welding”, International Journal of Engineering Research and Industrial Applications., Volume: 4, No.III, August 2011.
[14] Montgomery D.C., “Design and analysis of experiments”, 5th edition, John Wiley & Sons, INC, New York, 2003.
[15] Noordin M Y, Venkatesh V C, Sharif S, Elting S, Abdullah A (2004), “Application of Response Surface Methodology in Describing the Performance of Coated Carbide Tools when Turning AISI 1045 Steel”, Journal of Materials Processing Technology, Vol. 145, pp 46-58.

![Table 1: ANOVA [Partial sum of squares] for Bead Penetration](https://thumb-us.123doks.com/thumbv2/123dok_us/9653922.1493195/4.595.114.485.89.421/table-anova-partial-sum-squares-bead-penetration.webp)
![Table 3: ANOVA [Partial sum of squares] for Bead volume](https://thumb-us.123doks.com/thumbv2/123dok_us/9653922.1493195/5.595.111.488.82.498/table-anova-partial-sum-squares-bead-volume.webp)