Nonprofit-driven community capacity-building
efforts in community food systems
Mahbubur R. Meenar
*
Temple University
Submitted January 8, 2015 / Revised April 22, April 30, May 18, and May 19, 2015 / Accepted May 19, 2015 / Published online November 24, 2015
Citation: Meenar, M. R. (2015). Nonprofit-driven community capacity-building efforts in community food systems. Journal of Agriculture, Food Systems, and Community Development, 6(1), 77–94. http://dx.doi.org/10.5304/jafscd.2015.061.006
Copyright © 2015 by New Leaf Associates, Inc. Abstract
This paper explores how community-based nonprofit organizations (NPOs) build community capacity through their programs and initiatives while responding to community issues such as food insecurity and vulnerability. Based on an original survey, interviews, field observations, and spatial network analysis, the paper examines Philadelphia-based NPO-driven community capacity-building programs by using the community capitals framework, which includes human, physical, financial, social, and
organizational capitals. The findings suggest that NPOs are making an important effort to build community capacity, while facing significant challenges related to administration, budget, collaboration, longevity, financial return, spatial mismatch, and community engagement.
Concluding remarks include policy suggestions for NPOs that are working on community issues.
Keywords
community capacity, community food systems, nonprofit organizations, Philadelphia,
organizational capital, human capital, physical capital, financial capital, social capital
Introduction
Community capacity-building efforts in urban neighborhoods are typically designed, catalyzed, and funded by nonprofit organizations (NPOs) (Chaskin, 2001). The broader purpose of this paper is to examine how NPOs, through their commu-nity capacity-building programs, respond to com-munity issues. Here I summarize a Philadelphia-based study that focused on private NPOs, such as community-based or grassroots organizations and community development corporations, that offered or participated in any food-related programs, projects, or initiatives that served their constitu-ents. My goal is to explore how NPO programs respond to community food insecurity and * Dr. Mahbubur R Meenar, Assistant Director, Center for
vulnerability in disadvantaged or disinvested urban neighborhoods. Many NPOs play an important role in providing or distributing food that is physically and economically accessible, safe, nutritious, adequate, and culturally acceptable to vulnerable populations—meeting the conditions set by food justice theory, which is alternatively known as a place-based grassroots movement by many, and is connected to literature on democracy, citizenship, community development, community resilience, networked social movements, and social and environmental justice (Alkon & Agyeman, 2011; Gottlieb & Joshi, 2010; Wekerle, 2004). Many researchers have agreed that NPO-driven food-related projects are “the core of the food justice movement” (Alkon & Agyeman, 2011, p. 345).
Community food security (CFS) is a compli-cated topic that includes three layers of food access issues: geographic, economic, and informational (McEntee & Agyeman, 2010). CFS means having continuous access to adequate food for a healthy life (Nord, Andrews, & Carlson, 2009) and to food that is affordable, safe, nutritious, and culturally appropriate (Anderson & Cook, 1999; Kendall & Kennedy, 1998). Research has indicated that there are issues associated with many community-based food-related programs offered by NPOs, including but not limited to spatial mismatch of needs and services, social exclusion, and lack of coordination among NPOs (Meenar, 2012; Meenar & Hoover, 2012). While most studies related to NPO-driven community capacity-building efforts were focused on actual programs such as community gardens, few have focused on the NPOs who administered those programs. This paper attempts to contribute to such literature.
In this paper, I start with a brief literature review on NPO-driven community capacity-building efforts, followed by discussions and interpretations of the findings from a survey and interviews with staff of those Philadelphia-based NPOs with any food-related programs. Finally I discuss in detail the operational, financial, and other challenges these NPOs face.
NPOs and Community Capacity Building Community capacity can be understood through
social capital literature (Putnam, 1995). The defini-tion of community capacity is based on the rela-tionship between human, organizational, and social capitals used to solve problems and improve a community (Chaskin, Brown, Venkatesh, & Vidal, 2001). According to Coleman (1988), human capi-tal is the knowledge and skills that a person has, and social capital is formed by community mem-bers building relationships with one another. Community capacity can be strengthened through four strategies: enhancing the abilities of indivi-duals, making organizations stronger, building relationships among individuals, and building relationships among organizations (Chaskin, 2001).
Community capacity building has been defined in similar ways as community capacity, as it is synonymous with building human, social, and organizational capital (Taylor, 2003). While capacity is usually termed as the “ability” to carry out stated objectives (Goodman et al., 1998), capacity build-ing is an indefinite or continuous “process” of improving that ability of a person, group, or organization (Brown, Lafond, & Macintyre, 2001). At an organizational level, capacity building may support an ongoing approach to development that is based on equity, empowerment, and participa-tion of grassroots and other organizaparticipa-tions, while promoting inter-organizational partnerships and networks (Labonte, Woodard, Chad, & Laverack, 2002).
The terms capacity, capacity development, and capacity building originated from applications in the fields of agricultural research, development, training, and management (Baillie, Bjarnholt, Gruber, & Hughes, 2009). Research shows that communities that take asset- and capacity-building approaches to development can be more successful in meeting community needs (Flora & Flora, 2007; Green & Haines, 2008). In addition to providing important services, NPOs can foster civic engage-ment and community mobilization (Twombly, De Vita, & Garrick, 2000). A place-based community capacity-building process includes discussions of democracy, citizenship, and community economic development (Fallov, 2010).
addressing food insecurity problems and building community capacity. They used community gar-dening projects to understand such relationships. Community gardens can increase community con-nections, citizen participation, and sense of com-munity, all of which in turn may help to build social capital. Foodcentric NPOs can build community capacity through the protection and development of human capital (e.g., nutritional education, cooking lessons, training, workshops, etc.), social capital (e.g., social events, community bonding, etc.), physical capital (e.g., vacant land remediation, site clean-up, etc.), and natural capital (e.g., orchard and tree plantings, sustainable energy education, etc.).
Instead of focusing on only one type of program, such as community gardens or farmers markets, this paper attempts a comprehensive look at various types of programs and activities initiated by NPOs and how they build community capacity. There is, however, no established framework to assess food-related NPO-driven community capacity-building efforts. Researchers have used community capitals framework to define and develop measures of community capacity
(Apaliyah, Martin, Gasteyer, Keating, & Pigg, 2012; Emery & Flora, 2006; Mandarano, 2015; Mountjoy, Seekamp, Davenport, & Whiles, 2014). The variables used in this analysis are related to five components of community capitals and are grouped into four categories:
(i) Human capital–related variables: These include the enhancement of individual ability (Chaskin, 2001) and cultivation of transferable
knowledge and skills (Goodman et al., 1998), such as food-related educational and training programs, internship and voluntary work programs, and events;
(ii) Financial and physical capital–related variables: These include community economic
development (Phillips & Pittman, 2009), such as creating or retaining jobs through food-related programs, assisting local businesses, and producing food in vacant lands;
(iii) Social capital–related variables: These include equity and empowerment (Coleman, 1988; Labonte et al., 2002; Twombly et al., 2000) and
citizenship (Fallov, 2010), such as community engagement with a focus on vulnerable populations; and
(iv) Organizational capital–related variables (Chaskin, 2001; Labonte et al., 2002): These include interorganizational networks, network density, and bridging and bonding networks.
Context, Methodology, and Data
This study was based in the city of Philadelphia, which has a population of about 1.5 million. Food insecurity and hunger exist in many lower-income urban neighborhoods, and Philadelphia is no exception. In many food-insecure neighborhoods, disadvantaged residents do not have easy access to healthy and fresh food, have poor food habits, and have diet-related chronic health conditions
(Meenar & Hoover, 2012). The city, on the other hand, is nationally known for many of its NPO-driven initiatives and partnerships, including a healthy corner store initiative, financial incentives for building new grocery stores in disinvested neighborhoods, bringing fresh food from regional farms to the city, and distributing healthy produce to food cupboards.
The study methodology included GIS-based spatial network analysis, social network analysis (e.g., network density, spatial bridging and bonding network, etc.), and field observation of 25 food-related events, tours, and community or stake-holder meetings that were organized by NPOs. I collected primary data from an online survey and interviews of NPO representatives, as well as from online sources, (e.g., websites, blogs, and social networking sites).
Based on data from the Delaware Valley Regional Planning Commission,1 GuideStar,2 the National Center for Charitable Statistics,3 and the Pennsylvania Community Development Corpora-tions,4 I compiled a list of 3,182 NPOs serving
1 Metropolitan Planning Agency of Philadelphia (http://www.dvrpc.org).
Philadelphia. After initial screening of their names, descriptions, and key words, about 250 NPOs were chosen that seemed to offer any food-related pro-grams. Two research assistants examined every organization’s website or social media site(s) (e.g., blog sites or Facebook pages) that were available, and verified if they had any food-focused program in any part of Philadelphia. Based on this verifica-tion process, a list of 153 NPOs (study samples) was finalized with contact information, such as email addresses. This whole process took about 10 months to complete, from September 2011 to June 2012.
A 36-question online survey, created in Qualtrics, was active for two months, starting on October 14, 2012, and yielded responses from representatives of 116 NPOs (a response rate of 79%). About 18% of respondents
did not answer questions about partnerships. Missing data were collected through Google searches. All of the NPOs had some kind of online presence, such as a website, blog site, Facebook page, or other platform. Generally, NPOs reported their partnering organizations’ names and locations, but did not always specify types of partnerships (e.g., financial or working partnership). So, categorized partnership data were not used in this analysis. Following the survey, semi-structured interviews of NPO representatives were conducted, based on a purposeful sample (N=38) selected from diverse neighborhoods to maximize heterogeneity. I conducted the interviews from July 2012 to September 2012; 27 were conducted by phone, while 11 were in-person.
Results, Analysis, and Interpretations
About 71% of NPOs that parti-cipated in this survey had official
nonprofit 501(c)(3) status. Most of these organiza-tions (43%) were established in the 2000s. Almost all the organizations included more than one focus area in their mission, including food distribution (49%), community economic development (47%), community capacity-building (45%), food educa-tion and training (42%), food produceduca-tion (36%), food justice (35%), food security (27%), and food policy (25%).
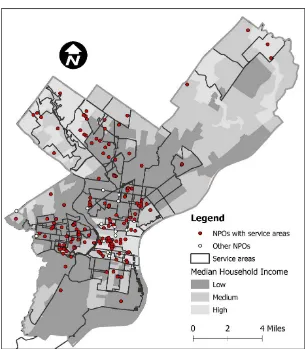
About 52% of the NPOs were place-based and reported having designated service areas. Among the rest, many were either issue-based or had citywide service areas. A few considered the entire Philadelphia metropolitan region to be their service area. Another category of NPOs had community-based programs, but their programs were placed in a number of neighborhoods. Figure 1 highlights 80
NPOs that had designated service areas, ranging from 0.08 to 66 square miles (0.2 to 171 square kilometers), with a mean value of four square miles (10 km2) for a service area.
Human Capital Related Variables
As part of building human capital, Philadelphia NPOs offered or organized various types of food-focused programs throughout the year.
Educational program participation. The
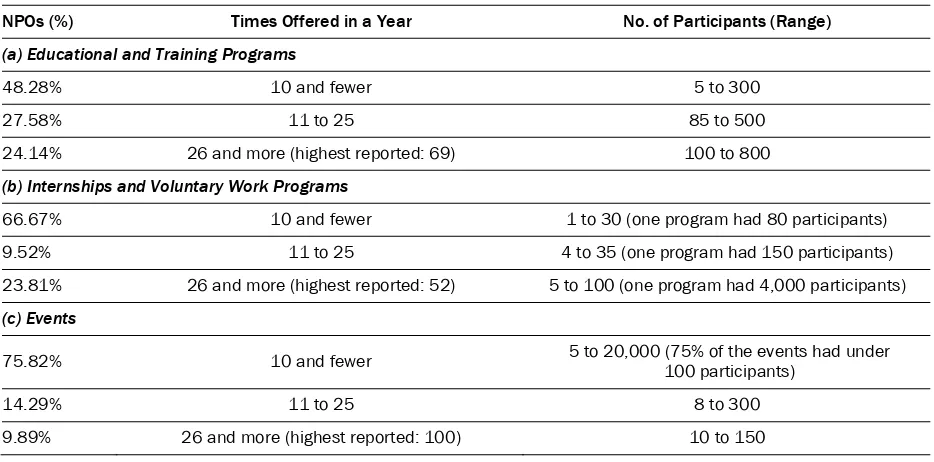
48% of NPOs that participated in this survey each offered educational and training programs an average of 10 times in one year. These programs attracted a wide range of attendance, from just 5 to 300. Section (a) of Table 1 provides details by the number of times education is offered and the number of participants. Not included in this table was an organization that was an outlier that offered such programs 150 times in a year that drew a total 4,000 participants.
Internship and/or volunteer program participation.In general, the numbers of internships or voluntary programs offered were half the numbers of educational or training programs. About 67% of NPOs offered
internships or voluntary work programs up to 10 times a year. A range of one to 30 participants enrolled in these programs, although one program
had 80 participants. See section (b) of Table 1 for details by the number of times these opportunities are offered and the number of participants.
Community event participation.Many
NPOs hosted or arranged food-focused events, such as block parties, potlucks, work parties, fund-raising events, lectures or discussions, movie or music events, tours, and workshops (e.g., on cooking, food preservation, drip irrigation, and green roofs). About 76% of NPOs offered 10 or fewer events in one year. These events were of various scales, attracting a wide range of participants, from only 5 to 20,000 people. However, about 75% of these events had fewer than 100 participants. Only two NPOs reported that their events attracted the greatest number of visitors (10,000 and 20,000 visitors). Section (c) of Table 1 provides a detailed breakdown by the number of times these events are offered and the number of participants.
Financial and Physical Capital Related Variables
Job creation and retention.About 71% of the NPOs that participated in this survey reported that their food-related projects created or retained one to 10 jobs during the last 12 months. About 19% reported creating or retaining 11 to 25 jobs, and the rest reported creating or retaining 26 or more
Table 1. Program and Event Participation by NPOs
NPOs (%) Times Offered in a Year No. of Participants (Range)
(a) Educational and Training Programs
48.28% 10 and fewer 5 to 300
27.58% 11 to 25 85 to 500
24.14% 26 and more (highest reported: 69) 100 to 800
(b) Internships and Voluntary Work Programs
66.67% 10 and fewer 1 to 30 (one program had 80 participants)
9.52% 11 to 25 4 to 35 (one program had 150 participants)
23.81% 26 and more (highest reported: 52) 5 to 100 (one program had 4,000 participants)
(c) Events
75.82% 10 and fewer 5 to 20,000 (75% of the events had under 100 participants)
14.29% 11 to 25 8 to 300
jobs. A few NPOs that were involved in urban agriculture (UA) mentioned that they hired full-time employees only during the growing season. In terms of the numbers of full-time and part-time staff, the organizations varied greatly. The largest NPO reported 200 full-time staff and no part-time staff. On the other hand, 17% of NPOs reported that they had no full-time staff and only 1 to 4 part-time staff, and they relied mostly on voluntary services. The largest proportion (39%) reported that they had 6 to 30 full-time staff and up to 20 part-time staff.
Assistance to local businesses.About 72% of NPOs that responded to the survey reported that they assisted other organizations or local businesses, including monetary, labor, technical, informational, or other forms of assistance such as consulting, grant-writing, training, and designing gardens and plantings.
Vacant land remediation.About 71% of the
NPOs that participated in this survey had some kind of UA program. About 59% of organizations remediated vacant land for food production in their service areas. The NPOs managed a wide range of city parcels, from 1 to 30, located either in a single or multiple neighborhoods. One NPO rep-resentative responded that the organization maintained 2,000
prop-erties, equivalent to 10 million square feet (930,000 square meters) of land. The nature of land ownership varied as well; 48% of the NPOs had an agreement with private property owners, 31% owned lands, 21% practiced guerrilla garden-ing, in which they garden on land they do not have the legal right to utilize, and 17% had a lease from the city.
Social Capital Related
Variables
Engagement of vulnerable population.
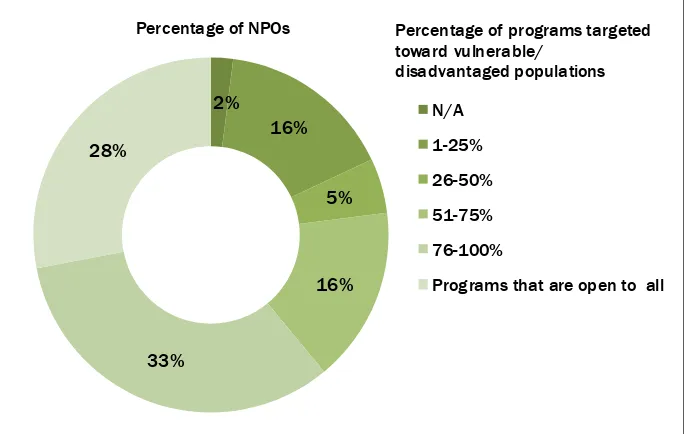
About 33% of the NPOs that participated in this survey reported that at least three-quarters of their programs, if not all, were targeted toward
vulnerable or disadvantaged populations (e.g., older adults, lower-income, minority, refugees, ethnic groups, and minority religious groups). About 28% responded that their programs were open to all. “We do not target specific group of populations, our programs are all-inclusive,” was one comment. Detailed data are available in Figure 2. Answering a follow-up question, about 76% of NPOs said their events were free and 10% said their events were donation-based. Only 15% charged a fee, ranging from US$5 to US$65 per event. About 58% of organizations that had any produce-selling programs accepted payments via either one or more types of government assistance cards (e.g., EBT, WIC). In this way they engaged lower-income families or individuals and contributed to the overall economic development of their service areas.
Community engagement. When asked about
the approximate ratio of attendees in programs or events that came from the NPO service areas, about 10% of the respondents said that 50% of attendees came from their service areas, while the rest came from other parts of the city or even the
Figure 2. Percentage of Surveyed Nonprofit Organizations’ (NPOs’) Programs That They Report Are Targeted Toward Vulnerable Populations
2%
16%
5%
16%
33% 28%
N/A
1-25%
26-50%
51-75%
76-100%
Programs that are open to all Percentage of programs targeted toward vulnerable/
suburbs. About 77% of NPOs reported that their events and programs primarily attracted local residents, saying that about 75% to 100% of the attendees attended from their own constituencies. About 13% of NPO respondents said that they did not know the location of their participants and that they never asked for this information.
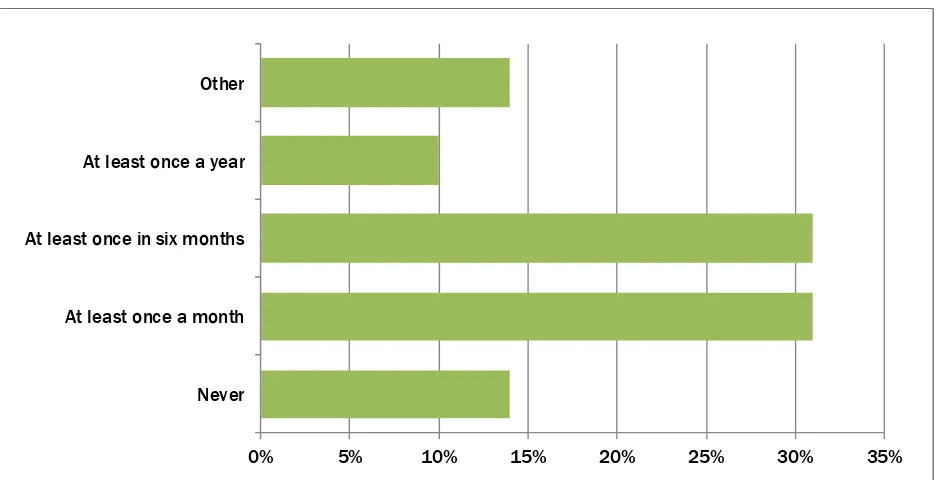
In response to a question about community engagement, “How often does your organization
host meetings with community members or stake-holders to plan activities and events?” about 31% NPOs reported that they hosted such meetings at least once a month, or once in six months. Approximately 14% of these NPOs said that they never had such meetings or never communicated with their constituents in this way. See details in Figure 3. About 95% of the community meetings had an attendance ranging from 5 to 50 people,
depending on the size of the NPOs, the type of
programs, and the size of their service areas. Only two respondents claimed that they were able to attract up to 100 community
participants in such meetings.
The next question was about the ways in which NPOs communicated with their constituents. About 94% of NPOs that responded to this question used digital communication highly or the most
Table 2. Methods of Communication with Constituents Reported by Nonprofit Organizations (NPOs)
Communication Type % of NPOs —High Use % of NPOs —Medium Use % of NPOs —Low Use
Digital Communicationa 94% 0% 6%
Print Mediab 41% 34% 25%
In-Person Communicationc 71% 18% 12%
Through Local Newspapers 7% 33% 60%
Other 50% 25% 25%
a Email, social media announcement or message, text message, website announcement, etc. b Letter, leaflet, newsletter, brochure, poster, etc.
cDoor-to-door outreach, social gathering, phone call, etc.
Note: Percentage calculated out of total responses in one particular category, not all responses in all categories. Total percentage rates differ, because not all NPOs answered in each category and few NPOs reported high use of both types of communications.
0% 5% 10% 15% 20% 25% 30% 35%
Never At least once a month At least once in six months At least once a year Other
frequently, whereas 71% had high use of in-person communication. These two categories were not mutually exclusive. NPOs also used print media, local newspapers, and other categories such as “events,” “word of mouth,” and “community education workshops.” Details of these findings along with an explanation of the communication types are provided in Table 2.
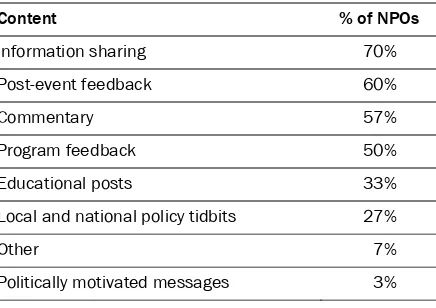
Since this study had a special interest in disadvantaged neighborhoods that may have a digital divide issue, there were a few additional questions about digital communication. Most NPOs that used digital communication used email listservs as the primary media. The number of listserv members varied from 10 to 25,000. About 93% of these NPOs also had either a designated website or a blog site. In terms of social media, 91% used Facebook; some used Twitter, YouTube, and other platforms. In social media, they posted various types of content and also welcomed contributions from their users or fans. Tables 3 and 4 provide details. The final question about digital community engagement was “Do users’ comments posted on your website, blog, or social network sites influence the organization’s
activities?” Only 38% NPOs said yes.
Organizational Capital Related Variables
Organizational capacity. The annual operating budget of the participant NPOs varied greatly. There were a few grassroots organizations without any operating budget, but 4% of NPOs had a budget above US$10 million, 27% had budgets of US$1 to US$10 million, 22% had budgets of US$100,000 to under US$1 million, 14% had budgets of US$10,000 to under US$100,000, and 6% had budgets below US$10,000. About 27% of survey participants did not respond to this question.
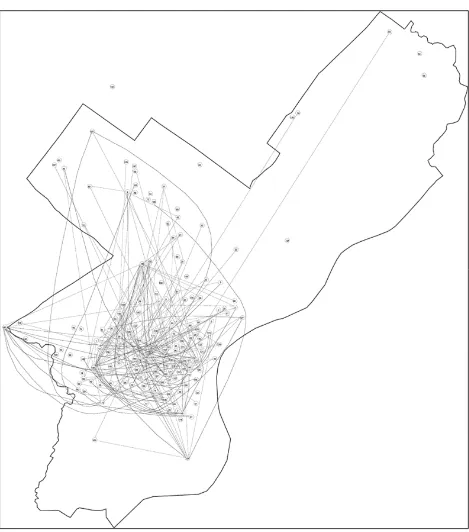
Spatial network analysis (SPNA). Visual-izing the spatial network connections of all NPOs was probably the most exploratory and time-consuming task of this study. After collecting data on partnerships between all the NPOs, these network connections were drawn using AutoCAD software. This drawing was done on top of a scaled map of Philadelphia with actual organizational locations. Figure 4 features
interorganizational networks (IONs) as line connections for NPOs that were included in this study. The straight or curved nature of line connections had no bearing on the significance or types of connections; they were chosen according to the ease or clarity of drawing. As interpreted from this figure, more NPOs were spatially concentrated toward the central part of the city (Center City), so naturally this area had a higher presence of network connection lines. The 38 NPOs that did not report any partners were left alone as single points without any connections. The ION is spread throughout a portion of the whole city, not concentrated in some smaller “network neighborhoods,” as described by Hipp, Faris, and Boessen (2012).
Table 3. Types of Content Nonprofit Organizations (NPOs) Usually Shared Through Social Media
Content % of NPOs
Event and program announcements 97%
Information sharing 82%
Post-event stories 70%
Educational posts 64%
Commentary 48%
Local and national policy tidbits 48%
Politically motivated messages 12%
Other 12%
Table 4. Types of Content People Usually Shared Through Nonprofit Organizations’ (NPOs’) Social Media Platforms
Content % of NPOs
Information sharing 70%
Post-event feedback 60%
Commentary 57%
Program feedback 50%
Educational posts 33%
Local and national policy tidbits 27%
Other 7%
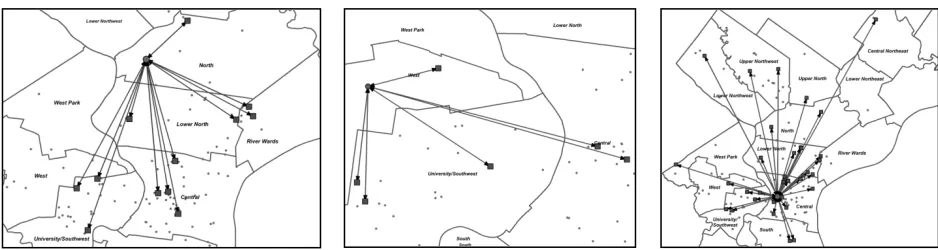
Spatial bridging and bonding networks.
The Origin-Destination Matrix tool available in the GIS software ArcGIS Network Analyst Extension was used to locate these NPOs and their partners,
display network connections and directions, and calculate the length (geodesic distance) of each network. Three examples are provided in Figure 5. According to this analysis, 65% of NPOs formed Figure 4. Interorganizational Network of Food-related Nonprofit Organizations (NPOs) with
partnerships with at least one NPO located outside of their planning districts (we refer to these as spatial “bridging” partners). In contrast, 44% of NPOs made partnerships with at least one NPO located within the same planning district (we refer to it as spatial “bonding” partners). NPOs with higher numbers of spatial bridging partners were mostly located in the Central District. Most inter-viewees considered these NPOs to be key or cen-tral players in Philadelphia’s food systems network. It was observed that the more spatial bridging networks an NPO had, the more central it was to the whole organizational network. This interpreta-tion is consistent with Kropczynski and Nah (2011). Although distance was a factor for some networks (the majority of network lengths were in the range of only 2 to 5 miles, or 3 to 8 kilometers), a few networks went beyond the city limit,
expanding to the inner-ring suburbs, rural Pennsylvania, and even the neighboring state of New Jersey. NPOs, however, did not prioritize any specific geographic boundaries when they chose a partner, either bonding or bridging.
Interorganizational network.The majority
of NPOs (81%) said that they were related to other NPOs because they received funding, such as direct funds, transfer of funds, or subcontracts, from those NPOs. The same percentage of NPOs partnered with other NPOs to execute a program or policy. More details on the types of partnerships are provided in Table 5.
There were a few organizations that formed short-term financial
partnerships with other NPOs. These partnerships often were manifested in the form of donations and tools or volunteer exchanges. On the other hand, there were a few organizations that partnered with big for-profit companies, most often in order to receive financial or food donations. Regardless of these factors, it is evident from this survey that most NPOs were partnered with not only other NPOs, but also with the government and for-profit organizations.
The interviews and field observations not only supported the findings from the survey, but also explained the ION patterns in the city. It was not distance or geographic boundary, but common agenda, power, or political interest that these food-focused NPOs were considering while choosing partners. Competition was one of the key reasons many NPOs did not want to form partnerships in the same neighborhood. One NPO representative explained this pattern:
We make partnerships with [other NPOs] when there is a match.…Either there is a common interest, a grant proposal, or a Table 5. Types of Interorganizational Partnerships
Types of Partnerships % of NPOs
Received funding (grants, donations, sponsorships, etc.) 81%
Executed a program or policy together 81%
Wrote grant proposals together 67%
Provided funding (grants, donations, sponsorships, etc.) 28%
Other 8%
project.…Yes, distance does matter, it’s always great to have a partner in the same neighborhood, but we need more than that…say “power.” [NPOs] in the Center City have the political and economic power to make things happen.…We need [a] continu-ous funding stream. Partnering with [NPOs with “power”] makes more sense [compared to] partnering with a small organization in your neighborhood that may not even last more than a year. (An interviewee from the West Philadelphia District)
Many smaller NPOs did not have enough staff support to pursue funding and partners. One NPO representative shared an opinion that reflected similar sentiments to another small NPO:
Yes, [we are a] small organization. We care about food access issues and we are trying our best to bring some positive changes in the neighborhood landscape with the help of volunteers and community participants. Yes, partnerships are good, but as long as there is a common focus on the issues [of our own neighborhood]. We tried to participate in bigger forums and whatnot.…They discuss issues from city or regional perspectives. It’s all good, but we [want to] be focused on our neighborhood for now. Yes, we don’t get much visibility, attention, or news coverage, and that is okay as long as we are able to function. (An interviewee from the North District)
Many NPOs raised concerns about insecurity or inconsistency in an established network:
It’s great to be a part of a big, visible network, but we need to make sure smaller NPOs can survive without the help or dependency from bigger [NPOs]. In recent times we have seen that [some] long-term [programs] are being discontinued due to lack of funding or the change in administration in a foundation. What if an [NPO] is being unplugged from the system? What would happen to the [organizational] network? If two or three
actors are thrown out of an established network, will the [network] safety net work? The [network] graph of NPOs is not
monolithic—there will be rises and falls. (An interviewee from the University/Southwest District)
Challenges Faced by NPOs
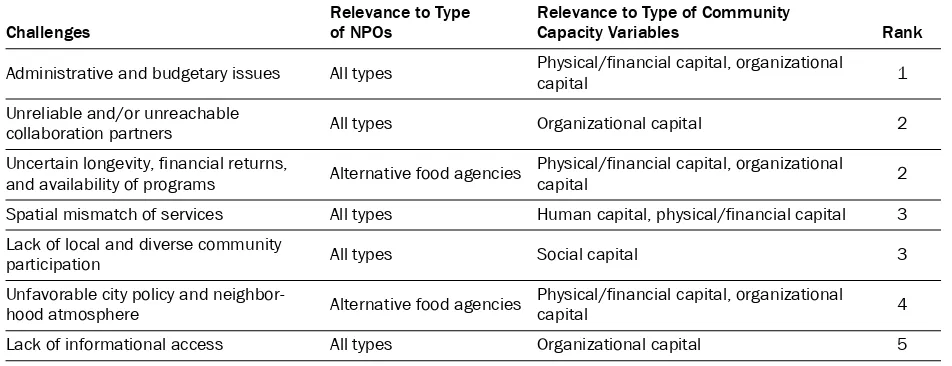
NPOs that participated in this study reported facing a number of general challenges. According to most NPOs, the key challenges were related to organizational and physical/financial capitals. Table 6 provides a list of challenges, two of which were relevant only to the NPOs focusing on the alter-native food movement (e.g., community gardens, farmers markets, community supported agricul-ture). The challenges were ranked based on their importance to these NPOs.
Administrative and Budgetary Issues
Most NPOs reported that administrative and budgetary issues are at the top of their list. With a larger budget they would be able to put more effort into educating the public on the value of buying local or eating nutritious food. Organizational challenges were also faced due to limited staff support. Many NPOs consisted of a group of volunteers; due to inadequate staff capacity, they could not perform program evaluation, which is one of the key deliverables for many grants. NPOs also reported that they found it difficult to respond to many funding requests for proposals (RFPs) due to the lack of clarity of organizational mission and criteria for eligibility for grant applications. This limited their funding further.
Collaboration and Coordination Issues
The responses regarding their organizational net-works showed that 38 NPOs had no partners at all. Some NPOs had only short-term financial partner-ships with others. These partnerpartner-ships were often manifested in the form of donations, tools, or volunteer exchanges. On the other hand, there were a few organizations that partnered mostly with large, for-profit companies for financial or food donations.
In terms of evaluating potential partnerships, most NPOs preferred common interests or agendas, financial standing, and political connec-tions over geographic proximity. This finding is consistent with Chen and Graddy (2010). Since most larger and issue-based NPOs were located in the Central District, many place-based NPOs rooted in different neighborhoods were connected with them, regardless of their distances or geo-graphic boundaries. This tendency led to a particu-lar pattern in the city, where the most “visible” NPOs were the ones that made partnerships with larger NPOs, were featured in the media, inter-viewed by university researchers and students, and invited to the policy-making process. On the con-trary, many smaller NPOs, although working hard on the ground and in their own neighborhoods, did not get the attention they needed to promote their programs or attract new volunteers.
According to many NPOs, “collaborating with
the right community partners to ensure long-term success” was a key challenge. Partnerships between NPOs most often are dependent on successful past collaborations and the trust generated among them (Bess, Speer, & Perkins, 2012; Kegler, Rigler, & Honeycutt, 2010). Unlike what Strauss (2010) suggested, NPOs studied in this research project formed more bridging partnerships than bonding, geographically speaking. Although NPOs within the same neighborhood always competed with one another to catch a funder’s attention, there was no alternative to strengthening coordination and partnerships, not only among NPOs, but also with other organizations such as government agencies and institutions.
Uncertain Longevity, Financial Returns,
and Availability of Programs
Although various indirect benefits of food-related programs and events were found, the direct contri-bution of these programs to the economic devel-opment of areas was somewhat limited. Most jobs created through these programs were not perma-nent, not full-time, not well-paid, and did not offer any fringe benefits.
Discontinuity of programs can become a major barrier in forming organizational partnerships. Philadelphia has witnessed a sharp decline in com-munity gardens since the 1970s after the discontin-uation of critical resources, including major
fund-Table 6. Challenges Faced by Nonprofit Organizations (NPOs), Ranked by Importance
Challenges Relevance to Type of NPOs Relevance to Type of Community Capacity Variables Rank
Administrative and budgetary issues All types Physical/financial capital, organizational capital 1
Unreliable and/or unreachable
collaboration partners All types Organizational capital 2
Uncertain longevity, financial returns,
and availability of programs Alternative food agencies Physical/financial capital, organizational capital 2
Spatial mismatch of services All types Human capital, physical/financial capital 3
Lack of local and diverse community
participation All types Social capital 3
Unfavorable city policy and
neighbor-hood atmosphere Alternative food agencies Physical/financial capital, organizational capital 4
Lack of informational access All types Organizational capital 5
ing streams. It took almost two decades to explore new networks and find new funding sources for them. Since NPOs are often considered to be anchors and great resources to community life, many public and grant-providing agencies are interested in building their organizational capaci-ties. Problems arise when programs start becoming successful and then are discontinued because of an obsolete funding stream.
Many programs and events organized by these NPOs, especially the smaller ones, are run mostly by volunteers. These volunteers are temporary; sometimes they participate as part of a service-learning course or school project, or due to work requirements. They thus do not have a long-term commitment to the programming of the NPO and do not continue volunteering after their short-term reason.
Spatial Mismatch of Services
NPOs reported three types of spatial mismatch. The first type is related to hunger relief agencies. About 700 food cupboards are located throughout the city, but some high-poverty areas either do not have cupboards or have cupboards with limited inventory and operating hours. This problem was also identified and explained by Meenar (2012). The second type of spatial mismatch is related to healthy food outlets. Some areas, typically known as food deserts, do not have affordable healthy food outlets, be they full-scale grocery stores or farmers markets. Due to lack of clientele for healthy food, the presence of crime, and lower population density, along with significant vacant and underutilized lands and properties, many chain grocery stores do not want to invest in these underprivileged neighborhoods. Due to unhealthy food habits or expensive healthy food, or miscon-ceptions about healthy food prices, some residents may not make the effort to shop at grocery stores or farmers markets that are not easily accessible. The third type of mismatch is related to NPOs that administer urban food production and nutrition education or community development–related projects. In some parts of city, a group of people who are mostly nonresident volunteers may start community gardening projects that are not fully supported or embraced by local residents.
Al-though they organize community events targeted toward nutrition education or community capacity building in that community, most participants may come from other parts of the city. Researchers have identified such areas as White spaces in Black or Latino/a places (see Meenar & Hoover, 2012, and Hoover, 2013).
Lack of Local and Diverse Community Participation
For many NPOs, engaging neighbors or volunteers in regular program decision-making and organiza-tional development is an ongoing challenge. This may be more important in neighborhoods with diverse populations, including racially and ethni-cally diverse populations, immigrant populations, and economically diverse populations. NPOs struggle with outreach techniques that would be appropriate and consistent with such diversity.Most NPOs appreciated feedback on their programs and events from neighborhood stake-holders or residents, but they did not necessarily incorporate this feedback into their decision-making process. Community meetings targeted toward the participation and engagement of local residents were not offered on a regular basis. NPOs usually received feedback through social media, email, or other tools only after the events or programs were over. Although soliciting comments or ideas prior to a program or event could be more useful or effective, many NPOs claimed that they could not attract many participants even though they offered such community meetings. On the other hand, in the event that feedback was pro-vided by the residents and stakeholders, only a few NPOs were able to incorporate those comments into the planning process of future events. Lack of clarity or usefulness of the suggestions was a key concern.
would arise, as these NPOs are missing a signifi-cant proportion of the community they are trying to serve.
Unfavorable City Policy and Neighborhood
Atmosphere
This challenge, also referred to as “political road-blocks or bad policy,” was mentioned primarily by NPOs dedicated to the alternative food movement. They complained about the lack of an organized UA constituency, resource scarcity influencing an organization’s unwillingness to collaborate, and unwillingness of city administration to fully recog-nize the value of UA. Some NPOs mentioned that designated land use, even if land is currently vacant, may be a barrier in obtaining permission to do UA. Getting water access for irrigation was another barrier. Many NPOs supporting gardens “see land tenure as key to preserving these UA projects that represent the community’s legacy. Without land tenure or land use protections, many gardens have been lost, due to development pressure, when cities have sold UA spaces or allowed them to go to sheriff’s sale” (Meenar, Featherstone, Cahn, & McCabe, 2012, p. 6). Unfriendly or harsh neighbor-hood conditions also jeopardize the operations of many UA projects. A few NPOs that participated in this study shared their frustration with levels of neighborhood crime and the types of vandalism their projects faced.
Lack of Informational Access
Although the programs and events offered by these NPOs primarily targeted people from their service areas, some of them attracted participants from all over the city—sometimes even at a higher rate. Most NPOs could not or did not regularly track their participants’ locations. Lack of such locational data is a challenge for these NPOs, potential project funders, and researchers. In particular, the lack of or limited level of data on hunger relief recipients is critical. Even if available to a limited extent, such data are not compre-hensive, not available in a ready-to-use format, not shared with public or other agencies, and not updated on regular basis. This creates barriers to the analysis and understanding of location-specific needs (Meenar, 2012).
Conclusion and Policy Recommendations By taking the city of Philadelphia as a case
example, this research has documented how NPOs attempt to build community capacity through a variety of food-related projects, programs, and events. The analysis was primarily based on the NPO contribution to the following community capitals: human, physical and financial, social, and organizational. Based on the findings and discus-sions in this study, it can be concluded that most Philadelphia-based food-related NPOs are gener-ally trying to improve a range of community capi-tals in order to make a contribution to the overall community capacity. While a majority of NPOs are able to contribute more in improving human and social capitals, they face a number of challenges as well, mostly related to organizational and financial/ physical capitals. Here I offer some policy sugges-tions for these NPOs. In order to increase their effectiveness in improving community capacity, the NPOs not only need assistance in responding the challenges mentioned in this paper, but also need to take their own initiatives in three areas:
(1) Making or strengthening coordination efforts with smaller, neighborhood-based
NPOs. Community-based NPOs require “greater
decision-making power in the policy-making process and resource autonomy for policy imple-mentation” (Silverman, 2004, p. 2). This is especially important for smaller NPOs and
Generation (formerly Healthy Foods Green Spaces; http://www.groundedinphilly.org/HFGS-about/).
Lack of coordination is very common among smaller NPOs such as hunger relief agencies (Meenar, 2012). Smaller NPOs, in most cases, cannot increase their connectivity, as they do not have the staff support to reach out to potential partners or maintain an informal relationship. This is consistent with the findings by Lewis, Scott, D’Urso, and Davis (2008). This does not mean, however, that the network itself is flawed. Perhaps community-based, smaller NPOs do not need to be interconnected in that way, as long as their projects (such as community gardens) are grounded in the neighborhoods and well-connected to local residents. But advocacy, outreach, and
membership-based NPOs that have citywide or even regional service areas need to be closely connected to smaller, community-based NPOs that oversee actual on-the-ground projects.
Although NPOs always compete with one another to catch a funder’s attention, there is no alternative to strengthening coordination and partnerships not only among NPOs, but also with other organizations such as governments and insti-tutions. Coordination efforts among NPOs and smaller agencies can be made stronger at both the local and state levels. Pennsylvania’s Inter-Agency Council on Food and Nutrition proposed a blue-print for a hunger-free Pennsylvania by recognizing the fact that state government alone cannot address hunger or eliminate chronic food insecurity by 2020—a goal announced by the state in 2007.
(2)Engaging local and diverse stakeholders in
the decision making process. Most
community-based NPOs in Philadelphia work closely with neighborhood residents, regardless of their age, income, and race. Geographically, the majority of those residents who are active participants of community-based programs live within walking distance (a quarter of a mile or 0.4 km) of a project site such as a community garden (Meenar & Hoover, 2012). However, White, middle-class, young people are more actively involved in such programs and activities, even if those are located in a predominantly Black or Latino/a spaces (Meenar
& Hoover, 2012). Other research suggests that African Americans participate less in the alternative food movement because recent programs have become “unbearably white” (Guthman, 2011) in many places.
NPOs need to explore new avenues to better connect with minority populations and engage them in their activities, as well as in decision-making or the planning and development pro-cesses. It is not about “educating” or “enlighten-ing” them, but involving those individuals who are interested in such activities but may feel estranged from formal programs. A grassroots initiative in a neighborhood, or one initiated by an NPO that has worked in the neighborhood for a long period of time and earned the trust of neighborhood resi-dents, will usually have a higher chance of success. Research suggests that “trust is a stronger prerequi-site for, than an outcome of, civic engagement” (Jennings & Stoker, 2004, p. 370). Problems arise when an NPO with a citywide network decides to start a project in a specific neighborhood without any prior discussion and partnership with local residents. Many times those are the projects that become prone to vandalism. In addition, trust can be increased by implementing feedback or comments received from stakeholders via both traditional and digital communication methods.
agencies and NPOs to administer projects targeted to disadvantaged or disinvested neighborhoods, and assessment of the outcomes of such projects through research and publications. Philadelphia’s health department has such partnerships with The Food Trust, which has become an important collaboration behind projects such increasing the number of farmers markets and healthy corner stores in lower-income neighborhoods.
In conclusion, I present the merit and limita-tions of this study and possible future research topics. According to the knowledge of this author, no other study has systematically analyzed the key challenges faced by urban NPOs that try to build community capacity through food-related pro-grams and policies. At the same time, no other study has applied a combination of community capitals framework and spatial network analysis to food-related NPOs. These two would be consid-ered to be the key contributions of this research to the literature on NPO capacity-building in food systems work. Although the study was based on Philadelphia-area NPOs, the findings and discus-sions are applicable and transferable to similar cities.
This study does have limitations. Learning local residents’ opinions about the projects or programs of the NPOs in their neighborhoods could have provided an in-depth understanding of the role of NPOs in building community capacity, but this potentially time-consuming and expensive step was beyond the scope of this study. Engaging residents in such discussions should be the next logical step. This could be paired with a detailed spatial social network analysis of food-related projects and their participants. In addition, this study could have benefited from some discussions on cultural and natural capitals, which again could be included in follow-up research. Finally, this study could have been more effective and complete if more detailed and reliable data on financial capital were available. This may include systematic data on organizational budgets, surpluses, and expenses; job creation and retention; employee salaries and benefits; and dissolution or turnover rates. The economic development aspect of food-related research will be a key research agenda in the near future.
Acknowledgements
It would not be possible for me to undertake this study without the support from Philadelphia’s nonprofit organizations that are dedicated to local food systems, food justice, and food insecurity issues. I would like to thank those administrative staff, managers, grassroots activists, and com-munity organizers. I acknowledge Dr. Deborah Howe, Dr. Lynn Mandarano, Dr. Michele
Masucci, and three anonymous JAFSCD reviewers for their constructive feedback on an early draft of this paper. Finally, I would like to thank five students of the Department of Community and Regional Planning at Temple University who assisted me with data collection, data processing, and field visits: Gregory App, Jason Hachadorian, Brian Olszak, Matthew Popek, and Christine Thomas.
References
Alkon, A. H., & Agyeman, J. (Eds.). (2011). Cultivating food justice: Race, class, and sustainability. Cambridge: Massachusetts Institute of Technology Press. Anderson, M. D., & Cook, J. T. (1999). Community
food security: Practice in need of theory? Agriculture and Human Values, 16(2), 141–150.
http://dx.doi.org/10.1023/A:1007580809588
Apaliyah, G., Martin, K., Gasteyer, S., Keating, K., & Pigg, K. (2012). Community leadership
development education: Promoting civic engagement through human and social capital.
Community Development,43(1), 31–48.
http://dx.doi.org/10.1080/15575330.2011.645043
Baillie, E., Bjarnholt, C., Gruber, M., & Hughes, R. (2009). A capacity-building conceptual framework for public health nutrition practice. Public Health Nutrition, 12(8), 1031–1038.
http://dx.doi.org/10.1017/S1368980008003078
Bess, K. D., Speer, P. W., & Perkins, D. D. (2012). Ecological contexts in the development of coalitions for youth violence prevention: An organizational network analysis. Health Education & Behavior, 39(5), 526–537.
http://dx.doi.org/10.1177/1090198111419656
Brown, L., Lafond, A., & Macintyre, K. (2001).
Measuring capacity building. Chapel Hill: University of North Carolina. Retrieved from
Chaskin, R. J. (2001). Building community capacity: A definitional framework and case studies from a comprehensive community initiative. Urban Affairs Review, 36(3), 291–323.
http://dx.doi.org/10.1177/10780870122184876
Chaskin, R. J., Brown, P., Venkatesh, S., & Vidal, A. C. (2001). Building community capacity. New York: Aldine de Gruyter.
Chen, B., & Graddy, E. A. (2010). The effectiveness of nonprofit lead-organization networks for social service delivery. Nonprofit Management and Leadership,
20(4), 405–422.
http://dx.doi.org/10.1002/nml.20002
Coleman, J. S. (1988). Social capital and the creation of human capital. American Journal of Sociology,
94(Suppl.), S95–S120.
Emery, M., & Flora, C. (2006). Spiraling-up: Mapping community transformation with community capitals framework. Community Development, 37(1), 19–35.
http://dx.doi.org/10.1080/15575330609490152
Fallov, M. A. (2010). Community capacity building as the route to inclusion in neighbourhood regeneration? International Journal of Urban and Regional Research, 34(4), 789–804. http://dx.doi. org/10.1111/j.1468-2427.2010.00905.x
Flora, C. B., & Flora, J. L. (2007). Rural communities: Legacy and change (3rd ed.). Boulder, Colorado: Westview Press.
Goodman, R., Speers, M., McLeroy, K., Fawcett, S., Kegler, M., Parker, E., Smith, S., Sterling, T., & Wallerstein, N. (1998). Identifying and defining the dimensions of community capacity to provide a basis for measurement. Health Education & Behavior, 25(3), 258–278.
http://dx.doi.org/10.1177/109019819802500303
Gottlieb, R., & Joshi, A. (2010). Food justice. Cambridge: Massachusetts Institute of Technology Press. Green, G., & Haines, A. (2008). Asset building and
community development (2nd ed.). Los Angeles: Sage. Guthman, J. (2011). If they only knew: The unbearable
whiteness of alternative food. In A. H. Alkon & J. Agyeman (Eds.), Cultivating food justice: Race, class, and sustainability (pp. 263–281). Cambridge:
Massachusetts Institute of Technology Press. Hipp, J. R., Faris, R. W., & Boessen, A. (2012).
Measuring ‘neighborhood’: Constructing network neighborhoods. Social Networks, 34(1), 128–140.
http://dx.doi.org/10.1016/j.socnet.2011.05.002
Hoover, B. (2013). White spaces in black and Latino places: Urban agriculture and food sovereignty.
Journal of Agriculture, Food Systems, and Community Development, 3(4), 109–115.
http://dx.doi.org/10.5304/jafscd.2013.034.014
Jennings, M. K., & Stoker, L. (2004). Social trust and civic engagement across time and generations. Acta Politica, 39(4), 342–379.
http://dx.doi.org/10.1057/palgrave.ap.5500077
Kegler, M. C., Rigler, J., & Honeycutt, S. (2010). How does community context influence coalitions in the formation stage? A multiple case study based on the community coalition action theory. BMC Public Health, 10, 90. http://dx.doi.org/10.1186/1471-2458-10-90
Kendall, A., & Kennedy E. (1998). Position of the American Dietetic Association: Domestic food and nutrition security. Journal of the American Dietetic Association, 98(3), 337–342.
http://dx.doi.org/10.1016/S0002-8223(98)00079-0
Kropczynski, J., & Nah, S. (2011). Virtually networked housing movement: Hyperlink network structure of housing social movement organizations. New Media & Society,13(5), 689–703.
http://dx.doi.org/10.1177/1461444810372786
Labonte, R., Woodard, G. B., Chad, K., & Laverack, G. (2002). Community capacity building: A parallel track for health promotion programs. Canadian Journal of Public Health, 93(3), 181–182.
Lancaster, K., & Smith A. (2010). Building community capacity in resource poor neighborhoods:
Community-university partnerships. Explorations, V,
128–158.
Lewis, L. K., Scott, C. R., D’Urso, S. C., & Davis, J. (2008, November). Development of interorganizational communication: A case study of an IOR network. Paper presented at the annual conference of the National Communication Association, San Diego, California. Mandarano, L. (2015). Civic engagement capacity
building: An assessment of the citizen planning academy model of public outreach and education.
Journal of Planning Education and Research, 35(2), 174–187.
http://dx.doi.org/10.1177/0739456X14566869
McEntee, J., & Agyeman, J. (2010). Towards the development of a GIS method for identifying rural food deserts: Geographic access in Vermont, USA.
Applied Geography, 30(1), 165–176.
Meenar, M. (2012). Feeding the hungry: Food insecurity in lower income communities. In N. Reid, J. Gatrell, & P. Ross (Eds.), Local food systems in old industrial regions (pp. 71–91). Surrey, England: Ashgate.
Meenar, M., & Hoover, B. (2012). Community food security via urban agriculture: Understanding people, place, economy, and accessibility from food justice perspective. Journal of Agriculture, Food Systems, and Community Development, 3(1), 143–160.
http://dx.doi.org/10.5304/jafscd.2012.031.013
Meenar, M. R., Featherstone, J. P., Cahn, A. L., & McCabe, J. (2012, September). Urban agriculture in post-industrial landscape: A case for community-generated urban design. 48th International Society of City and Regional Planners (ISOCARP) Congress, Perm, Russia. Retrieved from http://www.isocarp.net/
Data/case_studies/2071.pdf
Mountjoy, N. J., Seekamp, E., Davenport, M. E., & Whiles, M. R. (2014). Identifying capacity indicators for community-based natural resources manage-ment initiatives: Focus group results from conser-vation practitioners across Illinois. Journal of Envir-onmental Planning and Management, 57(3), 329–348.
http://dx.doi.org/10.1080/09640568.2012.743880
Nord, M., Andrews, M., & Carlson, S. (2009). Household food security in the United States, 2008. Washington, D.C.: U.S. Department of Agriculture. Retrieved from http://www.ers.usda.gov/publications/err83
Phillips, R., & Pittman, R. H. (2009). An introduction to community development. London: Routledge. Putnam, R. (1995). Tuning in, tuning out: The strange
disappearance of social capital in America. PS: Political Science & Politics, 28(4), 664–683.
http://dx.doi.org/10.1017/S1049096500058856
Silverman, R. (2004). Social capital and community development. In R. Silverman (Ed.), Community-based organizations: The intersection of social capital and local context in contemporary urban society (pp. 1–15). Detroit, Michigan: Wayne State University Press. Strauss, J. R. (2010). Capitalising on the value in
relationships: A social capital-based model for non-profit public relations. Prism, 7(2). Retrieved from
http://www.prismjournal.org/fileadmin/Praxis/
Files/Journal_Files/Strauss.pdf
Taylor, M. (2003). Public policy in the community. Basingstoke, Ontario: Palgrave Macmillan. Twombly, E. C., De Vita, C. J., & Garrick, N. (2000).
Mapping nonprofits in Philadelphia, Pennsylvania. Washington, D.C.: Center on Nonprofits and Philanthropy, The Urban Institute.
Wekerle, G. R. (2004). Food justice movements: Policy, planning, and networks. Journal of Planning Education and Research, 23(4), 378–386.