MEASURING EFFICIENCY OF PUBLIC SECTOR
BANKS AND NEW GENERATION PRIVATE
SECTOR BANKS IN INDIA
Sayoojkumar.K.P,Assistant professor of Economics SNG College Chelannur Kozhikode,Kerala,India
Abstract
Banks play an important role in all sectors of the economy. In this paper, the efficiencies of selected Public sector and Private sector were calculated through Data Envelopment Analysis (DEA). The efficiency calculation of banks is done with three inputs and three outputs. The inputs are deposits, number of employees, operating expenses. The outputs are investments, other income and advances. The efficiencies on constant returns scale and variable returns scales are calculated with the CCR model. Data sources are from CMIE, the website of Indian Bank Association for three public sector and three new generation private sector banks and RBI.
Keywords: Efficiency Evaluation, Data Envelopment Analysis, Pulic sector banks, New generation private sector banks, Decision Making Unit
1.Introduction:
The Banking sector plays an important role in the mobilization and allocation of savings in an economy. It has very prominent role in the economy thorough money and capital markets. The banking system in India is significantly different from that of other nations because of the country’s unique economic, social and geographic characteristics. The Reserve Bank of India (RBI) was given broad regulatory authority over commercial banks in India.Indian banking sector is a combination of public and private sector banks. Private sector bank is one in which majority of stakes are held by private shareholders. In early period of banking industry, private sector banks played a vital role in catering the needs of people as well as business community. But since 1969 the public sector banks dominated the private sector banks as a result of nationalization. Again in 1991, as a result of liberalization, scope for private sector banks increased considerably. In the circumstances explained above it is needed to evaluate the performance of private sector banks and to know how private sector banks are influencing the common man and Indian economy. In current paper 3 major public sector banks and 3 new generation private sector banks were considered for performance evaluation. The secondary data pertaining to 3 new generation private sector banks and three public sector banks during the year 2014 to 2017 has been obtained from the website of Indian Bank Association ,CMIE and RBI.
A lot of research has been conducted over the past decade in the area of measuring efficiency of firms, companies, banks and other decision making units. Studies in the past used conventional ratios such as return on assets to evaluate efficiency. Most of these studies which look at the efficiency concentrate on cost, profit income or revenue efficiencies. Later research in the area used various measures of performance which include a non-parametric approach- Data Envelopment Approach Data Envelopment Analysis is a linear programming based technique for measuring the performance efficiency of organisational units which are termed as Decision Making Units (DMUs). This technique aims to measure how efficiently a DMU uses the resources available to generate a set of outputs (Charnes et al.1978).The efficiency measure proposed by Farrell in 1957 did not receive much attention until Charnes, Cooper and Rhodes formulated a mathematical programming approach to frontier estimation in 1978.They coined the term DEA for the first time. The DEA model developed by C harnes, Cooper, and Rhodes had an input orientation and assumed constant return to scale (CRS). The CRS model offers best solutions only when all firms are operating at optimum scale. Subsequent studies by Banker, Charnes and Cooper have considered alternative sets of assumption and introduced a variable return to scale (VRS) model. The VRS model measures technical efficiency devoid of scale efficiency (SE) effects. 2. Review of literature
There have been a lot of studies analyzing bank efficiency in India. In some studies, bank efficiency was measured by a number of financial indicators and compared over various categories of banks.
Chiranjeevi Gudala, E.S.V. Narayana Rao(2014) studied about major private Sector banks and evaluated their performance using Data Envelopment Analysis (DEA). Super-efficiency DEA model was also used to rank the private sector banks. They found that under technical efficiency, nearly 38 percent of private sector banks exhibited constant performance
Kumar and Gulati (2007) studied the technical efficiency of public sector banks in India using two data envelopment analysis models like the CCR model and Andersen and Petersen’s super-efficiency models. The analysis was performed for twenty seven public sector banks in the year 2004-05. The results show that the technical efficiency scores range from 0.632 to 1, with an average of 0.885. Thus, the overall level of technical inefficiency in Indian public sector banking industry has been found to be around 11.5%. Finally, foreign banks are found to be more cost-efficient but less profit-efficient relative to domestically owned private banks and state-owned banks. The banks affiliated with SBI group were found to outperform the nationalized banks in terms of operating efficiency.
Sanjeev (2006) studied efficiency of private, public, and foreign banks operating in India during the period 1997-2001 using data envelopment analysis. He also studied if any relationship can be established between the efficiency and non-performing assets in the banks. He found that the there is an increase in the efficiency in the post-reform period, and that non-performing assets and efficiency are negatively related
interest income, non-interest income, credits and investments). They found that deposits are dominant in producing all outputs and the technical efficiency of raising interest margin is varied across the banks. In particular, they found that the reform measures that had been introduced since 1992 have not helped the banks in raising their interest margin. Also, in general, they found that private/foreign banks performed better than public banks.
Rammohan and Ray (2004) compared the revenue maximizing efficiency of public, private and foreign banks in India, using physical quantities of inputs and outputs in the 1990’s, using deposits and operating costs as inputs, and loans, investments and other income as outputs. They found that public sector banks were significantly better than private sector banks on revenue maximization efficiency, but difference in efficiency between public sector banks and foreign banks was not significant.
Kumbhakar and Sarkar (2003) found evidence on Indian banks that public sector banks have not responded well to the deregulation measures while private sector banks have improved their performance mainly due to the freedom to expand output.
Necmi Kemal Avkiran(2003) used DEA model, taking interest expense and non-interest expense as input variable and interest income and non-interest income as output variables to examine the efficiency of Australian trading banks for the period 1986 to 1995 and found that their efficiency rose in the post regulation period and acquiring banks were more efficient than target banks.
Rammohan (2002, 2003) also used financial measures for comparing operational performance of different categories of banks over a period of time. But, most studies emphasised at the efficiency of Indian commercial banks concentrate on cost, profit, income or revenue efficiencies, using DEA as a technique of analysis. While few studies concentrate on the efficiency of only public sector banks, others look at the relationship between ownership and efficiency.
Sathye (2001) studied the relative efficiency of Indian banks in the late 1990’s and compared the efficiency of Indian banks with that of foreign banks. He found that the public sector banks have a higher mean efficiency score as compared to the private sector banks in India, but found mixed results when comparing public sector banks and foreign commercial banks in India. He also found that most banks on the efficient frontier are owned by foreign company.
Sarkar et al. (1998) compared public, private and foreign banks in India to find the effect of ownership type on different ef ficiency measures.
Chen and Yeh (1998) calculated the operating efficiencies of 34 commercial banks of Taiwan’s banks using the DEA model where in input variables included staff employed, interest expense and output variables include loans investment and interest revenue, non-interest revenue and bank assets. The study concluded that a bank with better efficiency does not always mean that it has better effectiveness.
Bhattacharya et al (1997) used DEA to measure the productive efficiency of Indian commercial banks in the late 80s to early 90s and studied the impact of policy on liberalizing measures taken in 1980s on the performance of various categories of banks. They found that Indian Public banks were the best performing banks as the banking sector was overwhelmingly dominated by Indian public sector banks while the new private sector banks were not emerged fully in the Indian banking sector.
3. Objective:
To analyze and compare the results of the banks’ Technical efficiencies through Constant Returns Scale (CRS) and Variable Returns Scale (VRS) for 3 public sector banks and 3 new generation private sector banks.
4. Research methodology:
The present study considers three public sector commercial banks and three new generation private commercial banks as decision making units. This paper considers three inputs they are- deposits, number of employees, operating expenses and the three outputs are investments, other income and advances. In this study the data related to various input and outputs over the period 2013 - 2017 have been taken from RBI website (www.rbi.org.in). The six decision making units (banks) considered in the present study are as follows:
The efficiency scores would be based on the CCR model of DEA. DEA-SOLVER Software developed by Cooper, Seiford and Tone is used for analysis.
Efficiency = Weighted sum of outputs Weighted sum of inputs
The weights for the ratio are determined by the restriction that the similar ratios for every DMU have to be less than or equal to unity, thus reducing multiple inputs and outputs to a single “virtual” input and single “virtual” output without requiring pre-assigned weights. Therefore, the efficiency score is a function of the weights or the “virtual” input-output combination. Suppose that there are n DMUs, each with n inputs and s outputs, relative efficiency score of a given DMU0 is obtained by solving the following linear programming model.
subject to
where
Hence, the
Denominator in the efficiency score θ shown above is set equal to one, the transformed linear programming model for can be written as follow.
Hence, the denominator in the efficiency score θ shown above is set equal to one, the transformed linear programming model for can be written as follow.
Max θ
= Subjectt to,
And
And vi ≥ 0, i = 1, 2, 3, . . . m,
ui ≥ 0, r = 1, 2, 3, . . . s
The linear programming model shown above will be run n times in identifying the relative efficiency score of all the DMUs. Each DMU selects input and output weights that maximize its efficiency score. Generally, a DMU is considered to be efficient if it obtains a score of 1.00, implying 100% efficiency; whereas a score of less than 1.00 implies that it is relatively inefficient. Three public sector banks under study are, State Bank of India, Punjab National Bank, and Canara Bank. Three new generation private sector banks are HDFC bank, Axis bank and Yes bank
5. Results and analysis:
The efficiency scores of major banks commercial banks show a great variety and no two banks can be said to have a same trend throughout.
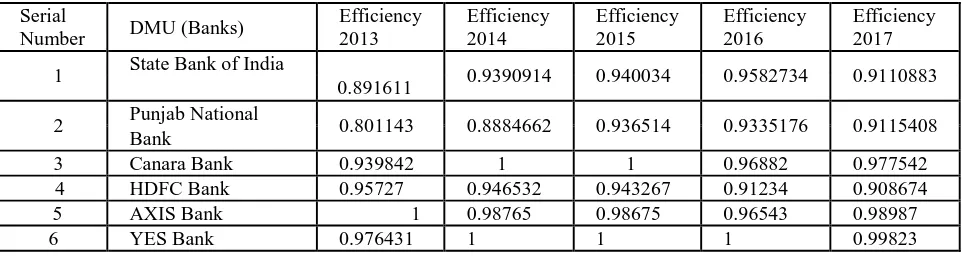
Table 1 Technical Efficiency of Banks
Serial
Number DMU (Banks)
Efficiency 2013
Efficiency 2014
Efficiency 2015
Efficiency 2016
Efficiency 2017
1 State Bank of India
0.891611 0.9390914 0.940034 0.9582734 0.9110883
2 Punjab National 0.801143 0.8884662 0.936514 0.9335176 0.9115408
Bank
3 Canara Bank 0.939842 1 1 0.96882 0.977542
4 HDFC Bank 0.95727 0.946532 0.943267 0.91234 0.908674
5 AXIS Bank 1 0.98765 0.98675 0.96543 0.98987
6 YES Bank 0.976431 1 1 1 0.99823
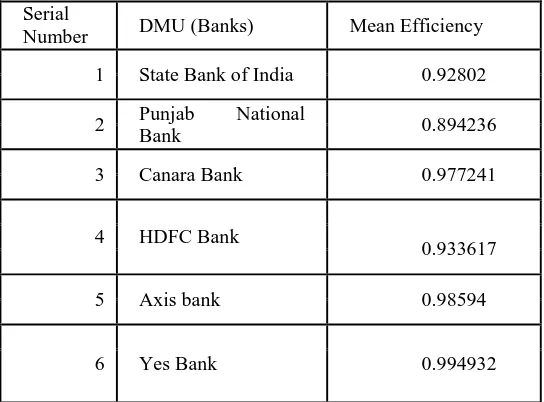
Table 2 Mean Efficiency of Banks
Serial
Number DMU (Banks) Mean Efficiency
1 State Bank of India 0.92802
2 Punjab National
Bank 0.894236
3 Canara Bank 0.977241
4 HDFC Bank
0.933617
5 Axis bank 0.98594
6 Yes Bank 0.994932
The overall performance of public sector and private sector commercial banks can be analysed from the averages of their efficiency scores. Canara bank is the best performing bank with an average efficiency of 0.977241 from public sector commercial bank and Panjab national bank is the least performing bank with the mean efficiency of 0.89.Considering various factors affecting the efficiency, still it ranges in between satisfactory level. In the case of New generation private sector banks Yes bank is the best performing bank with an average efficiency of 0.994932 from private sector commercial bank and HDFC bank is the least performing bank with the mean efficiency of 0.933617. A point to be noted is that the poor performers are those with high figures of Deposits and Advances. The banks with lower deposits and advances have shown efficiency, whereas banks with huge deposits and advances are not that efficient.
Table 3
Period wise Average Efficiency scores of Banks
Serial No Period
Average Efficiency
score of
Public sector banks
Average Efficiency
score of
New generation Private sector banks
1 2013 0.877532 0.97790
2 2014 0.942519 0.978061
3 2015 0.958849 0.976672
4 2016 0.953537 0.959257
5 2017 0.93339 0.965591
The results suggest that the mean technical efficiency of public sector banks improved from 2013 to 2015 and then technical efficiency declined during the period 2016 and 2017. The result also shows that Canara Bank is efficient and they have shown consistency in their performance. The results also suggest that the mean technical efficiency of new generation private sector banks improved from 2013 to 2014 and then technical efficiency declined during the period 2015 and 2016 and efficiency improved in 2017. The result also shows that Yes Bank is most efficient from among the banks.
6. Conclusion:
References:
[1].Nand Kumar and Archana Singh,(2015) Efficiency Analysis of Banks using DEA: A Review, International Journal of Advance Research and Innovation,Vol 1,pp.120-126.
[2].Chiranjeevi Gudala, E.S.V. Narayana Rao, Performance Evaluation and Ranking of Private Sector Banks using Data Envelopment Analysis and Super- efficiency Model,International Journal of scientific and research publication.vol 4,issue 12 December 2014
[3].ChamiLatha, Patil N, Mohanthy R.P. (2009). Measuring Efficiency in Indian cement industry using DEA. Industrial Engineering Journal, Vol.2, issue No-04 oct-2009, India.
[4].Banker, R.D. and Natarajan, R.(2008). Evaluating Contextual Variables Affecting Productivity Using Data Envelopment Analysis. [5].Avikaran, N.K., (2006), productivity Analysis in the service sector with Data Envelopment Analysis. Third Edition AustraliaOperations Research, vol. 56, No.1, pp.48-58.
[6].Wu, D. (D), Yang, Z., Liang, L.(2006 b).Using DEA.Nema Network Approach to evaluate Branch efficiency of a Large Canadian Bank. Expert syst App, vol. 31, No.1, pp. 108-115.
[7].Millam, J.A. and Aldaz, N. (2004) Efficiency and technical change in inter-temporal inter-sectoral DEA. Journal of Productivity Analysis, vol.21, pp.7-23.
[8].Tone, Kaoru, Sahoo, B., (2004)Evaluating Cost Efficiency and Return to Scale in the Life Insurance Corporation of India using Data Envelopment Analysis. Socioeconomic Planning Sciences,Vol. 3
[9].Cooper, W.W., Seiford, L.M.and Tone, K. (2000). Data Envelopment Analysis: A comprehensive Text with Models, Applications, References and DEA-solver software Kluwer Academic Publishers: Boston.
[10].Tone, K.(1997) A Slacks-based Measure of Efficiency in Data Envelopment Analysis, Research Reports, Graduate School of Policy Science, Saitama University, Urawa, Saitama, Japan, also forthcoming in European Journal of Operational Research.
[11].Tubene, S.L. (1997) Measuring Productivity across Nations using Data Envelopment Analysis. Ph.D. dissertation. USA: Dept. of Agricultural Economics, Kansas State University. Pp.1-154.
[12].Tone, K.(1996). A Simple Characterization of Returns to Scale in DEA, Journal of the Operations Research Society of Japan, vol.39, pp.604-613.9 (Dec 2005), No.4, pp. 261-285.
[13].Banker, R.D., Chang, H., Cooper, w.w.(1996).Equivalence and implementation of alternative methods of determining returns to scale in Data Envelopment Analysis. European Journal of Operational Research,vol. 89,pp.473-481.
[14].Banker, R.D., Bardhan, I., Cooper, W.W.(1996). A Note On Return to Scale in DEA. European Journal of Operational Research, vol. 88, pp.583-585
[15].Thore, S. Kozmetsky, G. and Phillips, F.(1994). DEA of financial statements Data: The US computer industry. The Journal of Productivity Analysis, vol. 5, pp. 229-248.
[16].Banker, R.D. and Thrall, R.M.(1992).Estimating Most Productive Scale Size Using Data Envelopment Analysis. European Journal of Operational Research, vol. 62, pp.74-84.
[17].Charnes, A., Cooper, W.W. (1991). DEA Usages and Interpretations reproduced in Proceedings of International Federation of Operational Research Societies 12th Triennial Conference, Athens, Greece, 1990.
[18].Charnes, A., Cooper, W.W.(1989), An Note on the Efficiency Characterizations Obtained in Different DEA Models.Socio-Economic Planning Sciences, vol. 22, pp.253-257.