ADULT FORENSIC AGE ESTIMATION USING
MANDIBULAR SECOND MOLAR
RADIOGRAPHS- A SHORT STUDY
M. Chandrasekhar,
Prof&HOD,
Department of Oral medicine and radiology, Government Dental college.
Abstract:
Determination of age of an individual is one of the most important aspects of medico legal casesand anthropological research. Radiographs can be used directly to measure the rate of secondary dentin
deposition.
Aims and objectives:
The aim of the present study is to demonstrate a non- invasive and feasible methodof age estimation using radiographs of multi rooted teeth for adults in Kadapa population.
Materials and methods:
The study was conducted in the Department of Oral Medicine and Radiologyat Government Dental College and Hospital, Kadapa. A total of 80 patients aged between 20-60 years were
selected. A panoramic radiograph was taken for every patient. Pulp crown height (PCH) and crown root trunk
height (CRTH) was recorded on the mandibular second molar followed by calculating pulp crown root trunk
height ratio (PCTHR) & then a regression equation was derived. The radiological age is measured by using
the regression equation & the disparity between the radiograph and chronological age was noted, the results
were statistically analysed.
Results:
It was observed that although there was weak negative co relation between age & PCTHR (r=-0.231), the results were statistically significant (p= 0.036). The regression equation thus derived though of
minimum use in age group of 20-30 and 50-60 years , it gave excellent results in estimation age of individuals
of 30- 40 years and 40-50 years with a mean difference of 3.41 and -4.80 respectively.
Conclusion:
Assessment of pulp chamber height could be used to yield significant values and is a reliableparameter for age estimation in the field of forensic odontology.
Key words:
PCH, CRTH, PCTHR, AGE ESTIMATION.Introduction:
Age estimation plays a crucial role and is of paramount concern that carries significanthave minimal influence on it (1, 2, 3). Age estimation is usually done for a plethora of reasons. Some of them
might include post mortem identification, verifying age in immigrants & refugees with disputed birth records
in mass fatalities like tsunami or manmade catastrophes like terror attacks. Age estimation also helps in both
civil & criminal cases making the dentists a part in investigating the crime. Hence the need for the precise
and reliable method to estimate age, particularly adult age has become increasingly important(4). And there
is a continuous search for an age estimation which is simple, effortless, less time consuming. Thus the aim
of the present study is to demonstrate a non invasive & feasible procedure of age estimation using radiographs
of multi rooted teeth in adults.
Methods:
The prospective study was conducted in the Department of Oral Medicine and Radiology, atGovernment Dental College and Hospital (GDCH, Kadapa). Ethical clearance was obtained from the
institutional ethical committee. Subjects were selected for the present study with the inclusion criteria of
subjects with known date of birth and subjects willing to participate in the study with no obvious dental
disease and developmental disorders. Exclusion criteria were: impacted teeth, teeth with root canal treatment,
severe regression changes, teeth with radio opaque fillings, developmental anomalies of teeth and pregnant
women. A total of 80 panoramic radiographs were taken using a panoramic machine [Vatek, Pax 400c with
Kvp 110/230 v weight 200kg].
The subjects were divided into 4 groups; each group consisting of 20 subjects and this 20 Consists of
10 subjects from each gender based on their chronological age: group I (20-30 Years); group ii (31-40
years); group iii (41-50 years); group IV (51-60 years) respectively. All the subjects underwent routine
clinical examination and the relevant data was entered in a structured proforma. Patient’s birth date was noted
after analyzing their specific identity Proofs to record the chronological age.
The panoramic radiograph of each subject was assessed on the OPG connected computer monitor
with the help of the measure option on the tool bar points were marked on the central fosse and the highest
point on the root furcation and a line was drawn connecting these lines. The points on the roof and floor of
pulp chamber bisecting this line were also marked. Points were marked on the central fossa and the highest
point on the root furcation and a line was drawn connecting these lines. The points on the roof and floor of
pulp chamber bisecting this line were also marked [figure 1]. Between chronological age and pulp chamber
chamber height and crown root trunk height; pulp chamber crown root trunk height ratio (PCH/CRTH =
PCTHR) in order to avoid projection error. [All measurements were recorded by a single observer.]
Statistical analysis: Satatistical analysis was done using SPSS[statistical package for social sciences]version
20.The values were then subjected to paired t test and pearson’s correlation was calculated.
Results
:
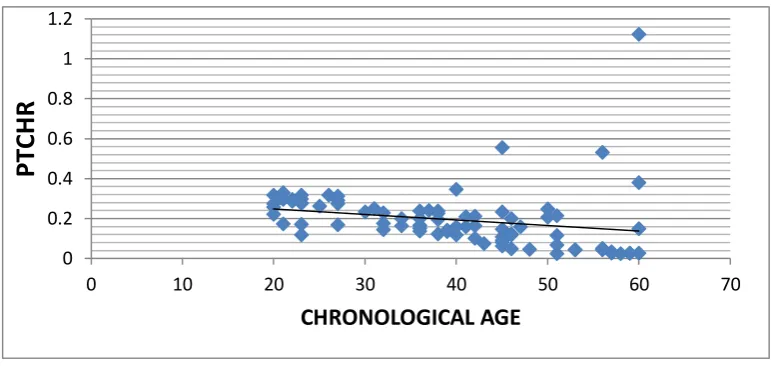
The co relation between the chronological height and pulpal crown height ratio was recorded(PCTHR) which showed a negative correlation and a scattered plot was made which revealed the same [figure
2]. Pearson correlation was done which yielded a negligible co relation between PCTHR and chronological
age (r= -0.231) [table 4] But it was statistically significant (p=0.036), A regression equation was then
calculated.
Estimated age =-18.940(PCTHR) +43.254; with a variation of 5.35% (r2 =0.053).
The regression equation thus obtained was used to calculate the radiograph age of subjects as a total
sample, in males, females with respect to each age group. The mean difference between the chronological
age and radiographic age was also noted [table 5], which revealed that in general there was an over estimation
of +14.76 years in group 1 (20-30 y) & under estimation of -15.73 years in group IV (50-60Y); Where as in
group II (31-40 y) & group III (41-50 y) the variation was found to be within 5years which is inacceptable
range of forensic odontology.
Discussion:
To determine the age of a human remain, many anatomical structures can be used, but theadvantage of tooth over other means is that they are more resistant to peri and post mortem tissue altering
affects. With an added advantage that teeth can be examined clinically and radiographs can be taken with
minimal radiation exposure to living individuals. The assessment of morphological parameters of the teeth
is considered to be more reliable compared to other methods of age estimation. One in particular is the
assessment of pulp/tooth area ratio is the indirect quantification of the secondary dentin deposition. As this
eliminates the affect of environmental factors this could be considered as an internal examination (5).
Bodecker in 1925 demonstrated that the apposition of secondary dentin correlated with age (6). The previous
studies on the radiographic methods of age estimation using pulp tooth ratio were done on single rooted tooth
like central incisors, lateral incisors, canines, mandibular premolars (7, 8, 9). Camerie et al in 2004 conducted
a study which utilized pulp tooth ratio of mandibular 2nd molar for adult age estimation (10). So this study was
equipment with more reliable results. The minimum age of the person included in the study was 20 years and
was maximum was 60 years. A difference of 10 years was considered because in a previous study conducted
by Morse DR (1991) found statistically significant shrinkage in root canal due to dentin deposition was
noticed with progression of 10 years of age (11). From the results of group wise PCTHR it can be interpreted
that as the age progresses the PCTHR decreases. The same was represented on a scattered plot.
The Pearson correlation co efficient between age and PCTHR depicted a weak negative co relation
(r= -0.231) but it was statistically significant (p=0.036). A linear regression co efficient was derived, the
regression equation was formulated. And the difference between the chronological age and radiographic age
in total and gender wise was noted (Table 5, 6, 7). The result was as follows; the mean difference in the age
Group I (20-30 years) was 14.76, Group ii (31-40 years) was 3.41, Group iii (41-50 years) was -4.80. Group
IV (51-60 years) was -15.73 years. From the results it can be inferred that the formation of secondary dentin
in younger individuals was less when compared to older subjects. Other factors like diet can also influence
the pulp chamber height. Here in the local population of Kadapa do not have severe abrasive habits which
explain the reason for the less reduction of pulp chamber in this group (20-30 years). Where as in the group
IV there was underestimation of -14 years this may be contributed to the irregularity in the morphology of
the tooth and less appreciation of pulp chamber height when compared to the clear visualisation of the
morphology of tooth, pulp chambers in younger counterparts on radiographs. On the contrary in group IV
(31-40 years) and group v (41-50 years) yielded excellent results with 3.41 and -4.80. Hence it can be inferred
that the regression equation thus derived could be routinely incorporated for age estimation of adults in local
population of Kadapa with a variability of ±5 years.
In the previous study conducted by George Matthew et al 2013 in Kerala population where the whole
sample was considered as a unit (12), contrarily we performed specific age wise study in general and also
gender specific which could be of good value in estimating the age of adults aged between 31-50 years.
Conclusion:
The regression equation derived was statistically significant which could be used for the localpopulation of Kadapa with a variability of 5 years in the age group of 31-50years. However, studies must be
conducted on a larger population in the future to improve the accuracy and reproducibility of the equation to
all age groups.
1) H. Soomer, H. Ranta, M.J. Lincoln, A. Pentilla, E. Leibur, Reliability and validity Of eight dental age
estimation methods for adults, J. Forensic Sci. 48 (2003) 149–152.
2) E.E. Keller, A.H. Sather, A.B. Hayles, Dental and skeletal development in various endocrine and
metabolic diseases, J. Am. Dent. Assoc. 81 (1970) 415–419.
3) T. Solheim, P.K. Sundnes, Dental age estimation of Norwegian adults—a comparison of different
methods, Forensic Sci. Int. 16 (1980) 7–13.
4) Jain RK, Rai B. Age estimation from permanent molar’s attrition of Haryana population. Indian J
Forensic Odontol 2009;2:59‑61
5) M. Babshet et al./Forensic science International 197 (2010) 125.e1-125.e4.
6) Meini A, Tangl S,Pernicka E,Fenes C,Watzek G. On the applicability of secondary dentin formation
to radiological age estimation in young adults.j Forensic Sci 2007 Mar;52(2);438-41 .
7) Jeevan MB, Kale AD, Angadi PV, Hallikerimath S. Age estimation by pulp/tooth area ratio in
canines: Cameriere’s method assessed in an Indian sample using radiovisiography. Forensic sci Int
2011;204(1-3):209.e1–209.e5.
8) Cameriere R, Cunha E, Wasterlain SN, De Luca S, Sassaroli E, Pagliara F, Nuzzolese E, Cingolani
M, Ferrante L. Age estimation by pulp/tooth ratio in lateral and central incisors by peri-apical X-ray.
J Forensic Leg Med. 2013 Jul;20(5):530-6.
9) Zaher JF, Fawzy IA, Habib SR, Ali MM. Age estimation from pulp/tooth area ratio in maxillary
incisors among Egyptians using dental radiographic images. J Forensic Leg Med. 2011;18(2):62-5.
10)Cameriere R, Ferrante L, Cingolani M. Variations in pulp/tooth area ratio as an indicator of age: a
preliminary study. J Forensic Sci. 2004 Mar;49(2):317-9.
11)Morse DR. Age-related changes of the dental pulp complex and their relationship to systemic aging.
Oral Surg Oral Med Oral Pathol. 1991 Dec;72(6):721-45.
12)GEORGE MATHEW et al adult forensic age estimation using mandibular first molar radiographs; a
novel technique. J Forensic Dent sci. 2013 Jan; 5(1) 56-59.
Figure 1: Shows steps in measuring the crown root trunk height and pulp chamber height.
(b) A line drawn connecting these points(c) Points on the roof and floor of the pulp chamber bisecting this line
marked.
Table 1: Shows study variables (PTH, CRTH, PCTHR) in total sample.
AGE GROUP PTH CRTH PCTHR
20-30 years 2.34 8.91 0.26
31-40 years 1.71 8.81 0.19
41-50 years 1.21 8.34 0.16
51-60 years 0.98 8.04 0.15
Table 2: Shows study variables in Males.
AGE GROUP PTH CRTH PCTHR
20-30 years 2.67 9.08 0.29
31-40 years 1.64 8.92 0.18
41-50 years 1.15 8.27 0.19
51-60 years 1.52 8.04 0.17
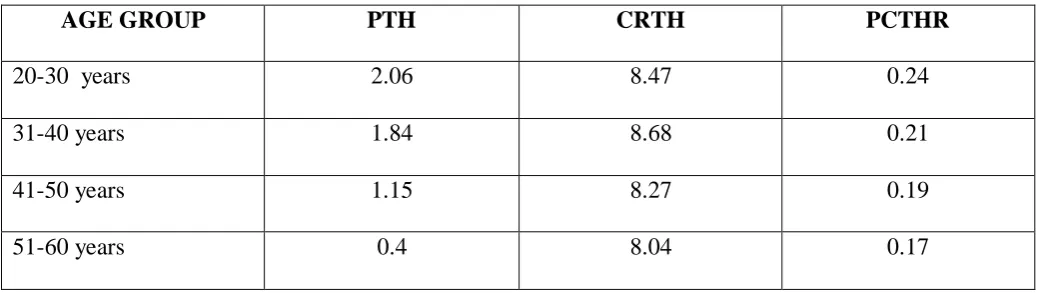
Table 3. Shows study variables in Females
AGE GROUP PTH CRTH PCTHR
20-30 years 2.06 8.47 0.24
31-40 years 1.84 8.68 0.21
41-50 years 1.15 8.27 0.19
51-60 years 0.4 8.04 0.17
Table 4: Shows Pearson co relation between chronological age and PCTHR
* Correlation is significant at the 0.05 level (2-tailed).
Table 5: Shows estimated age and chronological age in total sample 0
0.2 0.4 0.6 0.8 1 1.2
0 10 20 30 40 50 60 70
PT
C
H
R
CHRONOLOGICAL AGE
Age PCTHR
Age Pearson Correlation 1 -.231*
Sig. (2-tailed) .036
N 83 83
PCTHR Pearson Correlation -.231* 1
Sig. (2-tailed) .036
N 83 83
AGE GROUP CHRONOLOGICAL
AGE
ESTIMATED
AGE
MEAN
DIFFERENCE
20-30 years 23.47 38.24 14.76
31-40 years 36.15 39.56 3.41
41-50 years 44.84 40.04 -4.80
Table 6: Shows estimated age and chronological age in Males.
AGE GROUP CHRONOLOGICAL
AGE
ESTIMATED
AGE
MEAN DIFFERENCE
20-30 years 24.44 37.62 13.17
31-40 years 36.78 39.72 2.95
41-50 years 44.33 39.52 -4.81
51-60 years 55.56 39.997 -15.52
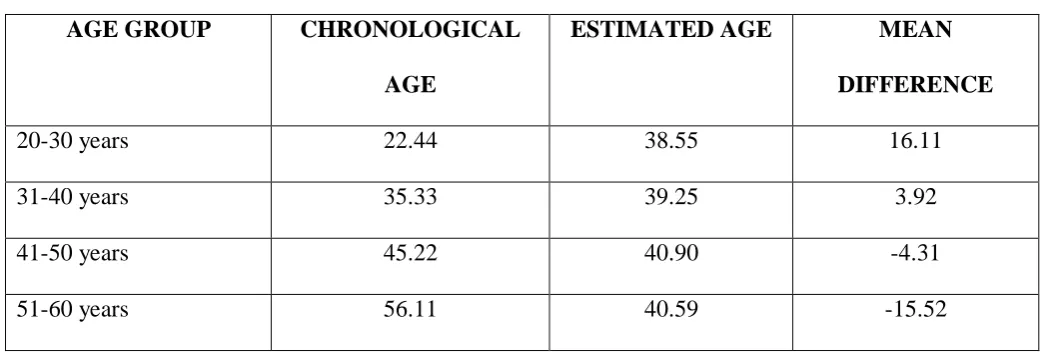
Table 7: Shows estimated age and chronological age in Females.
AGE GROUP CHRONOLOGICAL
AGE
ESTIMATED AGE MEAN
DIFFERENCE
20-30 years 22.44 38.55 16.11
31-40 years 35.33 39.25 3.92
41-50 years 45.22 40.90 -4.31
51-60 years 56.11 40.59 -15.52