www.pjbt.org ISSN Online: 2312-7791
ESTIMATION OF PAX8/PPAR FUSION GENE BY FISH TECHNIQUE IN FOLLICULAR THYROID LESIONS
Ban J. Qasim*, Alaa G. Hussein*, Wijdan B. Abid**, Buthinah I. Hameed***
*Department of Pathology, College of Medicine, Al-Nahrain University, Baghdad, Iraq. **Department of Biology, College of Education for Pure Sciences (Ibn Al-Haitham), University of Baghdad, Baghdad,
Iraq. ***College of Pharmacy, Mustansiryah University, Baghdad, Iraq. Email: forever.1964@yahoo.com
Article received 29.7.2018, Revised 2.9.2018, Accepted 9. 9. 2018
ABSTRACT
The purpose of the study was to detect PAX8/PPAR G gene rearrangement by fluorescent in situ hybridization (FISH) technique, the present study is the first time in Iraq used this technique to detect fusion gene in follicular thyroid lesions, follicular carcinoma (FC) follicular variant papillary of carcinoma (FVPC), follicular adenoma (FA) and follicular hyperplasia. A total of 120 paraffin block were included in the study, 30 blocks were (FC), 30 blocks were (FVPC). 30 blocks were (FA), 30 blocks were blocks thyroid follicular hyperplasia.20 blocks endocervical epithelium.20 paraffin blocks of colonic epithelium. The clinicopathological parameters were obtained from patients’ admission case sheets and pathology reports (age, gender). The description of measures regarding fluorescent instu hybridization of PAX8/ PPAR G fusion gene there was significantly highest in follicular carcinoma, followed by follicular variant of papillary carcinoma, then follicular adenoma and lastly by follicular hyperplasia The area under the curve for all three markers was >0.8.The p-value was highly significant for all three markers (P<0.001). Cutoff values that predict malignant thyroid follicles lesion were as following: score of >1 for Galectin-3 marker, score of >2 for HBME-1 marker and number of positive cells per 50 of >13 (>26%) for PAX8 /PPAR G fusion gene marker. The sensitivities for the three markers were 100.00 %, 90.00 % and 66.67 %, respectively, whereas the specificities were 88.30 %, 98.33 % and 100.00 % respectively.
Key words: Thyroid, PAX8 gene, FISH Technique.
INTRODUCTION
Constitutive activation of the MAP kinase/ERK pathway leads to tumor genesis by up regulating cell division and proliferation (Roberts, and Der, (2007)). Thyroid tumor harbors in about 5% of thyroidnodules (Popoveniuc, and Jonklaas (2012). This improvement can be utilized as a diagnostic marker for the differentiation between follicular thyroid carcinoma and adenoma, the PAX8/PPAR G rearrangement was recognized by fluorescence in situhybridization (FISH) (Algeciras-Schimnich, et al., (2010)). Papillary thyroid carcinoma (PTC) is known to harbor BRAF most commonly, follo-wed by RAS and RET/PTC, whereas follicular thyroid carcinoma (FTC) is characterized by the presence of either RAS or PAX8/PPARG (Kondo, et al., (2006)). The fusion gene PAX8/PPARG denoted as PAX8/PPAR G fusion protein (PPFP). In vitro and in vivo evidence indicate that PPFP can act as an oncoprotein, PAX8/PPAR G rear-angement is created by a translocation between chromosomal regions 2q13 and 3p25 (Ross, et al., (2009)).
This translocation results in a fusion transcript wherein most of the coding sequence of PAX8 (2q13) is fused in frame with the entire coding exons of PPARG 1.
MATERIALS AND METHODS
The study was done in the period between (2015-2017) in the department of Biology/ College of Education for Pure Science /Ibn-Haitham /Bagh-dad University and in the department of Pathology College of medicine/ Al-Nahrain University. Para-ffin blocks of thyroid tissue samples used in this study were collected from laboratories of Baghdad Teaching Hospital, Al-Khadhmiya Teaching Hos-pital, Al-Yarmouk Teaching HosHos-pital, Al-Kindi Teaching Hospital, Al-Karama Teaching Hospital, Ghazi Al-Hariri Hospital for surgical specialist in Baghdad, Al-Hussein Hospital (Kerbala Health Office) in Karbala, Sadder Medical City in Al-Najaf, Al-Sadder Teaching Hospital(Al-Ashraf/ pathology unit) in Basra, Rizgary Teaching Hos-pital in Erbil, Kalar Educational HosHos-pital in Al- Sulaymaniyah and private laboratories, for the years (2006-2016).
Hybridization Washing and Counterstain. Fluo-rescence microscope (Carl Zeiss,Germany) was used to visualling the FISH probe signals.
Data were collected, summarized, analyzed and presented using three statistical software prog-rams: the statistical package for social science (SPSS version 22), Categorical variables were pre-sented as number and percentage whereas numeric variables were presented either as mean and standard deviation (SD) or median and inter-quartile range (IQR), according to the results of Kolmogrov Smirnov test of normality distribution for numeric variables. The association between categorical variables was assessed using Chi-squ-are test and correction was done as needed. Comparison of mean values between two groups was carried out using either independent samples-t test or Mann Whitney U test, while comparison of mean values among more than two groups was carried out using either one-way analysis of vari-ance (ANOVA) test or Kruskal Wallis tests. Corr-elation was evaluated using Spearman corrCorr-elation test. Cutoff value for PAX8- FISH of follicular hyperplasia was calculated using invers beta func-tion in Microsoft Office Excels. Receiver operator characteristic (ROC) analysis was done to calcu-late cutoff values. P-value was considered signi-ficant when it was equal to or less than 0.05.
RESULTS
Figure (1-10) showed the cells expressing PAX8/PPARG fusion gene in study groups using fluorescent in situ hybridization (FISH). The des-cription of measures regarding fluorescent in situ hybridization (FISH) of PAX8/ PPARG fusion gene is summarized in table (1) and figure (11). Mean number of cells that showed signals of fus-ion gene per 50 cells was significantly highest in follicular carcinoma, followed by follicular vari-ant of papillary carcinoma, then follicular aden-oma and lastly by follicular hyperplasia; the val-ues were 18.12±10.29, 15.67±6.89, 9.22±1.86 and 5.00±1.00 respectively.
The cut-off value for positive samples was calcu-lated using beta inverse function in Microsoft
Off-20% (>10 cells out of 50) and presented in table (2). The total number of sample was forty sam-ples, the positive percentage in follicular hyper-plasia 0 consider them as negative, while positive cases were follicular adenoma 11.1%, follicular carcinoma 41.2% and follicular variant of papi-llary carcinoma 44.4%.
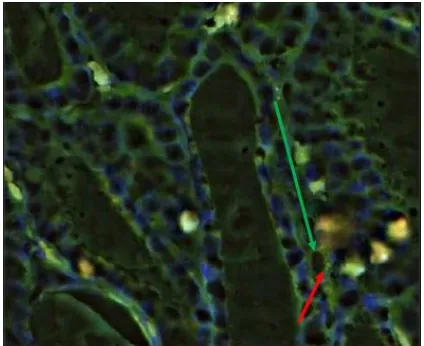
Figure 1: Tissue section of thyroid follicular adenoma by FISH analysis showing two separate green (2G) signals, two separate orange (2O) signals repeating the two normal PAX8-PPAR G loci.
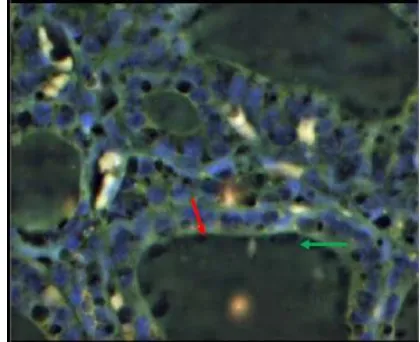
Figure 3: Tissue section of thyroid follicular carcinoma by FISH analysis showing aberrant cell: one green (1G), one orange (1O) two green –orange (2GO) fusion signal, including a fusion of PAX8 and PPARG.
Figure 4: Tissue section of thyroid follicular carcin-oma by FISH analysis showing aberrant cell: one green (1G), one orange (1O) two green –orange (2GO) fusion signal, including a fusion of PAX8 and PPARG.
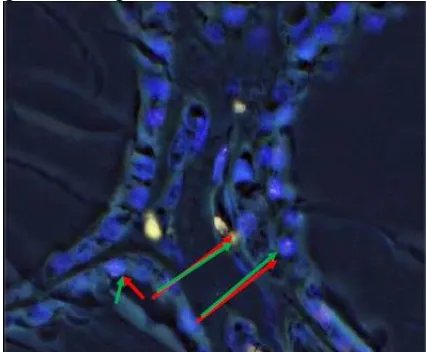
Figure 5: Tissue section of thyroid follicular variant of papillary carcinoma by FISH analysis showing aberrant cell: one green (1G), one orange (1O) two green – orange (2GO) fusion signal, including a fusion of PAX8 and PPARG.
Figure 6: Tissue section of thyroid follicular carcinoma by FISH analysis showing aberrant cell: one green (1G), one orange (1O) two green –orange (2GO) fusion signal, including a fusion of PAX8 and PPARG.
Figure 7: Tissue section of thyroid follicular hyper-plasia by FISH analysis showing two separate green (2G) signals, two separate orange (2O)signals reappea-ring the two normal PAX8-PPAR G loci.
Figure 9: Tissue section of thyroid follicular adenoma by FISH analysis showing two separate green (2G) signals, two separate orange (2O) signals reappearing the two normal PAX8-PPAR G loci.
Figure 10: Tissue section of thyroid follicular hyperplasia by FISH analysis showing two separate green (2G) signals, two separate orange (2O) signals reappearing the two normal PAX8-PPAR G loci.
Table 1: Mean number of cells showing PAX8/PPARG fusion gene signals using FISH. Cases in Study Groups
Parameter Follicular Carcinoma
FVPC Follicular Adenoma
Follicular Hyperplasia
P-value
Mean ±SD 18.12±10.29 15.67±6.89 9.22±1.86 5.00±1.00 <0.001 Median (IQR) 10.00 (18.50) 10.00 (12.5) 9.00 (1.50) 5.00 (2.00)
Range 10.00-35.00 10.00-26.00 6.00-13.00 4.00-6.00
*Kruskal Wallis test; HS: highly significant; IQR: interquartile range. FVPC; Follicular variant of papillary carcinoma.
Figure 11: Mean number of cells expressing PAX8/ PPARG fusion gene in the study groups using FISH. FVPC; Follicular variant of papillary carcinoma.
Table 2: Number and percentage of cases with positive PAX8/PPARG fusion gene using FISH. Cases in Study Group Total Cases Positive PAX8/PPARG fusion gene N%
Follicular carcinoma 17 7 (41.2)
Follicular variant of papillary carcinoma 9 4 (44.4)
Follicular adenoma 9 1 (11.1)
Follicular hyperplasia 5 0 (0.0)
Total 40 12 (30.0)
DISCUSSION
This study showed, following fluorescent in situ hybridization (FISH) of PAX8/PPARG fusion gene, mean number of cells per 50 cells was
signi-ficantly highest in follicular carcinoma, followed by follicular variant of papillary carcinoma, then follicular adenoma and lastly by follicular hyper-plasia. In this study two methods were used to
identify a cut-off value: the first one was to identify the level of expression at which a positive value is labeled since some cases of normal thyroid tissues and reactive hyperplastic tissue had false positive expression of PAX8/PPARG fusion gene and this was accomplished by using the beta inverse function in the Microsoft Office Excel 2007 as it was stated in the chapter of method. This method permitted identification of the cut-off value of > 20.1% (approximately 10 cells per 50 counted cells) in order to consider a positive expression of the PAX8/PPARG fusion gene. (Algeciras-Schimnich, et al., 2010)) Stated that samp-les were considered translocation positive if ≥ 10 cells showed the presence of the fusion (Gómez Sáez, (2011)). The cut-off in the study carried out was deter- mined after counting 100 nuclei. This level is much less than that conside-red in the present study. This difference in the cut-off may be due to the fact that considered the highest number of positive nuclei expressing PAX8/PPARG fusion gene in normal thyroid tis-sue as the minimum cut-off value to identify posi-tive samples and ((Algeciras-Schimnich, et al., 2010)) did not use the beta inverse function in the Microsoft Office Excel program.
Another method for calculation of cut-off value in the present study was calculated using receiver operator characteristic (ROC) analysis in order to identify the level of expression of PAX8/PPARG fusion gene at which one can consider maligna-ncy. Accordingly, the present study showed that a cut off value of number of cells expressing posi-tive PAX8 per 50 cells was extremely sensiposi-tive and specific. The cutoff value was >19 cells / 50 cells with a sensitivity 96% of and specificity of 100%. Several studies estimated PAX8/PP ARG fusion gene re-arrangement in thyroid follicular adenoma and the rate of positive re-arrangement ranged from 3%-33.3% (Castro, et al. (2006)). In the present study the rate of positive PAX8/ PPARG fusion gene re-arrangement in thyroid follicular adenoma was 11.1%. On the other hand, the rate of positive PAX8/ PPARG fusion gene re-arrangement in thyroid follicular carcinoma was estimated to range from 25%-45%. (Dwight, et al., (2003)). In the present study, the rate of posi-tive PAX8/PPARG fusion gene re-arrangement in thyroid follicular carcinoma was 41.2 %. More-over, the rate of positive PAX8/PPARG fusion gene re-arrangement in follicular variant of papi-llary carcinoma (FVP-C) was estimated to range from 37.5% - 50%. In the present study the rate of positive PAX8/PPARG fusion gene re-arrange-ment in 44.4 %. So, the rate of positive PAX8/PPARG fusion gene re-arrangement
recorded in the present study for follicular aden-oma, follicular carcinoma and follicular variant of papillary thyroid carcinoma is within the range reported by other studies that used FISH as a method for estimation of this type of rearrange-ment. (Castro, et al., (2006)).
Follicular thyroid carcinoma patients with PPARγ fusion gene re-arrangement more frequently have vascular invasion, areas of solid/nested tumor his-tology, and previous non-thyroid cancers. Thus, PAX8/PPARG fusion gene re-arrangement typi-cally correlates with the presence of malignancy (Jadhav, et al., 2012).
Generally speaking, the use of merely positive PAX8/ PPARG fusion gene rearrangement was proved unsatisfactory in segregating malignant thyroid tumor (follicular carcinoma and follicular variant papillary carcinoma) from benign folli-cular adenoma, since in the two situations the PA-X8/PPARG fusion gene was identified in varying rates. Whereas choosing a much higher cut-off value based on receiver operator characteristic (ROC) curve analysis provided a highly sensitive and specific tool for segregating malignant from benign thyroid nodules. The level identified in the present study by this method was 13 cells per 50 counted cells (26%).
The mechanisms by which PAX8/PPARG may are not completely comprehended (Lui, et al., (2008)), however It has been demonstrated that the fusion protein increasescell development, cell suitability and induces anchorage independent growth while decreases apo-ptosis in vitro. There is no evidence however that this protein affect tumorigenesis in vivo (berhardt, et al., (2010)). In this way, it is still not clear whether additional events are needed to promote tumorigenesis. Follicular carcinomas with PAX8/PPARG fusion gene rearrangement were found to express Galec-tin (LGA-LS3) while FTCs with RAS mutation were found to express HBME1. Moreover, the authors observed difference in the clinical-patho-logical features in the two groups, tumors harbor-ing PAX8/PPARγ fusion gene rearrangement tend to present at a younger age be smaller in size have a solid/nested growth pattern and more frequently reveal vascular invasion.
Conclusion
calcu-Castro, P., Rebocho, A.P., Soares, R.J., Maga-lhães, J., Roque, L., Trovisco, V., Vieira de Castro, I., Cardoso-de-Oliveira, M., Fonseca, E., Soares, P. and M. Sobrinho-Simões, PAX8-PPARγ rearrange-ment is frequently detected in the follicular variant of papillary thyroid carcinoma. J. Clin. Endocrin. Met. 91(1): 213– 220 (2006).
Dwight, T., Thoppe, S.R., Foukakis, T., Lui, W. O., Wallin, G., Höög, A., Frisk, T., Larsson, C. and J. Zedenius, Involvement of the PAX8/ peroxisome proliferator-activated receptor ga-mma rearrangement in follicular thyroid tum-ors. J. Clin. Endo-crinol. Metab. 88(9): 4440-5 (2003).
Eberhardt, N. L., Grebe, S. K., McIver, B. and H.V. Reddi, The role of the PAX8/PPAR gam-ma fusion oncogene in the pathogenesis of fol-licular thyroid cancer. Mol. Cell. Endocrinol. 321(1):50–56 (2010).
S., Tretiakova, M., Kaplan, E.L., Leibiger, I., Leibiger, B., Enberg, U., Hoog, A., Larsson, C. and T.G. Kroll, CREB3L2-PPARgamma fus-ion mutatfus-ion identifies a thyroid signaling pat-hway regulated by intramembrane proteolysis. Cancer Res. 68(17): 7156–7164 (2008).
Popoveniuc, G. and J. Jonklaas, Thyroid Nodules. Med. Clin. North. Amer.96(2):329-349 (2012). Roberts, P.J. and C.J. Der, Targeting the
Raf-MEK-ERK mitogen-activated protein kinase cascade for the treatment of cancer. Oncogene 26: 3291–3310 (2007).