GSJ: Volume 7, Issue 7, July 2019, Online: ISSN 2320-9186
www.globalscientificjournal.com
Productivity Improvement of a Garment Industry by Using Assembly
Line Balancing and Sequential Improvement Techniques
Md. Parvez Shaikh, Nahian Ismail Chowdhury, Md. Anwar Hossen
KeyWords
Productivity, Assembly Line Balancing, Sequential Improvement Techniques, Time Study, Cycle Time, Standard Minute Value, Idle Time
ABSTRACT
Introduction
The rapid advancement of technology and information system is making the world very small. Now people can get information about the whole world within a second. This revolutionary change is highly visible in industrial sectors. Now the business world is very dynamic. The lifestyle of peoples is changing rapidly. Now peoples can discover their needs. Their demands are changing with their thinking and willingness. It is the time of customer pull production. Customer satisfaction is a very critical factor in the current business world. Customers are very conscious about quality, cost and time. Competitors are using aggressive business as well as manufacturing strategy to defend others. If there is any fault, then a world-dominating business sector can fall down suddenly. So, all the organizations should ensure effective optimization among time, cost and quality. In this purpose operation management tools are very effective. As an example, for a repetitive production system, Assembly Line Balancing is very effective operations manage-ment tool. By successful line balancing, we can ensure the improvemanage-ment of productivity which is the ultimate goal of an organization. The main dominating business sector in Bangladesh is the Ready Made Garment industries. Garment productions and layouts are product oriented. So, for the repetitive production in the RMG sector, Assembly Line Balancing is the most effective tool of productiv-ity improvement. For this importance, we have performed Assembly Line Balancing in the sewing section of “MONDOL FABRICS LTD.” one of the renowned ready-made garment industry in Bangladesh.
The research work is on Assembly Line Balancing in a sewing line, our objectives are:
• Study the Existing Assembly Line
• Reduce Idle Time and
• Improve Productivity
Literature Review
Time Study: Time study is the development of standard time by observing a task and analyzing it with the use of a stopwatch *1+. A time study is generally made with a stopwatch, either on the spot or by analyzing a videotape of the job *2+. Besides stopwatch, motion picture cameras and time recording machines have also been used. The resultant time is adjusted for fatigue and other al-lowances and then becomes a time standard.
The Eight Steps to Conducting a Time Study
Time study, the most common and reliable work measurement technique, is the combination of a series of activities *3+ as fol-lows:
1. Define the task to be studied (after a methods analysis).
2. Break down the task into precise elements.
3. Decide how many times each element of the task must be measured.
4. Record the times and ratings of performance for the task elements.
5. Compute the average observed cycle time (element times adjusted for unusual influences).
6. Compute the normal time for each task element *2+:
7. Sum the normal times for each element to develop total normal time for the task.
8. Compute the standard time *2+:
Assembly Line: Assembly line refers to the production of discrete parts moving from workstation to workstation at a controlled rate, following the sequence needed to build the product *2+. An assembly line is a manufacturing process in which interchangeable parts are added to a product in a sequential manner to create a finished product *4+. The term “Assembly Line” was first used by Henry Ford and his engineers. Assembly line balancing is as follows.
Assembly Line Balancing: Assembly line balancing is a technique of assigning all tasks to a series of workstations so that each workstation has no more than can be done by the cycle time, and so that the unassigned (i.e. idle) time across all workstations is minimized *2+. The goal of assembly line balancing is to group the tasks into the work center so that the desired production rate is attained with maximum efficiency.
The Six-Step Line Balancing Procedure: Six-Step Line Balancing *5+ is one type of heuristic method used for balancing the assem-bly line. It is a complete line balancing procedure which has six steps with a sequence as follows.
Step 1. Define the tasks to be performed and obtain accurate time estimates for each task. Identify the precedence relationship between the tasks.
Step 2. Specify the required daily output level. Calculate the cycle time that corresponds to the required daily output level. Step 3. Calculate the minimum number of work centers need for the desired output rate.
Step 4. Develop an initial layout by assigning tasks into the work centers. Step 5. Evaluate the current layout.
Step 6. If possible, improve the layout by modifying it or using another heuristic to generate a new layout.
improvement. Now we will describe this Sequential Improvement Technique in detail.
Before starting the improvement activities, a Process Control Chart should be developed. For making a Process Control Chart we need the Standard Minute Value (SMV) for each workstation. For the generation of Control-Chart we should use the following equa-tions:
( )
( )
( )
Steps of Sequential Improvement Technique:
1. Withdrawal of Idle Resources
2. Redistribution of Tasks
3. Bottleneck Reduction
Research Methodology
Case Study: A Case study provides a systematic way of looking at events, collecting data, analyzing information, and reporting the results *6+. A Case study is a suitable method for the research on “Productivity Improvement of a Garment Industry by Using Assem-bly Line Balancing and Sequential Improvement Techniques”. The following steps are followed to make the structure of the case study for this research work:
1. Determine and define the research questions
2. Select the cases and determine data gathering and analysis techniques
3. Prepare to collect the data
4. Collect data in the field
5. Evaluate and analyze the data
6. Prepare the report
Methods of Gathering Data: The method of gathering data is a critical concern of the research design. For this research data gath-ering is conducted by:
1. Questionnaires
2. Interviews
3. Observations
4. Non-Reactive measures
According to the format of this research methodology, we will conduct our data collection and analysis in the next chapter.
Data Collection and Analysis
Product/Job Selection: This research work is performed in “MONDOL FABRICS LTD., NAYAPARA, KASHIMPUR, GAZIPUR, TEL: 9297893-96, 9289386 EXT. 318 FAX: 880-2-9289113, WEB: www.mondol.net” one of the renowned readymade garment industry in Bangladesh. To fulfill the order of buyer “OBS”, the production dept. of “Mondol Fabrics Ltd.” has decided to perform the production of “Short Pant” (style “PL 010”). The Lot size is 58000 pieces. According to production strategy, they have designed four similar as-sembly lines. For the same configuration and output rate of four asas-sembly lines, we have selected one production line for our study. Based on this collected data, we have performed our analysis. In this research, we have assumed that “the existing method is stand-ard”. The process of work measurement is as follows:
Time Study: To estimate the production time of “Short Pant” we have used “Time Study” method. The “Eight Steps Time Study” procedure is followed. We have completed our time study by taking time on the spot for each task. For Time Study we have used a stopwatch and “Flyback Time” method. Now we will relate our data collection and analysis with Eight Steps Time Study procedure combined with the steps of Assembly Line Balancing.
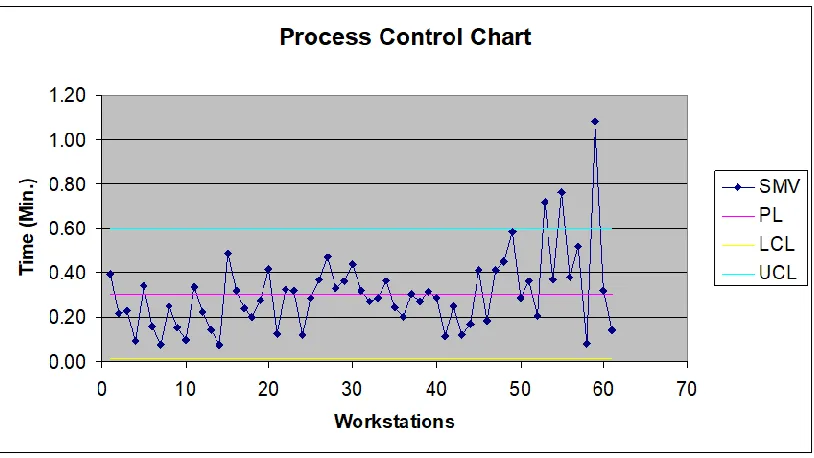
Cycle Time from Existing Layout: From the average observed time of the existing layout, we get the highest task time (SMV) is 1.08 Min. So, Cycle time = 1.08 Min.
Where, N = Number of work centers, T = Sum of all task times, C = Cycle time for desired output rate
Layout Design: The main aim of this step is building up an initial layout by assigning tasks into the work centers. The production department of “Mondol Fabrics Ltd.” has prepared an assembly layout for the production of “Short Pant”. They assigned 46 opera-tors and 34 helpers within 61 workstations in their designed layout for one line. There are four similar production lines for a large lot (58000 pieces) of Short Pant.
Calculations of the Current Layout: In this step, we will evaluate the current layout. Balance delay of Process, ( ) %
Where, D = Balance delay, N = Number of work centers, C = Cycle time for desired output rate, T = Sum of all task times Balance delay for existing layout,
( ) ) % % [Cycle Time = 1.08 Min.]
Line efficiency for current layout ( 00 )% 6%
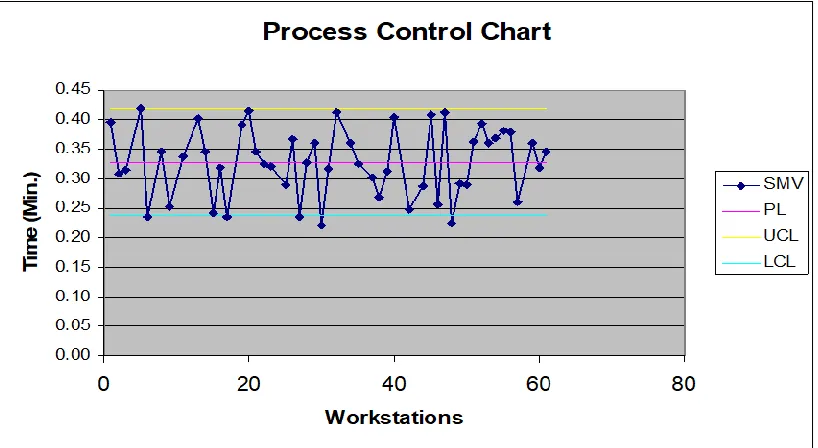
Fig. 1: Process Control Chart of the Existing Line
Improvement: The efficiency, production rate, and resource utilization are not satisfying. So, the possible improvement of the existing layout should be conducted. For improvement of existing assembly-line, we will use our proposed Sequential Improvement Technique as illustrated in Literature Review.
We have checked all the workstations of the assembly line and then find out the idle resources and Bottleneck points. Also, we have selected the workstations for redistribution of tasks. In the following parts, we have discussed the process of improvement by using “Sequential Improvement Technique”. We have presented one example of each of the improvement that we have performed and then the graph represents the total improvement after each step.
Items Results
Cycle Time 1.08 Min.
Idle Time 71.74 %
Efficiency 28.26 %
Production Rate 55 Piece/Hr.
No. of Work Stations 61
Total Process Time 18.619 Min.
Process Control Chart
0.00 0.20 0.40 0.60 0.80 1.00 1.20
0 10 20 30 40 50 60 70
Workstations
T
im
e
(
M
in
.) SMV
PL LCL
UCL
Withdrawal of Idle Resources
At Workstation 13: There are four Plane Machines (P/M) and operators at workstation 13 for operation BACK PANNEL JOINT. Their observed times are 20.12; 41.11; 27.43; 30.96 Sec. and Harmonic average for observed time is 7.004 Sec. Standard Minute Value (SMV) for BACK PANNEL JOINT is 0.140 Min. This time is very lower than the Principle Limit (PL) 0.305 Min. If we withdraw one ma-chine with the operator having observed time 41.11 Sec., then:
Harmonic Average,
( 0% ) 0
So, SMV = 0.169 Min. This SMV is also lower than the PL 0.306 Min. So, now if we withdraw another machine with the operator hav-ing observed time 30.96 Sec., then we get SMV = 0.232 Min.
This SMV is also lower than the PL 0.307 Min. So, if we withdraw the third machine with the operator having observed time 27.43 Sec., then, SMV = 0.403 Min.
This time is greater than the PL but lower than the UCL 0.608 Min. This SMV is also acceptable to continue the smooth production flow. So, from the current production line (from workstation 13) we can withdraw three Plane Machines (P/M) and operators.
Similarly, one helper from workstation 14 (final SMV 0.146 min), one machine with the operator from workstation 46 (final SMV 0.257 min) and one machine with the operator from workstation 52 (final SMV 0.394 min) was withdrawn. As the SMV were near Principle Limit 0.311 min and lower than UCL 0.619 min to continue the smooth production flow.
Total Withdrawal of M/C with Operator and Helper: For the reduction of idle or underutilization of resources and for improve-ment of line efficiency we have withdrawal four Plane Machines (P/M) with Operators (three from workstation 13 and one from workstation 46), one Flat Lock (F/L) machine with Operator (from workstation 52) and one Helper (from workstation 14).
Items Initial Results Final
Cycle Time 1.08 Min. 1.08 Min.
Idle Time 71.74 % 70.86 %
Efficiency 28.26 % 29.14 %
Production Rate 55 Piece/Hr. 55 Piece/Hr.
No. of WS 61 61
Total Process Time 18.619 Min. 19.217 Min.
Table 2: Output Summary after Withdrawal of Idle Resources
Redistribution of Tasks
At Workstation 2, 3, 4: At workstation 2, an operation is BACK YOCK JOINT and at workstation 3, an operation is BACK YOCK TOP STITCH. After the end of operations at workstation 2 and 3, workstation 4 conducts the operation THREAD CUT AND FABRIC FOLD-ING. The SMV of workstation 2 is 0.218 Min., workstation 3 is 0.225 Min. and workstation 4 is 0.090 Min. We can withdrawal the helper of workstation 4 (THREAD CUT AND FABRIC FOLDING) and then we can split this operation into workstation 2 and 3. Because, after completing the sewing at workstation 2 and 3 the operators can easily do THREAD CUT AND FABRIC FOLDING.
If we withdrawal the helper of workstation 4 (THREAD CUT AND FABRIC FOLDING) and distributed this operation to workstation 2 and 3 then,
(0 0 0 0) 0 0
(0 0 0 0) 0
SMV of both workstations is lower than the PL 0.322 Min. So, we can withdrawal the workstation 4.
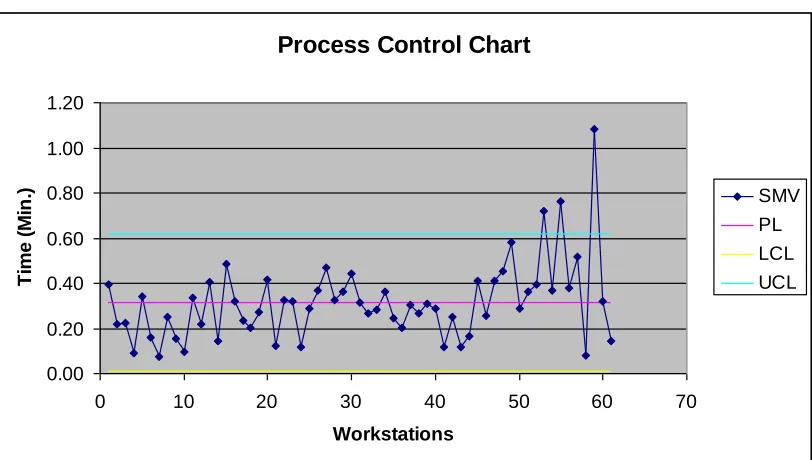
Similarly, resources and tasks was redistributed between the workstation group (5, 6, 7), group (8, 9, 10), group (32, 33), group (40, 41), group (12, 21), group (19, 24), group (43, 44), group (35, 58) and group (36, 61). As some of the workstations has very lower SMV than the Principle Limit so they were moved to the other workstations and merged with their tasks. The final SMV of the merged workstations was still near the Principle Limit or lower than the UCL to continue the smooth flow of production.
Total Withdrawal of Workstation: We have withdrawn eleven workstations (workstation 4; workstation 7; workstation 10; work-station 33; workwork-station 41; workwork-station 18; workwork-station 12; workwork-station 24; workwork-station 43; workwork-station 58 and workwork-station 36). Each workstation contains one Helper. So with the withdrawal of the eleventh workstation, we have withdrawal eleven Helpers.
Items Before Improvement After Improvement
Cycle Time 1.08 Min. 1.08 Min.
Idle Time 71.74 % 64.22 %
Efficiency 28.26 % 35.78 %
Production Rate 55 Piece/Hr. 55 Piece/Hr.
No. of WS 61 50
Total Process Time 18.619 Min. 19.340 Min.
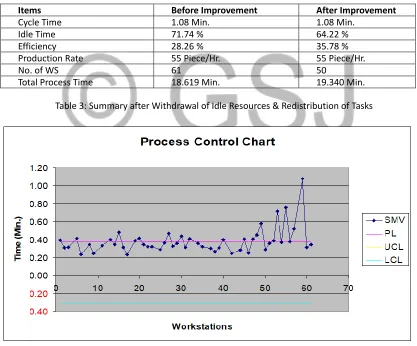
Table 3: Summary after Withdrawal of Idle Resources & Redistribution of Tasks
Fig. 3: Control Chart after Withdrawal of Idle Resources & Redistribution of Tasks
Bottleneck Reduction: According to the Sequential Improvement Technique discussed in the Literature Review chapter, we will reduce the existing Bottleneck from the Assembly Line by using Existing Resources and Additional Resources.
Existing Resource
SMV of the process. So we need to assign more helper in workstation 59 to reduce the SMV. If we assign two more helpers in workstation 59 then:
Harmonic Average, Rt = 18.013 Sec.
( 0 0% 0 ) 6
So, SMV = 0.360 Min. This SMV is lower than the PL 0.372 Min.
Similar procedure was followed to reduce the bottleneck at workstation 55 (final SMV 0.382 min), 53 (final SMV 0.360 min), 49 (final SMV 0.292 min), 57 (final SMV 0.260 min) and 27 (final SMV0.184 min) by adding extra helper that were available from the withdrawal of workstations. These SMV values are near the Principle Limit 0.372 min and lower than the UCL to facilitate the smooth flow of production.
Items Before Improvement After Improvement
Cycle Time 1.08 Min. 0.49 Min.
Idle Time 71.74 % 29.56 %
Efficiency 28.26 % 70.44 %
Production Rate 55 Piece/Hr. 123 Piece/Hr.
No. of WS 61 50
Total Process Time 18.619 Min. 17.090 Min.
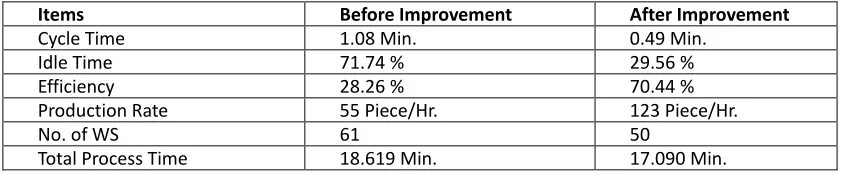
Table 4: Summary after Improvement with Existing Resources Additional Resources
At Workstation 15: At workstation 15 there is only one operator for operation BACK PANNEL SIDE STITCH WITH CARE LEVEL. The SMV of workstation 15 is 0.485 Min. (Observed time is 24.26 Sec.). This is a bottleneck point and the SMV of this workstation is high-er than avhigh-erage SMV of the process. So we need to assign more ophigh-erator and machine in workstation 15 to reduce the SMV.
If we assign one more operator with O/L machine in workstation 15 then:
Harmonic Average, Rt = 12.130 Sec.
( 0 0% 0) 6 So, SMV = 0.243 Min. This SMV is lower than the PL 0.337 Min.
Consequently, an additional operator with O/L machine was added in workstations 48 (final SMV 0.226 min) and 30 (final SMV 0.256 min) to reduce the bottleneck at those stations.
Total Addition of Helpers and M/C to Reduce Bottleneck: We have reassigned total seven Helpers (two at workstation 59; one at workstation 55; one at workstation 53; workstation 49; workstation 57; workstation 27) from the existing resources to reduce Bottle-neck.
Similarly, we have reassigned three O/L Machines with Operators as the additional resources for the aim of Bottleneck reduction and improvement of production rate.
Items Before Improvement After Improvement
Cycle Time 1.08 Min. 0.418 Min.
Idle Time 71.74 % 21.53 %
Efficiency 28.26 % 78.47 %
Production Rate 55 Piece/Hr. 143 Piece/Hr.
No. of WS 61 50
Total Process Time 18.619 Min. 16.401 Min.
Fig. 4: Process Control Chart after Complete Improvement
Final Balance of M/C with Operators and Helpers: In the initial production layout there were 46 machines (Twenty-eight P/M; nine O/L machine; seven F/L machine; one Hole M/C and one Tack M/C) with Operators and 34 helpers in 61 workstations.
But after improvement, we have withdrawal five machines (four P/M with Operators; one F/L machine) and twelve Helpers. We have also withdrawal eleven workstations.
In the same time, we have reassigned seven Helpers from existing resources and three O/L Machines with Operators as additional resources to reduce bottleneck.
So, finally, in the improved production line, there are 44 machines (twenty-four P/M; twelve O/L machines; six F/L machines; one Hole M/C and one Tack M/C) with Operators and 29 Helpers in 50 workstations.
Final Calculation of Improved Assembly Line: From the final improved control chart we get the highest SMV (0.418 Min.) at work-station 5. This SMV will be considered as the Cycle Time for the final calculation.
From the final control chart, we also get Total Process Time = 16.401 Min.
PL = 0.328 Min., UCL = 0.418 Min., LCL = 0.238 Min., Total No. of workstation = 50 Balance delay of Process,
( ) % % [Cycle time = 0.418 Min.]
So, Final efficiency of modified production line ( 00 )% %
Improved production rate,
Where, C = Cycle time, AT = Available operating time per day, OR = Daily output rate. OR = 60 / .418 Piece/Hr = 143.54 ≈ 143 Piece/Hr.
Conclusions
The main objectives of our research are an improvement of Productivity and reduction of Idle Time of a sewing line in a Garment Industry. For the achievement of these goals, we have used Assembly Line Balancing techniques. For the improvement of the initially designed Assembly line, we have used the Sequential Improvement Technique. As the prerequisite activity of Assembly Line Balanc-ing, we have performed Work Measurement. Method Study was not possible, because we had not enough time and opportunity. At the same time, we had no permission to conduct any modification on the existing method. For this reason, it was our assumption that “the existing Method is Standard”.
Based on the work measurement data, we have performed our analysis with the help of Six-Step Assembly Line Balancing and Se-quential Improvement Technique. In Analysis Chapter we see that all of our research objectives are achieved. Through our research work, we have gained special improvement in Productivity, Efficiency and Production Time. If we could implement our improved As-sembly Line in the existing production line in “Mondol Fabrics Ltd” then the industry would be highly benefited.
From our research work, we see that any manufacturing organizations where repetitive production flow occurs if they conduct Work Study and use Six-Step Assembly Line Balancing with Sequential Improvement Technique then they will gain huge additional profit without any additional cost by increasing productivity.
Limitations: Though we have achieved all of our research goals, there were also some limitations. If we could overcome these lim-itations, then we would gain much batter improvements. The main limitations of our research work were:
Method Study: Before any Work Measurement it is the pre-condition to ensure that the existing method is Standard. But it was not possible for us to evaluate the existing method in the sewing section of “Mondol Fabric Ltd.”. It was only our assumption that the existing method is Standard.
Performance Rating: Performance rating of the employee of our study line was within 50 % - 70 %. This rating is very poor. So we have omitted Performance Rating from our analysis. For this reason, it was not possible for us to generate Standard Time for further use.
Allowance: There is no allowance policy in “Mondol Fabrics Ltd.”. Also, it was not possible for us to measure the allowance in time of our data collection for time limitation.
Recommendations
Work Study Department: Work Study Dept. should be established as soon as possible. Industrial Engineer must be recruited to run this department successfully.
Method Study: The existing working method should be evaluated by expert people (Industrial Engineer). A Standard Method of work should be developed and to be implemented immediately.
Employee Performance: Performance Appraisal system should be developed for proper judgment of employee. Three months, ba-sis Standard Performance should be developed and renewed periodically by expert and honest people.
Employee Skill: Employee Skill level should be improved by a proper training program. Multi-skilled employee should be generat-ed.
Allowance: By continuous study organizational Allowance should be established.
Acknowledgment
The authors would like to thank the managers and all the personnel of “Mondol Fabrics Ltd.” for their cooperation and generous participation in the interviews and survey completion, during the research study. The authors also acknowledge Md. Anwar Hossen for his contribution to the data collection and time study.
References
[1] Adler, S. Paul, “Time-and-Motion Regained”, Harvard Business Review Jan.–Feb. 1993.
[2] R. B. Chase, N. J. Aquilano, F. R. Jacobs, Production and Operations Management, Eighth Edition, 1999.
[3] Heozer, Render, Operations Management, Work measurement Supplement 10, Prentice Hall, Inc., Upper Saddle River, N.J 07458, 2001. [4] G. R. Esmaeilian, M. M. H. M. Ahmad, S. Sulaiman, N. Ismail, “Assembly Line and Balancing Assembly Line”.
[5] H. Noori, R. Radford, “Production and Operation Management”, International Edition, 1995.