Dimensionality Reduction for Handwritten Digit
Recognition
Ankita Das
1, Tuhin Kundu
1,∗, Chandran Saravanan
21Computer Science and Engineering, Jalpaiguri Government Engineering College, Jalpaiguri, India 2Computer Science and Engineering, National Institute of Technology, Durgapur, India
Abstract
Human perception of dimensions is usually limited to two or three degrees. Any further increase in the number of dimensions usually leads to the difficulty in visual imagination for any person. Hence, machine learning researchers often commonly have to overcome the curse of dimensionality in high dimensional feature sets with dimensionality reduction techniques. In this proposed model, two handwritten digit datasets are used: CVL Single Digit and MNIST, and two popular feature descriptors, Histogram of Oriented Gradients (HOG) and Gabor filters, are used to generate the feature sets. Investigations are carried out on linear and nonlinear transformations of the feature sets using multiple dimensionality reduction techniques such as Principal Component Analysis (PCA), Linear Discriminant Analysis (LDA) and Isomap. The lower dimension vectors obtained, are then used to classify the numeric digits using Support Vector Machine (SVM). A conclusion arrived is that using HOG as the feature descriptor and PCA as the dimensionality reduction technique resulted in the experimental model achieving the highest accuracy of 99.29% on the MNIST dataset with the time efficiency comparable to that of a convolutional neural network (CNN). Further, it is concluded that even though the LDA model with HOG as the feature descriptor achieved a lesser accuracy of 98.34%, but it was able to capture maximum information in just 9 components in its lower dimensional subspace with 75% reduction in time efficiency of that of the PCA-HOG model and the CNN model.
Received on 03 November 2018; accepted on 15 November 2018; published on 07 December 2018
Keywords: Dimensionality Reduction, Feature Descriptors, HOG, Gabor, PCA, LDA, Isomap, SVM, Classification Copyright © 2018 Ankita Das et al., licensed to EAI. This is an open access article distributed under the terms of the Creative Commons Attribution license (http://creativecommons.org/licenses/by/3.0/), which permits unlimited use, distribution and reproduction in any medium so long as the original work is properly cited.
doi:10.4108/eai.12-2-2019.156590
1. Introduction
Befitting the recent development in optical character recognition and pattern recognition technologies, the use of automated systems for the recognition of characters present in physical documents and their scanned versions is increasing in our daily life. But the same technology is inefficient for recognizing handwritten characters and classifying them correctly to store them in digital format, due to the diverse appearances of the handwritten digits due to the vast number of calligraphic styles. Hence, for an effective system to digitally recognize handwritten numbers, a set of effective features is generated reflecting the intrinsic characteristics of the different digits and formulate methods of clinically discriminating the
∗
Corresponding author. Email:[email protected]
digits from one another boosting the distinguishability between them [9].
As the dimensionality of the data increases, the infor-mation required for effective analysis grows in an expo-nential manner. For dynamic optimisation problems, Bellman [3] referred to this problem as the “curse of dimensionality". Greater number of dimensions brings with it a lot of disadvantages such as overfitting, lesser interpretability and increase in training time. Popular approaches have been formulated to preserve the higher dimensional information onto a projection with lower dimensionality retaining as much data as possible [10]. The representation of the projection with lower dimen-sionality ideally includes the intrinsic characteristics of the data, hence, showcases the intrinsic dimensionality of the data or feature set. Dimensionality reduction techniques usually follow this common principle to
1
EAI Endorsed Transactions
on Cloud Systems
Research Article
mitigate the “curse of dimensionality" and other unde-sired factors present in data with higher dimensionality. Hence, it facilitates various analytical functions such as compression, visualization and classification to be performed of the reduced dimensionality on a more clinical and efficient basis. Traditionally, linear tech-niques were used to reduce the dimensionality of data, but were later found inconsistent with non-linear and more complex data [8].
The rest of the paper is organised as follows. Section II briefs about the various concepts developed in this proposed model. Section III deals with the various steps in the proposed methodology of our model. Section IV depicts the results while Section V contains the conclusion.
2. Literature Review
Some previous works in the domain of handwritten digit recognition are as follows: LeCun et al. [24] proposed a standard handwritten digit dataset and used a linear classifier. Hamamoto et al. [4] proposed a model to extract features using Gabor wavelets from digit imagery and used Euclidean distance classification. A network with convolutional operations was proposed by Poultney et al. [2] with the extraction of sparse features using an unsupervised learning method. Pyramid Histogram of Oriented Gradients (PHOG) was adopted by Maji et al. [6] with the Support Vector Machine (SVM) being used for classification. A multi-layer perceptron (MLP) neural network was adopted by Cruz et al. [7] and Ciresan et al. proposed a 35 layer convolutional network [5].
2.1. Feature descriptors
Histogram of Oriented Gradients. Histogram of Oriented Gradients (HOG) is a feature descriptor proposed by Dalal et al. [23], initially for the problem of pedestrian detection and has been used by researchers for various problems in the domain of computer vision. The HOG descriptor calculates the image gradients and stores the direction and magnitude of the gradients (calculated by Equations 1 and 2 respectively) in a number of bins represented by equally divided orientation angles within the range [0, π).
θ(x, y) =tan−1Gy(x, y) Gx(x, y)
(1)
m(x, y) = q
(Gx(x, y))2+ (Gy(x, y))2 (2)
where Gx(x, y) and Gy(x, y) are gradient components of each pixel (x, y) in horizontal and vertical direction respectively.
Gabor filters. Gabor filters [22] have been widely used by researchers for problems relating to face recognition and texture analysis, due to the fact that Gabor filters successfully extract orientation dependent frequency features from every possible pixel of an image. Therefore, it is possible to extract edge-like features for the use of character classification. Equation 3 denotes the two dimensional Gabor filter [4].
f(x, y, θk, λ, σx, σy) =exp
−1 2
R21 σx2
+R
2 2
σy2
·exp
i2πR1 λ
(3)
whereR1=xcosθk+ysinθk,R2=−xsinθk+ycosθk,
withλ, θk, σx andσybeing the wavelength, orientation of wave, standard deviations of the Gaussian envelope along thexandyaxis respectively.
2.2. Dimensionality reduction
Principal Component Analysis. Principal Component Analysis (PCA) [21] [20] is a linear dimensionality reduction technique that works by embedding higher dimensionality data into a lower dimensionality subspace. PCA manages to do so by transforming data dimensions to retain principal components accounting for most of the variation in the original higher dimensional data. Letx1, x2..., xnbe the original dataset in D dimensional space, while the objective is to represent the dataset in a smaller subspaceWwithW < D [19]. Let yi be defined in Equation 4 withi= 1, ..., n be a linear combination of variables.
yi =AT(x−mx) (4)
whereA= [α1|...|αn] is a matrix with columns having eigenvectors ofP
, the covariance of the original higher dimensional data andmxdenoting the mean of original data.
Linear Discriminant Analysis. Linear Discriminant Anal-ysis (LDA) [17] [15] is a dimensionality reduction tech-nique which looks to the best possible way to dis-criminate between classes in the underlying subspace rather than discriminating based on data [16]. Formally, it produces the largest mean differences between the desired outcome classes using independent features rel-ative to the data described. Its objective is to formulate a projection A such that it maximizes the ratio of Sb andSw (Fisher’s criterion) which are between-class and within-class scatter respectively [18] as in Equation 5:
argmax A
|ASbAT |
Isomap. Isomap [12] is a dimensionality reduction technique that preserves the curvilinear (geodesic) distances between data points in a manifold. Geodesic distances are calculated over data points x1, x2, ..., xn
using a neighbourhood graphGwhere every data point is connected with its k neighbouring points xij with j= 1,2, ..., k in the dataset. Dijkstra or Floyd’s shortest path algorithm is used to calculate geodesic distances between any two points, which is used to calculate a geodesic distance matrix M. Classical scaling is then applied to the matrix M, which then represents lower dimensional points yi for datapoints xi in the lower dimensional subspaceY [8].
2.3. Support Vector Machine
Support Vector Machine (SVM) [14] is a algorithm use-ful for discovering minute patterns in complex unseen data and discriminates between various classes to pro-vide supervised learning classification. For training examples x1, x2, ..., xl and class labels y1, y2, ..., yl, the objective is to minimize overαkas in Equation 6 [13]:
J = 1 2
X
h X
k
yhykαhαk(xh·xk+λδhk)− X
k αk
where0≤αk ≤C and X k
akyk = 0 (6)
There are ndimensional feature vectors with summa-tions over all training patterns xk. yk encodes class labels in the form of binary values,xh.xk denotes scalar product, Kronecker symbol is δhk, and λ and C are postitve constants(soft margin parameters).
Hence, the resulting decision D function generated from an input feature vectorxis given in Equation 7.
D(x) =w·x+b
where w=X k
αkykxk and b=< yk−w·xk > (7)
Weight vector w being the linear combination of patterns gained from training and the training patterns with non-zero weights culminate as support vectors.
3. Proposed Methodology
Following figure 1 depicts a flowchart of the proposed model.
3.1. Databases
MNIST. MNIST [1] [24] consists of 60000 training
and 10000 testing samples of handwritten digits which have been size normalized and centred in a 28×28 pixel image, and is a widely recognized standardised handwritten digit database. All images are used in the experiments.
Figure 1. Flowchart depicting our proposed model
CVL Single Digit. CVL Single Digit (CVL SD) database is a part of ICDAR2013 [11] handwritten digit and digit string recognition competition. 7000 single digit images are used as training samples and 21780 digit images are used as testing samples of size 28×28 pixels in the experiments.
3.2. Feature extraction
Two feature descriptors namely, HOG and Gabor filters are used to generate the feature sets from the images in the MNIST and CVL SD datasets, on which various dimensionality reduction techniques are applied. All input images were grayscale in nature.
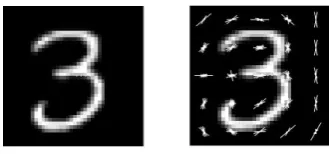
For HOG descriptors, images are resized to 24× 24, 32×32 and 40×40 pixel images and cell size considered as 8×8. Block size is 2×2 along with a 50% overlap. The gradient direction and gradient magnitude are quantized over 9 bins of equal angles which are unsigned in nature over [0,180) degrees. HOG visualization over sample MNIST image showcased in following figure 2.
Figure 2. (a) MNIST sample image (b) MNIST sample image
with superimposition of HOG direction gradient after resizing to
40×40 pixels
For Gabor filters, 8 different orientations and 5 different scales are selected to generate 40 Gabor filters constituting the Gabor filter bank. Each pixel for every image, hence generates 40 values after passing through the Gabor filter bank.
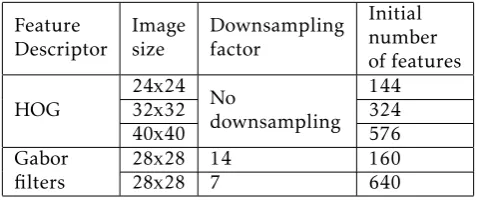
The feature dimensions of each image generated by the HOG and Gabor filter descriptors shown in the following table I.
The Gabor filter bank produces 40 values for each pixel, hence the dimensionality of the feature vector is very large. Hence, downsampling is used to sample
Table 1. Initial number of features generated by the feature descriptors in our experiments
Feature Descriptor
Image size
Downsampling factor
Initial number of features
HOG
24x24 No
downsampling 144
32x32 324
40x40 576
Gabor filters
28x28 14 160
28x28 7 640
select values from the feature vector produced. No downsampling is required for feature vectors generated by the HOG descriptor.
3.3. Dimensionality reduction
Dimensionality reduction techniques such as PCA, LDA, and Isomap are applied to the feature sets that are generated using the feature descriptos, HOG, and Gabor filters. Whitening transormation is applied to the feature set matrix while finding out the principal components of the datapoints in PCA. PCA’s crux here is to discriminate according to the variation in the feature sets (datapoints) while LDA discriminates on the basis of the variation in the classes present within the feature sets. PCA is unsupervised, while LDA is supervised in nature as PCA considers the global structure of the data while LDA tends to maximize separation using class information. For dimensionality reduction using Isomap, the geodesic distance matrix is calculated. In this experiment, only 10000 MNIST samples and 7000 CVL SD samples are considered. The reason for using lesser number of samples for Isomap is that the generation of geodesic distance matrix is a memory inefficient and computationally expensive operation for which we are unable to use the entire dataset in our constrained hardware configuration environment. For PCA and LDA, entire training and testing sets are used for our experiments and are same for both the linear dimensionality reduction techniques used in this experiment.
The reduced feature set is generated by the dimentionality reduction techniques and the reduced features primarily comprise the principal components formulated from the input feature sets. The reduced feature sets are then fed into the SVM classifier for classification of the 10 digit classes present within the feature sets.
3.4. Classification using SVM
The dimensionally reduced feature sets are used as an input to the SVM classifier with RBF kernel in these experiments. The reduced feature sets of PCA and LDA
contain separate training and testing feature sets to be used as they are for the SVM classifier while Isomap contains a single feature set, which is used for k-fold cross validation method using the SVM classifier. k is set as 5 for our k-fold cross validation experiments for the Isomap reduced feature sets where every fold is used as a testing set once, while the other 4 folds are considered to be training sets. All 5 accuracy are averaged to calculate the cross validation accuracy of the SVM classifier on the Isomap reduced feature set.
4. Results & Discussion
All dimensionality reduction and classification experi-ments are conducted on Intel® Xeon® CPU @2.30GHz with 13 GB memory with acceleration provided by NVIDIA® Tesla® K80 GPU with 12 GB memory as provided by the Google Colaboratory research project. All feature set generation experiments are conducted on a personal computer with Intel® CoreTM i5 CPU
@1.60GHz with 7.7 GB memory. The availability of such hardware configurations were fundamental for the experiments with the large number of images present in the datasets.
The results are obtained after the classfication process by the SVM classifier for all the models. Results for feature sets generated by HOG and dimensionality reduction performed using PCA or LDA are shown in Tables 2,3, whereas results for feature sets generated by Gabor filters are showcased in Tables 4,5. Tables 6,7 and Tables 8,9 showcase Isomap reduced feature set classification results for HOG and Gabor filter descriptors respectively.
Table 2. Accuracy results for feature sets generated using HOG with PCA dimensionality reduction with classification using SVM with RBF kernel
Dataset Image size (in pixels)
Reduced
Features Accuracy%
MNIST
24x24 46 98.74
32x32 89 99.29
40x40 151 99.12
CVL SVD
24x24 50 83.79
32x32 97 85.14
40x40 160 85.32
Table 3. Accuracy results for feature sets generated using HOG with LDA dimensionality reduction with classification using SVM with RBF kernel
Dataset Image size (in pixels)
Reduced
Features Accuracy%
MNIST
24x24 9 97.79
32x32 9 98.29
40x40 9 98.34
CVL SVD
24x24 9 82.63
32x32 9 84.2
40x40 9 84.17
Table 4. Accuracy results for feature sets generated using Gabor filter with PCA dimensionality reduction with classification using SVM with RBF kernel
Dataset Downsampling factor
Reduced
features Accuracy%
MNIST 14 75 96.76
7 176 98.96
CVL SD 14 64 81.56
7 164 84.72
Table 5. Accuracy results for feature sets generated using Gabor filter with LDA dimensionality reduction with classification using SVM with RBF kernel
Dataset Downsampling factor
Reduced
features Accuracy%
MNIST 14 9 90.9
7 9 97.71
CVL SD 14 9 78.21
7 9 83.81
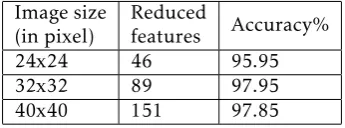
Table 6. Accuracy results for model using HOG descriptor with Isomap for dimensionality reduction on MNIST dataset with images of size28×28
Image size (in pixel)
Reduced
features Accuracy%
24x24 46 95.95
32x32 89 97.95
40x40 151 97.85
Table 7. Accuracy results for model using HOG descriptor with Isomap for dimensionality reduction on CVL SVD dataset with images of size28×28
Image size (in pixel)
Reduced
features Accuracy%
24x24 50 93.36
32x32 97 96.14
40x40 160 96.57
Table 8. Accuracy results for model using Gabor filter descriptor with Isomap for dimensionality reduction on MNIST dataset with images of size28×28
Downsampling
factor Reduced features Accuracy %
14 75 88.45
7 176 86.85
Table 9. Accuracy results for model using Gabor filter descriptor with Isomap for dimensionality reduction on CVL SVD dataset with images of size28×28
Downsampling
factor Reduced features Accuracy %
14 64 85.36
7 160 83.56
is fairly closeby the highest one. 40×40 resized image dimension CVL SD dataset achieves the highest predictive classification accuracy of 85.32% for the testing set containing 21780 images against a training set having only 7000 images as provided by the ICDAR2013 source using PCA. Even though PCA achieves the highest accuracy, the factor of achieving nearly the same classification accuracy with much lesser components has to be credited to LDA. LDA achieves its best predictive classification accuracy of 98.34% and 84.2% for MNIST and CVL SD datasets respectively, capturing most essential information in the feature sets within only 9 components. In this experiment, the 9 components generated by LDA are used, which almost achieves equal accuracy as PCA. LDA uses discrimination based on classes present in the feature space, the number of components that are required to capture most of the information in the higher dimensionality space is n−1 where n is the number of classes in the feature space. Hence, LDA generates a maximum ofn−1 components in its lower dimensionality subspace.
The first component of the PCA reduced set contains the maximum information, followed by the second and it reduces to an asymptotic stage after the initial components. Following figure 3 makes it is clear that the initial components hold the maximum information and have a compulsion to be included to the reduced feature set to avoid information loss.
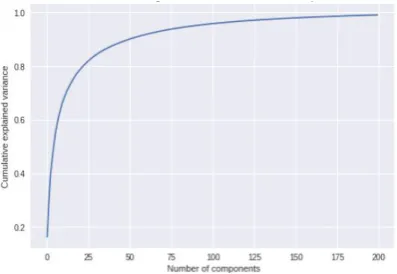
The graph of cumulative explained variance and the number of components for PCA shown in the following figure 4 shows a proper way to select the minimum number of components from which a major part of the information is extracted.
The point on the curve whose slope at a point to the right of it is not as steep as the slope on the point to the left of it gives the approximate sufficient
Figure 3. Graph showcasing component wise variance for nth component for PCA conducted on32×32images of the MNIST dataset with the feature set generated using HOG
Figure 4. Graph showcasing cumulative explained variance
across the number of components for PCA conducted on32×32 images of the MNIST dataset with the feature set generated using HOG
number of principal components in figure 4. Inclusion of information with low information may distract the classifier from the optimal classification hyperplane or may play a major role in case of overfitted models.
Similary, following figure 5 depicts that the initial components are the most important amongst the 9 components that have been generated in the reduced dimensionality subspace which manages to capture most of the information(datapoints) present the higher dimensional feature space. Hence, the initial components are exceptionally crucial for satisfactory classification to be implemented for the handwritten digit recognition system.
Following figure 6 depicts using bar graphs the comparison between initial number of features and the reduced number of components derived from the initial features for the three dimensionality reduction techniques used in the model, PCA, LDA, and Isomap.
Given LDA discriminates using information between the classes present in the feature space (in handwritten
Figure 5. Graph showcasing component wise variance for nth
component for LDA conducted on32×32images of the MNIST dataset with the feature set generated using HOG
Figure 6. Bar graph showcasing amount of reduction in number of features in experiments run where HOG was used to generate the initital feature sets for MNIST dataset
digit datasets, 10 classes are present for the 10 numeric digits), the number of components it generates is found to be the least amongst the three dimensionality reduction techniques. The above table II infers that PCA components provide us with the best classification results even though the number of components generated is significantly higher.
5. Conclusion & Future Work
Further, in these experiments, processing time of the models are calculated. It is noticed that the HOG-PCA model for MNIST dataset with the highest accuracy took a training and testing time of 140.631 seconds. In comparison, a convolutional neural network with 2 convolutional layers, a max pooling layer and 2 dropout layers is run and it achieved an accuracy of 99.16% taking a time of 142.60 seconds on the same computational hardware configurations. Whereas the HOG-LDA model with 98.34% takes a time of 28.248 seconds also compressing most of the feature information onto 9 components. Hence, the HOG-LDA is rendered as the most time and memory efficient model despite having a slightly lower accuracy performance than the best models.
The research article has provided an insight into the compression of feature space and the time efficiency of such recognition models. Such models may prove to lead to efficient document recognition models running on lower time and memory configurations in the following future.
References
[1] LeCun Y. The MNIST database of handwritten digits. http://yann. lecun. com/exdb/mnist/. 1998.
[2] Poultney C, Chopra S, Cun YL. Efficient learning of sparse representations with an energy-based model. In Advances in neural information processing systems 2007 (pp. 1137-1144).
[3] Bellman R. Dynamic programming. Courier Corporation; 2013 Apr 9.
[4] Hamamoto Y, Uchimura S, Watanabe M, Yasuda T, Tomita S. Recognition of handwritten numerals using Gabor features. InPattern Recognition, 1996., Proceedings of the 13th International Conference on 1996 Aug 25 (Vol. 3, pp. 250-253). IEEE.
[5] Cireŧan D, Meier U, Schmidhuber J. Multi-column deep neural networks for image classification. arXiv preprint arXiv:1202.2745. 2012 Feb 13.
[6] Maji S, Malik J. Fast and accurate digit classification. EECS Department, University of California, Berkeley, Tech. Rep. UCB/EECS-2009-159. 2009 Nov 25.
[7] Cruz RM, Cavalcanti GD, Ren TI. Handwritten digit recognition using multiple feature extraction techniques and classifier ensemble. In17th International Conference on Systems, Signals and Image Processing 2010 Jun (pp. 215-218).
[8] Van Der Maaten L, Postma E, Van den Herik J. Dimensionality reduction: a comparative. J Mach Learn Res. 2009 Oct 26;10:66-71.
[9] Song Q, Gao Z. Real time handwritten digit recognition on mobile devices. InIntelligent Control and Information
Processing (ICICIP), 2013 Fourth International Confer-ence on 2013 Jun 9 (pp. 487-490). IEEE.
[10] Hira ZM, Gillies DF. A review of feature selection and feature extraction methods applied on microarray data. Advances in bioinformatics. 2015;2015.
[11] Diem M, Fiel S, Garz A, Keglevic M, Kleber F, Sablatnig R. ICDAR 2013 Competition on Handwritten Digit Recognition (HDRC 2013). In ICDAR 2013 Aug 25 (pp. 1422-1427).
[12] SchÃűlkopf B, Smola A, MÃijller KR. Nonlinear component analysis as a kernel eigenvalue problem. Neural computation. 1998 Jul 1;10(5):1299-319.
[13] Guyon I, Weston J, Barnhill S, Vapnik V. Gene selection for cancer classification using support vector machines. Machine learning. 2002 Jan 1;46(1-3):389-422.
[14] Vapnik VN. Adaptive and Learning Systems for Signal Processing Communications, and control. Statistical learning theory. 1998.
[15] Fukunaga K. Introduction to statistical pattern recogni-tion. Elsevier; 2013 Oct 22.
[16] MartÃŋnez AM, Kak AC. Pca versus lda. IEEE Transactions on Pattern Analysis & Machine Intelligence. 2001 Feb 1(2):228-33.
[17] Fisher RA. The statistical utilization of multiple measurements. Annals of eugenics. 1938 Aug;8(4):376-86. [18] Yu H, Yang J. A direct LDA algorithm for high-dimensional data−with application to face recognition. Pattern recognition. 2001 Oct 1;34(10):2067-70.
[19] Savakis A, Sharma R, Kumar M. Efficient eye detection using HOG-PCA descriptor. InImaging and Multimedia Analytics in a Web and Mobile World 2014 2014 Mar 3 (Vol. 9027, p. 90270J). International Society for Optics and Photonics.
[20] Hotelling H. Analysis of a complex of statistical vari-ables into principal components. Journal of educational psychology. 1933 Sep;24(6):417.
[21] Pearson K. LIII. On lines and planes of closest fit to systems of points in space. The London, Edinburgh, and Dublin Philosophical Magazine and Journal of Science. 1901 Nov 1;2(11):559-72.
[22] Gabor D. Theory of communication. Part 1: The analysis of information. Journal of the Institution of Electrical Engineers-Part III: Radio and Communication Engineering. 1946 Nov;93(26):429-41.
[23] Dalal N, Triggs B. Histograms of oriented gradients for human detection. InComputer Vision and Pattern Recognition, 2005. CVPR 2005. IEEE Computer Society Conference on 2005 Jun 25 (Vol. 1, pp. 886-893). IEEE. [24] LeCun Y, Bottou L, Bengio Y, Haffner P. Gradient-based
learning applied to document recognition. Proceedings of the IEEE. 1998 Nov;86(11):2278-324.