c
Comparative Analysis of Different Remote Sensing Techniques for Mapping of Supraglacial
Lakes on Hispar Glacier
Maha Qaisar
1, Muhammad Shafiq
2*, Badar Munir Khan Ghauri
1Isma Younes
3, Muhammad Khubaib Abuzar
41Department of Remote Sensing and Geo-Information Science, Institute of Space Technology, Pakistan 2Glacier Hydrology & Hazards Group, SUPARCO, Karachi, Pakistan
3
Department of Geography, University of the Punjab, Lahore, Pakistan
4Department of Earth & Environmental Sciences, Bahria University, Islamabad, Pakistan
*
Email: [email protected]Received: 28 May, 2018 Accepted: 1 September, 2018
Abstract: The glacier changes are very significant in quantifying the direct effects of climate change. The glaciers in the northern Pakistan especially in the Karakoram pose a large change in relief and are difficult to access due to complex topography. The global WOS (Web of Science) database indicate only a few studies conducted so far in this region in the domain of climate and cryosphere. The studies relating to glacial hazards in this region are even less. This study involves the mapping of supraglacial lakes on Hispar glacier using multiple remote sensing methods. The accuracy of results from those methods is discussed. Remote Sensing and GIS techniques have been applied to time series of Landsat images of years 2017, 2016, 2010, 2000 and 1990 (in the descending order) to quantify the supraglacial lakes on the Hispar glacier. The remote sensing techniques include Band Rationing, Normalized Water Index (NDWI), Classification i.e. Unsupervised and Panchromatic Sharpening Image Enhancement Technique for the years of 2017 and 2016 imageries. After defining the Hunza basin (involving of high resolution DEMs), all the satellite derived imageries have been preprocessed and processed. GIS tools have been used to calculate the areal extents of yearly obtained supraglacial lakes and compare temporally with passing years, which in turn gave an accurate comparative analysis among different remote sensing techniques. The satellite derived time series map layouts of each technique have been formulated. The vulnerable supraglacial lakes on Hispar glacier of areal sizes ≤ 0.05 sq.km have also been identified and delineated.
Keywords: Hisper glacier, climate change, supraglacial lakes, remote sensing, GIS.
Introduction
Climate change affects normal human life by posing several natural hazards. Among those, natural hazards relating to cryosphere are more likely to happen as glaciers (cold regions) are readily affected even with a little change in temperature. And 1/6th percent of global population is dependent on them for their water consumption from glacier, ice and snow (Immerzeel, 2008). Cryosphere related hazards include avalanches, debris flow, landslides, glacial crevasses, supraglacial lakes, englacial lakes, moulins, glacier lake outburst floods (GLOF) etc.
Among these hazards, emergence of supraglacial lakes are the very devastating hazards in the mountainous regions, which have increased in recent years due to alarming increasing temperature trend in the northern Pakistan, causing immensely enhanced snow/ice melting rate. Resulting in formation of supraglacial lakes. These are potentially dangerous since they can disturb the internal drainage system of the glaciers and incite natural events to occur, which may trigger avalanches, landslides (Kanwal et al., 2017) and retreating of frozen moraine which eventually create glacial lake outburst floods causing severe damage to the low lying resettlements in terms of infrastructure and death casualties. Therefore, a continuous
monitoring plan is needed to evaluate the changes in supraglacial lakes by scientific means to develop an early warning system to mitigate the disaster prior to its occurrence. Another reason to assess the changes in supraglacial lakes is to interpret the glacier mass-balance or climate. Supraglacial lakes may connect with each other and with moulins through supraglacial water channels.
Hispar glacier is the third largest glacier of Himalayan region and is located in Hunza. It is a remote area with little vegetation but with stronghold of many animals including Himalayan bear, ibex, markhor and the snow leopard. The glacier is about 62 kilometers long and its ice cover was estimated to be 409 square kilometers , whereas its catchment (watershed) area was estimated to be 1318 square kilometers.
Role of Remote Sensing & GIS
Policy makers and development workers need series of information for effective decision making to mitigate the hazards caused by climatic changes (Shafiq et al., 2011) and specifically the consequences of the formation of supraglacial lakes which are one of the causes in the acceleration of glacial lake outburst floods in low-lying areas, causing severe destruction in terms of money and casualties of people. Therefore, ISSN: 2223-957X
quick response and systematic monitoring and assessment of glaciers and glacial lakes are mandatory. Since the glaciers in Pakistan are located at high relief difference therefore, it is very tough, laborious, expensive and even time taking to map and monitor glaciers and superficial features by predictable methods. Because of these constraints, other methods using newest innovatory techniques like Remote Sensing (RS) and Geographical Information System (GIS) are required to assess the glaciers.
Terrain Analysis of Study Area
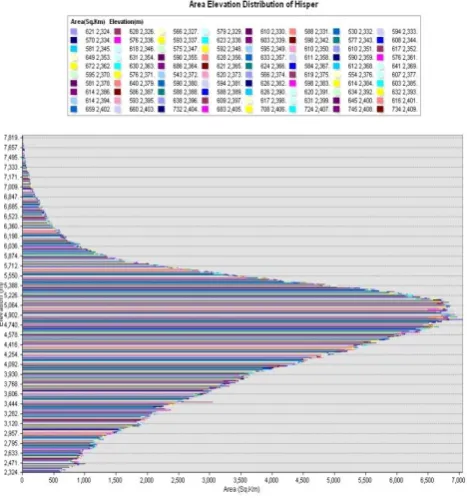
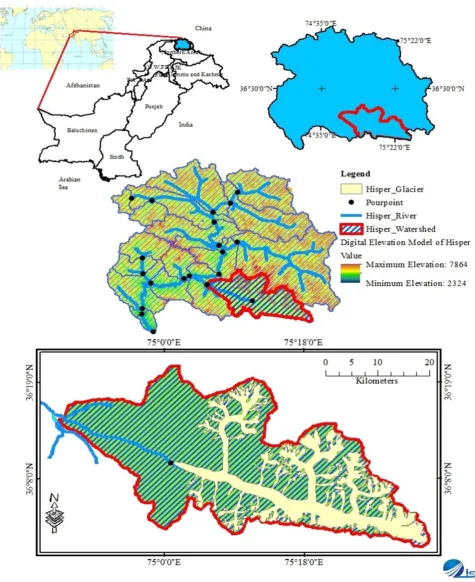
The study area of Hispar glacier lies in 36.086970, 75.267622 in the Hunza sub-basin of Upper Indus Basin (UIB). DEM from SRTM at 1-Arc Sec has been used to map the Hunza river basin and the study area- Hispar sub-basin indicating the altitudinal zones (Fig. 1). The study area of Hispar watershed’s elevation curve lies between 2324 (masl) and 7864 (masl) with a mean elevation of about 5067.765 (masl). The hypsometric curve (Fig. 2) of Hispar watershed is positively skewed depicting that Hispar river basin possesses the similar areal extent as that of Hunza, which covers large area dominated by minimum elevated peaks (masl).
Fig. 1Elevation zones extracted from the DEM of the Hispar
river basin.
Geographically, Hispar glacier lies in the central part of Hunza basin. The water from Hispar river and Barpu river join the Nagar river, which ultimately pours into Hunza river at coordinates 36.307767, 74.665204. Hunza river finally moves down steep and at coordinates of 35.912664, 74.369010. Hunza river opens into the lowest elevation i.e. Danyore to form another extension of Indus river named as Gilgit river. Due to high elevated area, Hispar has no human intervention instead of surrounding by neighboring glaciers like Golden Peak, Hopper glacier, Spantik, Bowalter glacier, Barpu White glacier and the Rush lake (high altitude wetland) are in Nagar-1. While Batura glacier, Sony Pakosh and Barodaruksh lakes are located in Bar valley Nagar-2.
The climate of this region remains pleasing from mid-April to the end of September. The most thrilling season in the Hunza, Pakistan is the autumn. At the end of the summer season mostly in September, the orchards start changing colors synonymously as bride and groom dresses’ colors. The maximum temperature recorded in summer during the day is 13°C. However, winters are very cold mostly from October till the end days of March. The minimum temperature can be -14°C.
Fig. 2 Hypsometric curve of Hispar Watershed.
The Hindu Kush-Himalayan (HKH) snow and ice-fed mountains serve as a natural water reservoir for the constant supply of water to the Indus river and its tributaries. Therefore, it is necessary to study the dynamics of this region for water management (Tahir et al., 2011). Garee et al., (2017) used Soil and Water Assessment Tool (SWAT) model to study Gilgit, Baltistan, since it provides the uniqueness in terms of varying elevation, exclusive glacier areal extent and snow cover dynamics, which ultimately assist in understanding the hydrological processes occurring in region accurately (Garee et al., 2017). In this connection, watershed management of Hunza plays a vital role in maintaining Pakistan’s agricultural economy. It is contributing to the outflow of glaciated water in the world’s largest irrigation system– Indus Basin Irrigation System (Young and Hewitt, 1990).
Hunza river contributes >12% of the total flow into Indus river system, upstream of the Tarbela dam, where 80% of the total inflow emerges from the snowy and highly glaciated region above 3500 m.a.s.l. (Hewitt, 1989, Young and Hewitt, 1990, Wake, 1989). Hunza basin is also divided in five sub-basins, Khunjerab, Shimshal, Hispar, Ziarat and Naltar. Interestingly, the glaciated area of Hunza basin is computed to be 34% (Roohi et al., 2005), 33% (Tahir
et al., 2011) and 31% (Shafiq, 2012).
Basin Definition
To define a watershed or a basin, the topographical analysis of the area is required. The topographic information is obtained from DEMs (Digital Elevation Model). DEM is helpful for extracting terrain parameters in a variety of applications such as
landslides, avalanches, glacier mapping and monitoring, creation of relief maps, surface analysis for hazards, risks and damage assessment and other geomorphological studies. In this connection,
modelling of topography of a region is done using (DEM) Digital Elevation Model (Usul and Pasaogullari, 2004). DEM of Hisper glacier watershed was first reconditioned by filling the depressions in DEM i.e. to create a depression less DEM. The second reconditioning phase of DEM is to compute the flow direction of each cell in depression less DEM (Jenson, 1991).
This D-8 method of flow direction indicates where water flows from a cell. In order to compute flow direction, 3*3 cell grid helps to find the lowest neighboring cell from the center (Merwade, 2012). The third reconditioning phase of DEM is to compute flow accumulation in each cell and in other words, the accumulation of flow in each downslope cell. Flow accumulation in downslope cells indicates the number of upstream cells that flow in them. Stream channels are easily identified by the cell occupying areas of concentrated flow. Cells which have a flow
accumulation value of zero correspond to the cells with no other cell flow in them, which represent the pattern of ridges (Jenson and Domingue, 1988; Merwade, 2012).
Delineating watershed
Delineating watershed is done to acquire accuracy for the runoff calculation and climatic interpolation. Therefore, delineation of watershed is performed by opting DEM reconditioning phase and further analysis which involves: (a) Creation of shape file of outlets or pour points (b) Snapping of pour points (c) Watershed delineation (Fig. 3).
This hypsography of Hispar glacier watershed is based on SRTM 1 Arc Second yielded 1227685 spikes at different elevations, covering a total area of about 1318.24 km2 with elevation distribution ranging from 3030 m to 7828 m. This watershed has an average of peaks at an elevation of 4918.123 m.
Material and Methods
Details of methodology are shown in section 4.3 on data processing. This study was aimed at:
a) Mapping the supraglacial lakes on Hispar glacier b) Comparing different remote sensing techniques /
methods
1) Image classification; like supervised and unsupervised classification.
2) Pan sharpening i.e. to enhance the spatial resolution of satellite imagery.
3) Band rationing i.e. to enhance water by applying different band ratios.
4) Index such as NDWI i.e. to enhance only water bodies.
c) Evaluating the time series of areal extents of supraglacial lakes.
d) Delineating vulnerable supraglacial lakes of areal sizes ≤ 0.05 sq.km on Hispar glacier.
Datasets Specification and Details
The imageries shown in Table 1 were used for delineating supraglacial lakes and they were obtained from USGS Earth Explorer of the following years of 1990, 2000, 2010, 2016 and 2017.
Data Processing
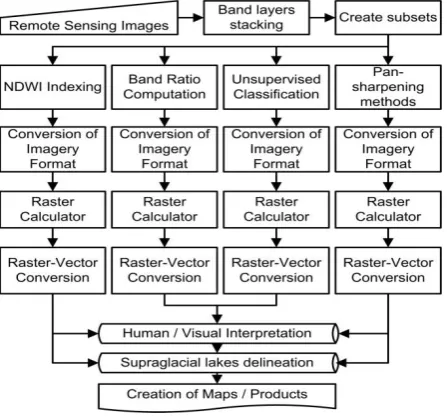
The Landsat time series imageries were layer stacked, and then extract was applied on a stacked image to derive the areal subset of Hispar glacier. A false colour composite (FCC) – zoomed, of Landsat 8 OLI is shown in Figure 4. All the Landsat time series imageries were used to detect supraglacial lakes by applying different remote sensing techniques as illustrated in Figure 5.
Fig. 5 Methodological Framework.
Results and Discussion
All the research findings are discussed in this section. The vulnerable lakes were mapped and illustrated in maps along with their delineation by using different
remote sensing. However, firstly the databases of supraglacial lakes were formulated of following research periods using different remote sensing, the lakes delineated in 2017 are as shown in Table 2.
Table 1 Datasets specification and details.
S.No Imagery ID Sensor Date of
Acquisition Path Row % CC
1 LC8149035201
7213LGN00 OLI 21-32017 149 35 3.60
2 LC814903520
16275LGN01 OLI 27-5-2016 149 35 1.87
3 LT514903520
10146KHC00 TM 14-6-2010 149 35 4.00
4 LT5149035200
0103AAA02 TM 10-3-2000 149 35 3.00
5 LT5149035199
0219ISP00 TM 21-9-1990 149 35 1.00
Comparative Analysis of Remote Sensing Techniques
As indicated in Figure 6 & 7, the comparison among four different remote sensing is being done to increase the visual distinction between features in a scene. According to this acquired result, Pan sharpening showed the best result among the four techniques because of its accurate delineation of a water polygon. The acquired area of the polygon was found to be 65116 sq. meters with a perimeter of 1680 meters. However, it is appropriate to say that Pan sharpening results are much more accurate as compared to other three. Classification, on the other hand, stood second in line whereas, band ratio and NDWI showed increased deviated results. The accuracy of visual interpretation has some reasons and all those reasons are summarized in attained illustrations of later years of superglacial lakes. However, the acquired area and perimeters of water polygon of 2017 can be seen in Table 3. The illustrated maps are as follows.
pure water pixels via opting an editing tool, which gave the outcome of pan sharpened image. However, the water polygons were edited and delineated to create their database of area and perimeter which can be seen in Table 3.
According to 2010, Classification is showing the best
result as compared to other two techniques. Technically, unsupervised classification was selected among other classifications in this illustration, NDWI and Band Ratio showed similar results as compared to classification. They are however mainly used to reduce the topographic effects and enhance the spectral slope other than the accurate visual interpretations of the
Table 2 Numbers of Supraglacial Lakes delineated by using different Remote Sensing Techniques.
S No Techniques 2017 2016 2010 2000 1990
1 Band Ratio 33 25 150 47 70
2 Unsupervised Classification 33 26 150 45 69
3 NDWI 33 25 150 45 70
4 Panchromatic Sharpening 28 25 - - -
Fig. 6 Comparative analysis of remote sensing techniques (a) Year 2017, (b) Year 2016, (c) Year 2010, (d) Year 2000.
Table 3. Area and perimeters of remote sensing techniques.
Sr. RS Techniques Area (Sq. Meters) Perimeter (Meters) Year
1 Band Ratio 61806 1802.8 2017
2 NDWI 93035 1774.0 2017
3 Unsupervised Classification 76108 1859.3 2017
4 Pan Sharpening 65116 1680.1 2017
5 Band Ratio 140759 2061.2 2016
6 NDWI 64708 1831.8 2016
7 Unsupervised Classification 47237 1652.3 2016
8 Pan Sharpening 58782 2333.6 2016
9 NDWI 55667 1202.2 2010
10 Unsupervised Classification 45229 1183.6 2010
11 Band Ratio 56281 1220.5 2010
12 NDWI 44377 855.8 2000
13 Unsupervised Classification 44389 965.9 2000
14 Band Ratio 75841 1072.0 2000
15 NDWI 22952 596.6 1990
16 Unsupervised Classification 31725 869.1 1990
delineation of pure water pixels. The area and perimeters of 2010’s image are discussed in Table 3.
Fig. 7 Comparative Analysis of Remote Sensing Techniques- 1990
In 2000, again classification showed the best result among the other two remote sensing techniques. Here, Band Ratio extracted polygons of mixed pixels i.e. other than water. Thus, it does not correlate with the research scope. And NDWI showed better result as compared to band ratio but leaving some of the pure water pixels into clustering consideration. And, classification clustered all the pure water pixels as per research’s objectives. Thus, classification should again be considered as the best technique among the twos because of its accuracy in visual interpretations. The area and perimeter of water polygons calculated can be seen in Table 3.
In this image of 1990, classification showed a bigger polygon as compared to other two because carrying out manual editing, other small polygons which were created due to clustered similarities among spectral curves were edited to some extent to have a proper alignment of feature space. However, NDWI and band ratio again showed the same results but highlighted only the water pixels, which are accurately visualized. Though, classification showed a varied cluster of water pixel ranging from dark blue to light blue it was probably indicating the turbidity factor in water or mixing with some other cover type snow. It would be better to say that band ratio and NDWI showed better results as compared to classification, since the research depends on the delineation of supraglacial lakes and i.e. the pure water pixels and hence all the dark blue pixels are being aligned in polygon extracted by band ratio and NDWI techniques. It would rather be appropriate to say that all these techniques are same but varies according to the research objectives. In this
research, pure water pixels were to be delineated thus, only those extracted polygons were taken into considerations which showed the accurate visual interpretations of water presence. The areal extents and perimeters of extracted water polygons can be viewed in Table 3.
Conclusion
This study used Remote Sensing and GIS techniques for the delineation of supraglacial lakes along with satellite images supplemented by DEM data to update the inventory of supraglacial lakes on the Hispar glacier. The areal changes in supraglacial lakes over
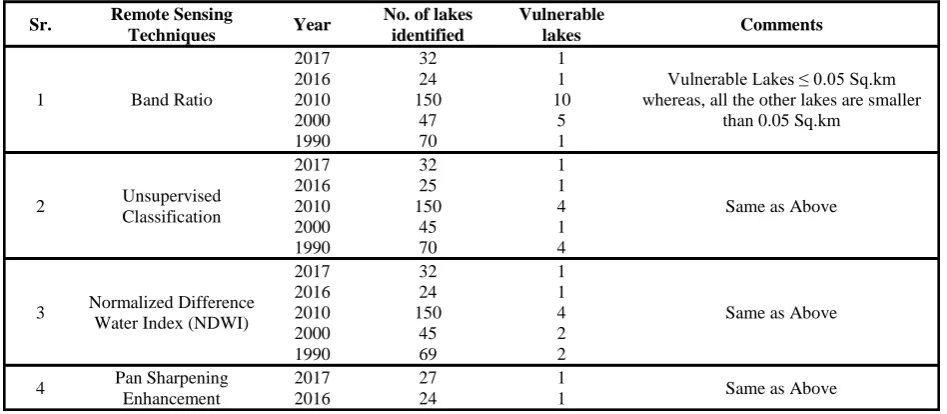
Table 4 Summary of Numbers of Supraglacial and Vulnerable Supraglacial lakes delineated by using different remote sensing techniques.
Sr. Remote Sensing
Techniques Year
No. of lakes identified
Vulnerable
lakes Comments
1 Band Ratio
2017 2016 2010 2000 1990 32 24 150 47 70 1 1 10 5 1
Vulnerable Lakes ≤ 0.05 Sq.km whereas, all the other lakes are smaller
than 0.05 Sq.km
2 Unsupervised
Classification 2017 2016 2010 2000 1990 32 25 150 45 70 1 1 4 1 4
Same as Above
3 Normalized Difference
Water Index (NDWI)
2017 2016 2010 2000 1990 32 24 150 45 69 1 1 4 2 2
Same as Above
4 Pan Sharpening
Enhancement 2017 2016 27 24 1
the last five decades were also analyzed. The results show varied numbers of lakes being delineated by using Band Ratio, Normalized Difference Water Index (NDWI), Unsupervised Classification and Panchromatic Sharpening Enhancement techniques. The vulnerability of natural disasters associated with the formation of supraglacial lakes was also assessed. The lakes with the areal size ≤ 0.05 sq.km were delineated to be selected as hazardous for the low-lying valleys. However, for each consecutive year, area of vulnerable lakes and total area occupied by supraglacial lakes were calculated and showed that Panchromatic Sharpening Enhancement Technique proved to be the best among other three remaining techniques. It has also been analyzed by comparing all the techniques that 2010 was the year under climatic stress when higher numbers of supraglacial lakes were formed. Though with the result, it is proved that 90% of the formation of lakes started in 1990, following in the year of 2000 and in 2010, when more supraglacial lakes were formed and observed. It is more accurate to say that the period from 1990 to 2010 i.e. the span of 30 years altogether was in climatic stress with more vulnerable supraglacial lake. Remote Sensing Technique assisted in providing the milestone for the first-time delineation of supraglacial lakes. However, their areal sizes were also calculated and formed to be varied in numbers. The varied numbers of supraglacial lakes delineated by following four different Remote Sensing Techniques, which are all summarized in Table 4.
By comparing all these techniques, Panchromatic Sharpening Enhancement Technique provided the best result in visual interpretation. Then Unsupervised Classification since each water class was spectrally differentiated, though it was hard to reclassify the polygons but results which were obtained were all satisfactory. In the end we observe, NDWI and Band Ratio, the results obtained by using NDI were better than Band Ratio separating water from other classes. Oppositely, Band Ratio mixed all the classes making it harder for the user to interpret the differences and distinguish among water related classes. However, all the statistics pertaining to the research are discussed in the mentioned illustrations and tables.
This study is especially helpful for government and private organizations like NDMA, PDMA, WAPDA, PMD and NGOs for deducing the glacial response to climate change and to mitigate the massive devastation from the supraglacial lakes in terms of physical, social and biological damages at the low-lying areas of Hispar glacier. This proposed research methodology
will be a blue print for future glacier and glacial lakes hazard identification. This work will also help to make web based GIS system, which can predict supraglacial lakes formation and vulnerable surfaces of glaciers where supraglacial lakes can be originated on weekly, monthly and yearly basis. This will assist decision makers in managing and generating imminent action plans to mitigate the disaster.
Acknowledgement
The authors would like to acknowledge Space and Upper Atmospheric Research Commission (SUPARCO), the national space agency of Pakistan for awarding this project to the first author. This work has been completed within the framework of ‘SUPARCO-Academia Collaboration Program’ with an objective to identify the potentially dangerous supraglacial lakes on the Hispar glacier. We would like to thank Dr. Muhammad Mansha for administrative support and Mr. Adnan Aziz for technical support from Directorate of Earth Sciences, SUPARCO, Pakistan as well as anonymous reviewers for their valuable and insightful comments.
References
Garee, K., Chen, X., Bao, A., Wang, Y., Meng, F. (2017). Hydrological modeling of the upper Indus basin: A case study from a high-altitude glacierized catchment Hunza. Water, 9 (1), 17.
Hewitt, K. W., C.; Young, G.; David, C. (1989). Hydrological investigations at Biafo glacier, Karakorum range, Himalaya, an important source of water for the Indus river. Ann. Glaciol. 13: 103–108.
Immerzeel, W. (2008). Spatial modeling of mountainous basins: an integrated analysis of the hydrological cycle, Climate Change and Agriculture, 369pages.
Jenson, S. K., & Domingue, J. O. (1988). Extracting topographic structure from digital elevation data for geographic information system analysis.
Photogrammetric Engineering and Remote Sensing, 54 (11), 1593-1600.
Jenson, S. K. (1991). "Applications of hydrologic information automatically extracted from digital elevation models." Hydrological Processes 5(1): 31-44.
Merwade, V. (2012). Watershed and stream network delineation using ArcHydro Tools. School of Civil Engineering, Purdue University, 1-7.
Shafiq, M., Santos, B., Perez, AA., Blank, C. (2011) Global climate data exchange and differences in approaches of policy makers, scientists and the community, Proceedings of the Earth Observation Symposium of 62nd International Astronautical Congress (IAC), IAC-11.B1.6.4, doi: 10.13140/ 2.1.2539.8569.
Shafiq, M. (2012) Modelling runoff and glacier melt in the Hunza basin in northern Pakistan using satellite remote sensing techniques, PhD Dissertation, University of Innsbruck, Innsbruck, Austria.
Roohi, R., P. Mool, S. Bajracharya, B. Shrestha, S. Joshi, A. Ashraf, . . . M. Chaudhry (2005). Indus Basin (Pakistan Himalaya), Inventory of Glaciers and Glacial Lakes and the Identification of Potential GLOFs affected by Global Warming in the Mountains of Himalayan Region. PARC, APN, ICIMOD, UNEP Report.
Tahir, A. A., Chevallier, P., Arnaud, Y., Neppel, L., Ahmad, B. (2011). Modeling snowmelt-runoff under climate scenarios in the Hunza river basin, Karakoram range, northern Pakistan." Journal of Hydrology, 409(1–2): 104-117.
Usul, N., O. Pasaogullari (2004). Effect of map scale and grid size for hydrological modelling. IAHS-AISH Publication 91-100.
Wake, C. P. (1989). Glaciochemical investigations as a tool for determining the spatial and seasonal variation of snow accumulation in the central Karakoram, northern Pakistan. Ann. Glaciol. 13, 279–284.
Young, G., Hewitt, K. (1990). Hydrology research in the Upper Indus Basin, Karakoram Himalaya, Pakistan. Hydrol. Mt. Areas. IAHS Publ., 190,139–152.
Zhang, X. S., R.; Hao, F. (2007). Predicting hydrologic response to climate change in the Luohe river basin using the SWAT model. Trans. ASABE,