N O T E
Influence of a wide range of moisture contents on the Poisson’s
ratio of wood
Mayu Mizutani•Kosei Ando
Received: 18 August 2014 / Accepted: 6 October 2014 / Published online: 21 October 2014
ÓThe Japan Wood Research Society 2014
Abstract This study investigates the effect of a wide range of moisture contents (0–177 %) on the Poisson’s ratio of wood taken from Japanese cypress and magnolia by conducting longitudinal compression tests. Through analysis of variance and multiple comparisons, it was found that when the moisture content is below the respective fiber saturation point Poisson’s ratio decreases with increasing moisture content. In contrast, at moisture contents above the fiber saturation point, the Poisson’s ratio increases with moisture content. The same tendency was observed in both wood species, but the effect was more pronounced in magnolia than Japanese cypress.
Keywords Poisson ratioMoisture contentFree water Transverse strainFiber saturation point
Introduction
Wood is an inherently hygroscopic material, and as its mechanical behavior is highly dependent on its moisture content (MC) [1–4], it requires careful attention to prevent deformation and breakage during the drying process. More-over, given that dried wood is often used as a structural material in environments with changing climate, it is impor-tant to understand how its mechanical behavior is affected by changes in MC due to variation in relative humidity (RH).
In addition to Young’s modulus and the shear modulus, Poisson’s ratio is one of the key elastic constants used to express the two- and three-dimensional deformation of a
material. However, although there have been numerous studies into the dependence of Young’s modulus and shear modulus on the MC of wood and wood-based materials, the relation between MC and Poisson’s ratio is still poorly understood due to the fact that the results that have been obtained [5–11] tend to vary with wood species, loading method and loading direction; and thus, many aspects of the control mechanism of the Poisson effect remain unclear. Furthermore, most previous studies used a MC range that was narrow and did not exceed 20 %, thus making the results of limited value to understanding 2D and 3D deformation during the drying of wood. Specifi-cally, MCs above 30 % typically exceed the fiber satura-tion point (FSP) of wood, with any further increase in MC being due to a greater quantity of free water. This free water is considered to have a significant influence on Poisson’s ratio, especially on the development of trans-verse strain. It is therefore worthwhile and physically meaningful to examine the Poisson effect under a wide range of MCs above the FSP.
In the present study, compression tests were carried out in a longitudinal direction on Japanese cypress and mag-nolia to investigate the dependence of Poisson’s ratio on MC, with the MC being varied across a wide range between 0 and 177 %.
Poisson’s ratio is defined as: mij¼ ej
ei ði;j¼L;T;RÞ ð1Þ where ei is the longitudinal (positive) strain along the loading direction andejis the transverse (passive) strain in the direction perpendicular to loading direction. The sub-scripts iandjdenote the orthogonal directions, which are longitudinal (L), radial (R) and tangential (T). And we determined both mLTandmLRin this study.
M. MizutaniK. Ando (&)
Graduate School of Bioagricultural Sciences, Nagoya University, Chikusa-ku, Nagoya 464-8601, Japan e-mail: musica@agr.nagoya-u.ac.jp
°C and 55 % RH was 427
respectively. The width of the annual ring in the Japanese cypress and magnolia specimens was 1.6±0.2 and 1.3±0.3 mm, respectively.
All specimens were kept in a laboratory that was maintained at a constant temperature of 25°C and were repeatedly conditioned at various RHs to achieve equilib-rium MCs ranging from very high (177 or 164 %) to very low (0 %). Compression tests were conducted at each MC level using the same specimen, with the MC values tested given in Table1. In all, eight different MC levels were used with the Japanese cypress and six levels were used with the magnolia. To achieve MCs of 164.3 and 177.0 %, the air-dried specimens were first immersed in purified water under vacuum for 3 h, and then water was injected into them under atmospheric pressure. Specimens with 77.6 and 84.8 % MC were obtained by gradually drying from a water-saturated state in a thermo-hygrostat at 90 % RH, after which they were conditioned at 100 % RH prior to testing. Specimens with 23.7 and 26.4 % MC were con-ditioned at 99 % RH after being gradually dried at 90 % RH to the near the FSP. Specimens with 9.5 and 12.0 % MC were conditioned at 70 % RH, while those with 6.8 % MC were conditioned at 50 % RH. Specimens with a MC in the range of 2.1–5.5 % were conditioned in a desiccator containing different saturated salt solutions: MgCl2 for
level. Biaxial strain gauges (gauge length, 2 mm; Tokyo Sokki Kenkyujo, WFCA-2-11) were attached to the central regions of the four planes of the specimen to measure both longitudinal and transverse strain; each value reported being an average for the opposite planes. The Poisson’s ratio of each sample was then determined from the linear range of the longitudinal-transverse strain diagram.
All compression tests were performed immediately after removing the specimen from its climate-controlled box, and both the temperature (25 °C) and humidity (55 % RH) were kept constant during the tests. The effectiveness of this was confirmed by the fact that the MC of the 0.0 % specimen did not increase by more than 0.1 % during testing.
Results and discussion
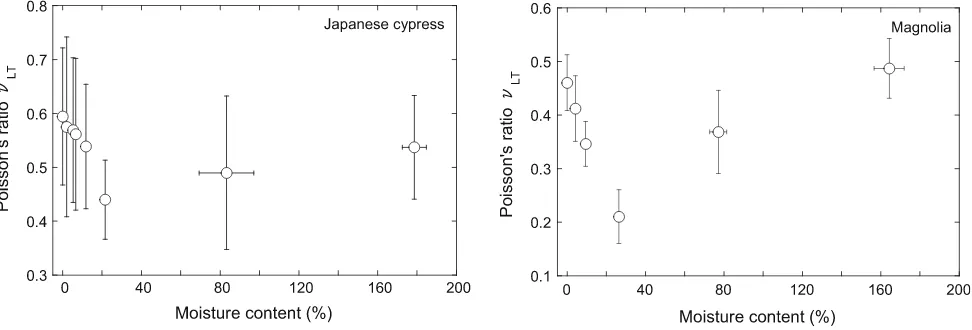
Figure1shows the relationship between MC and Poisson’s ratio in the R direction (mLR) of Japanese cypress and magnolia, while Fig.2 shows the same relationship in the T direction (mLT). We can see from this that the Poisson’s ratio of both Japanese cypress and magnolia is apt to decrease with increasing MC when the MC is below the FSP, but increases when the MC is above the FSP.
Specimens in this study were conditioned at various equilibrium MCs after a water-saturated processing from an air-dried condition; and although the drying history of wood is considered to affect Poisson’s ratio, we could not find any information pertaining to this effect in previous reports.
Previous studies [11,12] have, however, reported wide variation in the Poisson’s ratio of wood due to a high coefficient of variation, and this study arrived at a similar conclusion. To overcome this, a one-way layout ANOVA analysis was performed on the Poisson’s ratio values obtained, which revealed a direct correlation with MC regardless of the wood species or the difference inmLRand mLT (p\0.05). To further examine the difference in Poisson’s ratio between specific MC levels Tukey’s
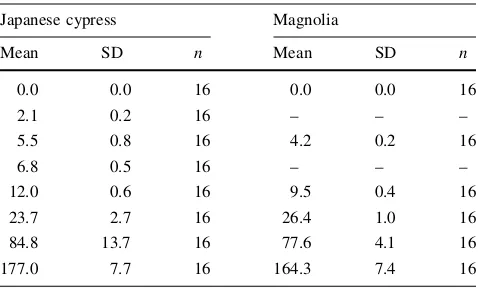
Table 1 Moisture contents (%) used in the experiments
Japanese cypress Magnolia
Mean SD n Mean SD n
0.0 0.0 16 0.0 0.0 16
2.1 0.2 16 – – –
5.5 0.8 16 4.2 0.2 16
6.8 0.5 16 – – –
12.0 0.6 16 9.5 0.4 16
23.7 2.7 16 26.4 1.0 16
84.8 13.7 16 77.6 4.1 16
177.0 7.7 16 164.3 7.4 16
multiple comparisons were carried out, the results of which are presented in Tables2–5. It is evident from this that the mLR of Japanese cypress varies significantly between MCs of 23.7 (which is close to the FSP) and 0.0, 2.1, 5.5, 6.8, 12.0, 84.8 and 177.0, as well as between 0.0 and 12.0 (Table2). Similarly, the mLR of magnolia exhibits signifi-cant differences between MCs of 26.4 (which is close to FSP) and 0.0, 4.2, 9.5, 77.6 and 164.3, as well as between 0.0 and 9.5 (Table3). ThemLTof Japanese cypress exhibits a significant difference between MCs of 0.0 and 23.7 (Table4). The mLT of magnolia shows significant differ-ences between MCs of 26.4 and 0.0, 4.2, 9.5, 77.6 and 164.3; between 77.6 and 164.3; and between 9.5 and 0.0, 4.2 (Table5). These results therefore confirm the notion that the Poisson’s ratio of both Japanese cypress and magnolia generally decreases with increasing MC when the MC is below FSP, but increases when the MC is above FSP. What is notable, however, is that this trend is much more pronounced in magnolia than Japanese cypress.
Increasing the MC at levels below the FSP has been previously shown by Carrington [5] in four-point bending tests of spruce with a MC of 0–30 % to increase mLT and decrease mLR; however, Kretschmann and Green [7] observed a decrease in both mLTand mLR during the com-pression of southern pine (MC of 4.4 % to FSP). Hering et al. [8] also observed a slight decrease in bothmLTandmLR during the compression of beech (MC 8.7–17.9 %), yet the beech using an ultrasonic method (MC 9.6–18.7 %) by Ozyhar et al. [9] yielded an increase in bothmLTandmLR. Subsequent work by Ozyhar et al. [10] into beech under tension (MC 5.9–16.3 %) found an increase in mLT and slight drop inmLR; but with both tension and compression [11], the effect of MC within a range of 0.0–16.3 was determined to be minimal. Although the fact that these are different wood species obviously needs to be considered, unequal loading conditions and different specimen shapes may also explain the wide variation in values and behavior. Significantly, the behavior of Poisson’s ratio differs
Fig. 1 Relationship between moisture content and Poisson’s ratio,mLR, in (left) Japanese cypress and (right) magnolia.Error barsstandard
deviation
Fig. 2 Relationship between moisture content and Poisson’s ratio,mLT, in (left) Japanese cypress and (right) magnolia.Error barsstandard
remarkably from that of Young’s modulus and strength, both of which typically reduce with increasing MC until the FSP is reached, regardless of the loading method. This suggests that the mechanism of the Poisson effect in wood is largely dominated by the microscopic/macroscopic tis-sue structure of wood.
There have been very few studies to date into Poisson’s ratios at MCs above FSP, although Carrington [5] did find bothmLTandmLRto remain almost constant with increasing MC in four-point bending tests of spruce (MC 30–72 %). This differs from the outcome of the present study, in which an increase with MC was observed that is believed
to result from the filling effects of incompressible water. At MCs above the FSP, the increase in MC is due to the increase in free water. Moreover, the fact that this free water does not combine with the wood substances means that it has no significant effect on shrinkage or swelling of wood. Instead, the cell lumina and void spaces between cell-wall substances become filled with free water, which being incompressible, causes them to move in the T and R directions under the Poisson effect when a compressive load is applied in the L direction. This results in greater deformation in the transverse direction, with the sub-sequent increase in transverse strain increasing both mLT and mLR compared to instances in which there is no free water. In other words, it is the presence of liquid water (which has a Poisson’s ratio of 0.5) that increases the Poisson’s ratio of wood with a MC above its FSP.
Conclusions
Through compression tests of Japanese cypress and mag-nolia specimens at equilibrium MCs ranging from water-saturated to completely dry, it has been shown that Pois-son’s ratio mLT and mLR decrease with increasing MC at levels below the FSP, but increase at levels above the FSP.
Table 3 Pvalues derived from a Tukey’s multiple comparison test of
mLRat six different moisture content levels in Magnolia
MC0.0 MC4.2 MC9.5 MC26.4 MC77.6
MC4.2 0.425 –
MC9.5 0.001** 0.179 –
MC26.4 0.000** 0.000** 0.028* –
MC77.6 0.105 0.937 0.805 0.001** –
MC164.3 0.999 0.613 0.004** 0.000** 0.187
MC4.2 represents a moisture content of 4.2 %
* Significant difference at p\0.05, ** significant difference at p\0.01
Table 4 Pvalues derived from a Tukey’s multiple comparison test ofmLTat eight different moisture content levels in Japanese Cypress
MC0.0 MC2.1 MC5.5 MC6.8 MC12.0 MC23.7 MC84.8
MC2.1 1.000 –
MC5.5 0.999 1.000 –
MC6.8 0.999 1.000 1.000 –
MC12.0 0.977 0.998 0.999 0.999 –
MC23.7 0.046* 0.191 0.345 0.431 0.731 –
MC84.8 0.609 0.813 0.877 0.905 0.990 0.991 –
MC177.0 0.971 0.998 0.999 0.999 1.000 0.727 0.990
MC2.1 represents a moisture content of 2.1 %
This same trend was observed in both wood species, but was more pronounced in magnolia than Japanese cypress. The change in the behavior of the Poisson’s ratio at MC levels above FSP is attributed to the presence of incom-pressible free water, but further work is still needed to explore this relation in different wood species and under different loading directions/methods.
References
1. Hearmon RFS (1948) The effect of moisture content. The elas-ticity of wood and plywood. Forest products research special report No.7. His Majesty’s Stationery Office, London, pp 21–25
2. Kollmann F (1951) The elasticity and strength of wood and engineering wood (in German). Technologie des Holzes und der Holzwerkstoffe. Erster Band. Springer, Berlin, pp 574–948 3. Brown HP, Panshin AJ, Forsaith CC (1952) Strength properties of
wood as affected by its moisture content. Textbook of wood technology, vol II. McGraw-Hill, New York, pp 514–519 4. Kollmann FFP (1968) Mechanics and rheology of wood.
Princi-ples of wood science and technology I: solid wood. Springer, Berlin, pp 292–419
5. Carrington H (1922) The elastic constants of spruce as influenced by moisture. Ae¨ronaut J 26:462–471
6. Neuhaus H (1983) Elastic behavior of spruce wood as a function of moisture content (in German). Holz Roh- Werkst 41:21–25 7. Kretschmann DE, Green DW (1996) Modeling moisture
content-mechanical property relationships for clear southern pine. Wood Fiber Sci 28:320–337
8. Hering S, Keunecke D, Niemz P (2012) Moisture-dependent orthotropic elasticity of beech wood. Wood Sci Technol 46:927–938
9. Ozyhar T, Hering S, Sanabria SJ, Niemz P (2013) Determining moisture-dependent elastic characteristics of beech wood by means of ultrasonic waves. Wood Sci Technol 47:329–341 10. Ozyhar T, Hering S, Niemz P (2012) Moisture-dependent elastic
and strength anisotropy of European beech wood in tension. J Mater Sci 47:6141–6150
11. Ozyhar T, Hering S, Niemz P (2013) Moisture-dependent orthotropic tension-compression asymmetry of wood. Holzfors-chung 67:395–404
12. Jeong GY, Hindman DP, Zink-Sharp A (2010) Orthotropic properties of loblolly pine (Pinus taeda) strands. J Mater Sci 45:5820–5830
Table 5 Pvalues derived from a Tukey’s multiple comparison test of
mLTat six different moisture content levels in Magnolia
MC0.0 MC4.2 MC9.5 MC26.4 MC77.6
MC4.2 0.231 –
MC9.5 0.000** 0.046* –
MC26.4 0.000** 0.000** 0.000** –
MC77.6 0.002** 0.402 0.931 0.000** –
MC164.3 0.819 0.012* 0.000** 0.000** 0.000**
MC4.2 represents a moisture content of 4.2 %